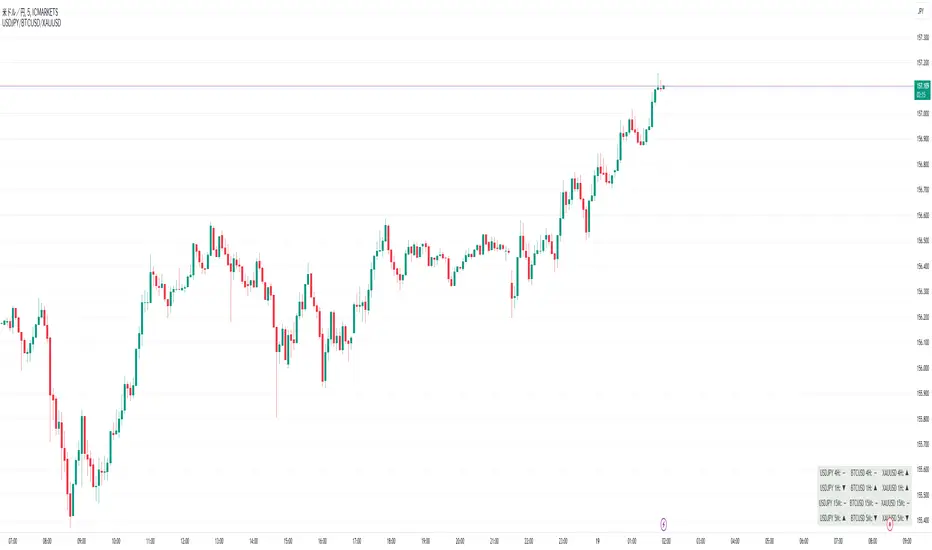
Perfect Order Alert USDJPY/BTCUSD/XAUUSDPerfect Order Alert USDJPY/BTCUSD/XAUUSD 日本語解説は下記
This indicator detects the perfect order of three moving averages and displays on the Panel in an easy-to-understand visual manner whether there is an uptrend, downtrend, or non-trend for each time leg.
This indicator detects perfect orders for the three currency pairs USDJPY/BTCUSD/XAUUSD on the 5-minute, 15-minute, 1-hour, and 4-hour time frames, and displays them on the Panel on the chart, with “▲” for up, “▼” for down, and “ー” for non-trend, so that you can quickly determine the trend. The panel is displayed on the chart.
In order to check for perfect orders without missing them, it is also possible to set up alerts that notify you of all the time frames and currency pairs as well.
Functions
Displaying 4H, 1H, 15M, 5M, up (▲), down (▼), other (-), of USDJPY/BTCUSD/XAUUSD on the panel.
*(By default, 20EMA, 75EMA, and 200EMA are hidden.)
Display position setting of the panel (You can choose from upper left, upper top, upper right, lower left, lower bottom, or lower right).
Panel color and text color change function
The moving average line can be hidden by default.
Moving average period change
Moving average color and thickness can be changed.
EMA/SMA switchable
Alert function - One alert can be set for each currency pair and time frame ▲▼, which is very useful.
Perfect Order Alert
You can use it even if you have a free account with only one alert setting.
To use the alert function, go to the Tradingview default alert settings, select “USDJPY/BTCUSD/XAUUSD” for the top item of conditions, and select “Call Alert() function” in the frame just below it!
_* Supplementary explanation: ____________
Please note that due to the limitation of the script, only 3 currency pairs and 4 time frames are displayed with 12 items (Panels for currency pairs other than USDJPY/BTCUSD/XAUUSD are also created, but they are indicators for other scripts, so if you are interested in other currency pairs, please use those. If you are interested in other currency pairs, please use them.)
Please note that we may change the functions or delete the indicator itself without prior notice.
Translated with DeepL.com (free version)
Reference image of the setting screenReference image of the setting screen
設定画面参考画像
3本の移動平均線のパーフェクトオーダーを検知し、時間足ごとに上昇トレンドか下降トレンドかノントレンドかを視覚的にわかりやすくPanelに表示するインジゲーターです。
このインジゲーターは、USDJPY/BTCUSD/XAUUSDの3通貨ペアの5分足、15分足、1時間足、4時間足のパーフェクトオーダーを検知して、チャートに表示されるPanelに、上昇は「▲」下降は「▼」ノントレンドは「ー」と、すぐに判断できる表示にしてあります。
パーフェクトオーダーを逃さずチェックできるように、それぞれの時間足や通貨ペアも全てを通知してくれるアラート設定が可能なのも特徴です。
機能紹介
・USDJPY/BTCUSD/XAUUSDの4H,1H,15M,5M,の上昇(▲),下降(▼),その他(-),をパネルに表示
※(デフォルトでは20EMA,75EMA,200EMAの3本で非表示にしてあります)
・パネルの表示位置設定(左上、上、右上、左下、下、右下、から選択できます。)
・パネルの色とテキスト色変更機能
・移動平均線表示非表示機能(デフォルトでは表示OFFにしてあります。)
・移動平均線期間変更
・移動平均線色と太さ変更
・EMA/SMA切り替え可能
・アラート機能ー1つのアラート設定で通貨ペアと時間足▲▼一つ一つを細かく教えてくれるので便利。
※パーフェクト オーダーアラート
無料アカウントで1つしかアラート設定できなくても使えます。
アラート機能はTradingviewデフォルトのアラート設定から、条件の一番上の項目を「USDJPY/BTCUSD/XAUUSD」選択、そのすぐ下の枠に「Alert()関数の呼び出し」を選択でOK!
_※ 補足説明____________
・スクリプトの制限の為、3通貨ペアと4つの時間足の12項目で表示させていますのでご了承ください
(USDJPY/BTCUSD/XAUUSD以外の通貨ペアのPanelも作成していますが別スクリプトのインジゲーターになりますので他の通貨ペアも興味がある方はそちらをお使いください)
・予告なしで機能の変更やインジゲーター自体の削除等行う事もあるかもなのでご了承ください。
In den Scripts nach "12月4号是什么星座" suchen
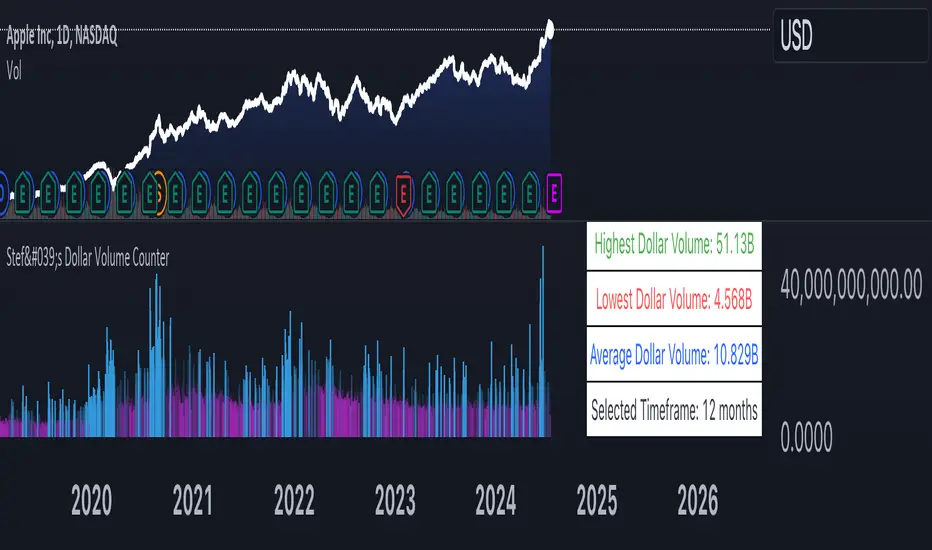
Stef's Dollar Volume CounterStef's Dollar Volume Counter is my second script that I've worked on and coded. I am proud of this script because it does something very, very important: it counts the AMOUNT of money traded, not just the amount shares/contracts traded. This is key for understanding where the big and small money is.
This script is totally different from other Volume scripts because it shows the amount of money traded, NOT the shares/contracts/coins etc. Also, more importantly, it is different from other volume indicators in the same space because this script is specifically focused on showcasing specific dollar volume amounts either as a table or as a label.
Here are the 5 key features you can utilize with this:
1. Customizable Gradient Colors for BIG money and SMALL money: Visually distinguishes between high and low dollar volumes. Change the colors as needed in the indicator settings menu.
2. Dollar Volume Counter Table: Positioned at the bottom right of the chart, this table provides quick insights into the highest, lowest, and average dollar volumes over a specified period. You can customize the time period in the settings menu.
3. "Wow! Much Money!" Labels: Highlights the top three recent highest dollar volumes within the visible chart area, emphasizing significant trading periods. Also, it's hilarious :)
4. Customize the period for volume analysis, ranging from 1 to 12 months or more, with the selected timeframe displayed in the table.
5. It opens as a new pane below the chart so that you can still analyze price and more, as needed.
Thanks for reading! I look forward to hearing your feedback. This script will be updated to expand on more concepts and I'll add some cool features soon.
Brooks 18 Bars [KintsugiTrading]Brooks 18 Bars
Overview:
This indicator allows traders to specify a time frame within each trading day and plots lines at the highest and lowest prices recorded during that period. It is particularly useful for identifying key levels of support and resistance within a specified time range.
Features:
User-Defined Time Frame: Traders can input their desired start and end times in a 24-hour format, allowing flexibility to analyze different market sessions.
High and Low Price Levels: The indicator plots lines representing the highest and lowest prices observed within the specified time frame each day.
Clear Visual Representation: The high and low lines are color-coded for easy identification, with the high & low prices in Kintsugi Trading Gold.
How to Use:
Set the Time Frame:
Adjust the "Start Time Hour" and "Start Time Minute" to define the beginning of your desired time frame.
Adjust the "End Time Hour" and "End Time Minute" to define the end of your desired time frame.
Analyze Key Levels:
Al Brooks popularized the following idea and basis for creating this indicator:
On a 5-minute chart, Bar 1 has a 20-30% chance of being the High or Low of the day.
Bar 12 has a 50% chance.
Bar 18 has an 80-90% chance.
Use the plotted lines to identify significant support and resistance levels within your specified time frame. These levels can help inform your trading decisions, such as entry and exit points.
Good luck with your trading!

Six PillarsGeneral Overview
The "Six Pillars" indicator is a comprehensive trading tool that combines six different technical analysis methods to provide a holistic view of market conditions.
These six pillars are:
Trend
Momentum
Directional Movement (DM)
Stochastic
Fractal
On-Balance Volume (OBV)
The indicator calculates the state of each pillar and presents them in an easy-to-read table format. It also compares the current timeframe with a user-defined comparison timeframe to offer a multi-timeframe analysis.
A key feature of this indicator is the Confluence Strength meter. This unique metric quantifies the overall agreement between the six pillars across both timeframes, providing a score out of 100. A higher score indicates stronger agreement among the pillars, suggesting a more reliable trading signal.
I also included a visual cue in the form of candle coloring. When all six pillars agree on a bullish or bearish direction, the candle is colored green or red, respectively. This feature allows traders to quickly identify potential high-probability trade setups.
The Six Pillars indicator is designed to work across multiple timeframes, offering a comparison between the current timeframe and a user-defined comparison timeframe. This multi-timeframe analysis provides traders with a more comprehensive understanding of market dynamics.
Origin and Inspiration
The Six Pillars indicator was inspired by the work of Dr. Barry Burns, author of "Trend Trading for Dummies" and his concept of "5 energies." (Trend, Momentum, Cycle, Support/Resistance, Scale) I was intrigued by Dr. Burns' approach to analyzing market dynamics and decided to put my own twist upon his ideas.
Comparing the Six Pillars to Dr. Burns' 5 energies, you'll notice I kept Trend and Momentum, but I swapped out Cycle, Support/Resistance, and Scale for Directional Movement, Stochastic, Fractal, and On-Balance Volume. These changes give you a more dynamic view of market strength, potential reversals, and volume confirmation all in one package.
What Makes This Indicator Unique
The standout feature of the Six Pillars indicator is its Confluence Strength meter. This feature calculates the overall agreement between the six pillars, providing traders with a clear, numerical representation of signal strength.
The strength is calculated by considering the state of each pillar in both the current and comparison timeframes, resulting in a score out of 100.
Here's how it calculates the strength:
It considers the state of each pillar in both the current timeframe and the comparison timeframe.
For each pillar, the absolute value of its state is taken. This means that both strongly bullish (2) and strongly bearish (-2) states contribute equally to the strength.
The absolute values for all six pillars are summed up for both timeframes, resulting in two sums: current_sum and alternate_sum.
These sums are then added together to get a total_sum.
The total_sum is divided by 24 (the maximum possible sum if all pillars were at their strongest states in both timeframes) and multiplied by 100 to get a percentage.
The result is rounded to the nearest integer and capped at a minimum of 1.
This calculation method ensures that the Confluence Strength meter takes into account not only the current timeframe but also the comparison timeframe, providing a more robust measure of overall market sentiment. The resulting score, ranging from 1 to 100, gives traders a clear and intuitive measure of how strongly the pillars agree, with higher scores indicating stronger potential signals.
This approach to measuring signal strength is unique in that it doesn't just rely on a single aspect of price action or volume. Instead, it takes into account multiple factors, providing a more robust and reliable indication of potential market moves. The higher the Confluence Strength score, the more confident traders can be in the signal.
The Confluence Strength meter helps traders in several ways:
It provides a quick and easy way to gauge the overall market sentiment.
It helps prioritize potential trades by identifying the strongest signals.
It can be used as a filter to avoid weaker setups and focus on high-probability trades.
It offers an additional layer of confirmation for other trading strategies or indicators.
By combining the Six Pillars analysis with the Confluence Strength meter, I've created a powerful tool that not only identifies potential trading opportunities but also quantifies their strength, giving traders a significant edge in their decision-making process.
How the Pillars Work (What Determines Bullish or Bearish)
While developing this indicator, I selected and configured six key components that work together to provide a comprehensive view of market conditions. Each pillar is set up to complement the others, creating a synergistic effect that offers traders a more nuanced understanding of price action and volume.
Trend Pillar: Based on two Exponential Moving Averages (EMAs) - a fast EMA (8 period) and a slow EMA (21 period). It determines the trend by comparing these EMAs, with stronger trends indicated when the fast EMA is significantly above or below the slow EMA.
Directional Movement (DM) Pillar: Utilizes the Average Directional Index (ADX) with a default period of 14. It measures trend strength, with values above 25 indicating a strong trend. It also considers the Positive and Negative Directional Indicators (DI+ and DI-) to determine trend direction.
Momentum Pillar: Uses the Moving Average Convergence Divergence (MACD) with customizable fast (12), slow (26), and signal (9) lengths. It compares the MACD line to the signal line to determine momentum strength and direction.
Stochastic Pillar: Employs the Stochastic oscillator with a default period of 13. It identifies overbought conditions (above 80) and oversold conditions (below 20), with intermediate zones between 60-80 and 20-40.
Fractal Pillar: Uses Williams' Fractal indicator with a default period of 3. It identifies potential reversal points by looking for specific high and low patterns over the given period.
On-Balance Volume (OBV) Pillar: Incorporates On-Balance Volume with three EMAs - short (3), medium (13), and long (21) periods. It assesses volume trends by comparing these EMAs.
Each pillar outputs a state ranging from -2 (strongly bearish) to 2 (strongly bullish), with 0 indicating a neutral state. This standardized output allows for easy comparison and aggregation of signals across all pillars.
Users can customize various parameters for each pillar, allowing them to fine-tune the indicator to their specific trading style and market conditions. The multi-timeframe comparison feature also allows users to compare pillar states between the current timeframe and a user-defined comparison timeframe, providing additional context for decision-making.
Design
From a design standpoint, I've put considerable effort into making the Six Pillars indicator visually appealing and user-friendly. The clean and minimalistic design is a key feature that sets this indicator apart.
I've implemented a sleek table layout that displays all the essential information in a compact and organized manner. The use of a dark background (#030712) for the table creates a sleek look that's easy on the eyes, especially during extended trading sessions.
The overall design philosophy focuses on presenting complex information in a simple, intuitive format, allowing traders to make informed decisions quickly and efficiently.
The color scheme is carefully chosen to provide clear visual cues:
White text for headers ensures readability
Green (#22C55E) for bullish signals
Blue (#3B82F6) for neutral states
Red (#EF4444) for bearish signals
This color coding extends to the candle coloring, making it easy to spot when all pillars agree on a bullish or bearish outlook.
I've also incorporated intuitive symbols (↑↑, ↑, →, ↓, ↓↓) to represent the different states of each pillar, allowing for quick interpretation at a glance.
The table layout is thoughtfully organized, with clear sections for the current and comparison timeframes. The Confluence Strength meter is prominently displayed, providing traders with an immediate sense of signal strength.
To enhance usability, I've added tooltips to various elements, offering additional information and explanations when users hover over different parts of the indicator.
How to Use This Indicator
The Six Pillars indicator is a versatile tool that can be used for various trading strategies. Here are some general usage guidelines and specific scenarios:
General Usage Guidelines:
Pay attention to the Confluence Strength meter. Higher values indicate stronger agreement among the pillars and potentially more reliable signals.
Use the multi-timeframe comparison to confirm signals across different time horizons.
Look for alignment between the current timeframe and comparison timeframe pillars for stronger signals.
One of the strengths of this indicator is it can let you know when markets are sideways – so in general you can know to avoid entering when the Confluence Strength is low, indicating disagreement among the pillars.
Customization Options
The Six Pillars indicator offers a wide range of customization options, allowing traders to tailor the tool to their specific needs and trading style. Here are the key customizable elements:
Comparison Timeframe:
Users can select any timeframe for comparison with the current timeframe, providing flexibility in multi-timeframe analysis.
Trend Pillar:
Fast EMA Period: Adjustable for quicker or slower trend identification
Slow EMA Period: Can be modified to capture longer-term trends
Momentum Pillar:
MACD Fast Length
MACD Slow Length
MACD Signal Length These can be adjusted to fine-tune momentum sensitivity
DM Pillar:
ADX Period: Customizable to change the lookback period for trend strength measurement
ADX Threshold: Adjustable to define what constitutes a strong trend
Stochastic Pillar:
Stochastic Period: Can be modified to change the sensitivity of overbought/oversold readings
Fractal Pillar:
Fractal Period: Adjustable to identify potential reversal points over different timeframes
OBV Pillar:
Short OBV EMA
Medium OBV EMA
Long OBV EMA These periods can be customized to analyze volume trends over different timeframes
These customization options allow traders to experiment with different settings to find the optimal configuration for their trading strategy and market conditions. The flexibility of the Six Pillars indicator makes it adaptable to various trading styles and market environments.

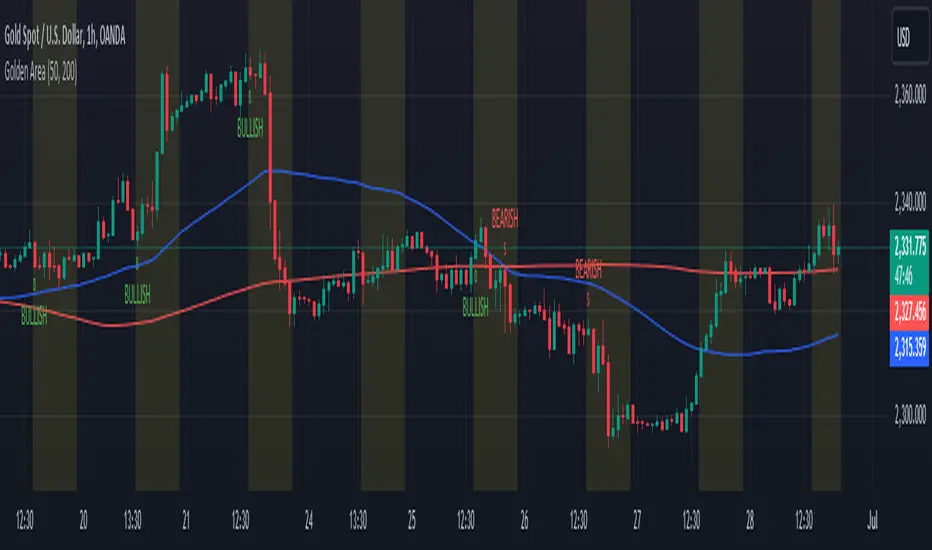
Golden Area### Golden Area Indicator Description
The "Golden Area" indicator is a technical analysis tool designed to assist traders by identifying potential buy and sell signals based on moving averages and support/resistance levels within a specific time frame. This indicator can be applied directly to price charts.
#### How It Works
1. **Inputs:**
- **MA50 Length:** The period length for the 50-period Simple Moving Average (SMA).
- **MA200 Length:** The period length for the 200-period Simple Moving Average (SMA).
2. **Calculations:**
- **MA50 (50-period SMA):** Calculated by averaging the closing prices over the past 50 periods.
- **MA200 (200-period SMA):** Calculated by averaging the closing prices over the past 200 periods.
- **Support Level:** The lowest price over the last 50 periods.
- **Resistance Level:** The highest price over the last 50 periods.
3. **Time Filter:**
- **Start Time:** The indicator becomes active at 12:30 IST (07:00 UTC).
- **End Time:** The indicator deactivates at 10:30 IST the next day (05:00 UTC).
- A background color change (yellow) highlights the active time range on the chart.
4. **Signals:**
- **Buy Signal:** Triggered when the current time matches the start time and the closing price is below the support level.
- **Sell Signal:** Triggered when the current time matches the start time and the closing price is above the resistance level.
5. **Plots:**
- **MA50:** Plotted as a blue line on the chart.
- **MA200:** Plotted as a red line on the chart.
- **Buy Signals:** Indicated by a green 'B' below the bars.
- **Sell Signals:** Indicated by a red 'S' above the bars.
This indicator provides visual cues for potential trading opportunities within the specified time frame, aiding traders in making informed decisions.
MTF Regime Filter II [CHE]Regime Filter II - Comprehensive Guide
Introduction
The "Regime Filter II " indicator is a tool designed to help traders identify market trends by smoothing price data and applying a color scheme to visualize bullish and bearish conditions. This guide provides a detailed explanation of the script's functionality, benefits, and how to use it effectively in TradingView.
Key Benefits
1. Trend Identification: Smooths price data to highlight underlying trends, making it easier for traders to spot potential buying or selling opportunities.
2. Visual Clarity: Uses distinct color schemes to differentiate between bullish and bearish market conditions, enhancing visual analysis.
3. Customization: Offers various settings to adjust smoothing and averaging lengths, choose between different color schemes, and set visibility for different timeframes.
4. Neutral Candle Option: Provides an option to display neutral candles for clearer visual representation when market conditions are neither strongly bullish nor bearish.
5. Timeframe Adaptability: Includes functions to determine appropriate step sizes based on different timeframes, ensuring the indicator remains accurate across various trading periods.
Script Breakdown
1. Indicator Declaration
The script starts by declaring itself as a TradingView indicator using the latest version of Pine Script. This sets up the framework for the indicator's functionality.
2. User Inputs for Smoothing and Averaging Lengths
The script allows users to input specific lengths for smoothing and averaging intervals. These inputs are crucial for determining how the price data is processed to identify trends. By adjusting these lengths, users can fine-tune the sensitivity of the indicator to market movements.
3. Color Scheme Selection
Users can choose between two color schemes: "Traditional" and "WT1 0 Rule". The selected color scheme will determine how the indicator colors the candles to represent bullish and bearish conditions. This customization enhances the visual appeal and usability of the indicator according to personal preferences.
4. Settings for Timeframe Visibility
The script includes settings that allow users to specify which timeframes the indicator should be visible on. This feature helps traders focus on the most relevant timeframes for their trading strategies. Additionally, users can set the number of recent candles to display, providing a clear view of the most recent market trends.
5. Color Definitions
The indicator defines specific colors for bearish and bullish candles. Bearish candles are colored red, while bullish candles are green. These color definitions are applied based on the selected color scheme and the calculated trend, providing a quick visual reference for market conditions.
6. Time Constants
To manage different timeframes effectively, the script uses constants that represent various time intervals in milliseconds, such as minutes, hours, and days. These constants are used to convert timeframes into a format that the script can work with to determine the appropriate step size for calculations.
7. Step Size Determination
The script includes a function that determines the step size based on the selected timeframe. This function ensures that the indicator adapts to different timeframes, maintaining its accuracy and relevance across various trading periods. The step size is calculated based on time intervals, and appropriate labels (like "60", "240", "1D") are assigned.
- For timeframes less than or equal to 1 minute, the step size is set to "60".
- For timeframes less than or equal to 5 minutes, the step size is set to "240".
- For timeframes less than or equal to 1 hour, the step size is set to "1D" (daily).
- For timeframes less than or equal to 4 hours, the step size is set to "3D" (three days).
- For timeframes less than or equal to 12 hours, the step size is set to "7D" (weekly).
- For timeframes less than or equal to 1 day, the step size is set to "1M" (monthly).
- For timeframes less than or equal to 1 week, the step size is set to "3M" (three months).
- For all other timeframes, the step size is set to "12M" (yearly).
8. Trend Calculation
The core of the indicator is its ability to calculate market trends. Here's a detailed breakdown of how the `calculateTrend` function works:
- Initialization: Variables for the middle price and scale, and summations of high/low prices and ranges, are initialized.
- Summation Loop: A loop runs over the smoothing length to calculate the sum of high and low prices and their range.
- Middle and Scale Calculation: The middle price is determined as the average of high/low sums, and the scale is calculated as a fraction of the average range.
- Normalization: The high, low, and close prices are normalized based on the middle price and scale.
- HT Calculation: The normalized prices are smoothed using a simple moving average (SMA).
- Frequency and Exponential Calculations: The frequency and related constants (a, c1, c2, c3) are calculated for further smoothing.
- Smoothed Moving Average (SMA): A smoothed moving average is computed using the HT values and exponential constants.
- WT1 and WT2 Calculation: The final smoothed values (WT1) and their average (WT2) are derived.
9. Color Application Based on Trend
Once the trend is calculated, the script applies the appropriate color to the candles based on the selected color scheme. This function ensures that the visual representation of the trend is consistent with the user’s preferences.
10. Label Plotting for Timeframes
If the option to display timeframe labels is enabled, the script plots labels on the chart to indicate the current timeframe. This feature helps users quickly identify which timeframe they are analyzing.
11. Shape Plotting Based on Trend and Color Scheme
The indicator plots shapes (squares) on the chart based on the calculated trend and selected color scheme. These shapes provide an additional visual cue for market conditions, enhancing the overall clarity of the indicator.
12. Neutral Candle Color Option
The script includes an option to set the color of neutral candles when market conditions are neither strongly bullish nor bearish. This option helps traders better visualize periods of market indecision.
Summary
The "Regime Filter II " is a powerful and customizable tool for traders, offering clear visual cues for market trends and adaptability to various timeframes. By smoothing price data and applying intuitive color schemes, it helps traders make more informed decisions. With features like adjustable smoothing lengths, multiple color schemes, and optional neutral candle displays, this indicator enhances market analysis and trading strategy development. By following this comprehensive guide, traders can effectively utilize the "Regime Filter II " indicator to enhance their market analysis and make more informed trading decisions.
Best regards

RV - Relative Strength Index Buy/SellIntroduction
The RV - RSI B/S V1.2 indicator leverages the RSI to identify overbought and oversold conditions in the market. The RSI line color changes according to bullish, bearish, oversold, and overbought zones, helping users identify direction and avoid false trades. By plotting the RSI along with user-defined moving averages and Bollinger Bands, it offers a multi-faceted approach to analyzing market momentum.
Indicator Overview
The indicator RSI line color changes as per the bullish, bearish, oversold, and overbought zones. This helps users find out the direction and the zones. The oversold and overbought zones are colored to help users avoid false trades.
Trading Strategy
Long Trades (Bullish Setup):
Entry: A long trade is initiated when the RSI crosses from 60 up to 80.
Exit: Long trades are generally exited when the RSI is between 80 and 90.
Condition: No long trades are taken if the RSI exceeds 80.
Short Trades (Bearish Setup):
Entry: A short trade is initiated when the RSI crosses from 40 down to 20.
Exit: Short trades are generally exited when the RSI is between 20 and 10.
Condition: No short trades are taken if the RSI falls below 20.
RSI Color Coding and Interpretation
The RV - RSI B/S V1.2 indicator uses color coding to provide a visual representation of RSI values, making it easier to identify critical levels at a glance:
Green (RSI 60-80): Indicates a bullish zone where long trades can be considered.
Red (RSI > 80): Signals an overbought condition where long trades should be avoided.
Orange (RSI 20-40): Indicates a bearish zone where short trades can be considered.
Pink (RSI < 20): Signals an oversold condition where short trades should be avoided.
RSI Settings and Their Importance
RSI Length: The default length is set to 12, which is the standard period for RSI calculation. This setting can be adjusted to increase or decrease sensitivity.
Source: The source of the data for the RSI calculation is typically the closing price.
MA Type: Various moving averages can be applied to the RSI, including SMA, EMA, SMMA (RMA), WMA, and VWMA. Each type offers different smoothing properties and can be selected based on
trading preferences.
MA Length: The default length is set to 20, aligning with the RSI length for consistency.
Bollinger Bands: When using Bollinger Bands, the standard deviation multiplier is set to 2.0 by default, but it can be adjusted to suit different volatility conditions.
Disclaimer
This indicator provides valuable signals for potential trading opportunities based on RSI levels and moving averages. However, it is crucial to incorporate directional price action analysis to confirm signals and improve trading accuracy. The RV - RSI B/S V1.2 should be used as part of a broader trading strategy, considering other technical and fundamental factors.

PFCF Price BandPFCF Price Band shows price calculated using the previous period's high and low P/TTM FCFPS (TTM's price to free cash flow per share over the last 12 months) multiplied by TTM's current FCFPS ( Similar to price theory = P/E x expected earnings per share)
If the current P/FCFPS is lower than the minimum P/FCFPS, it is considered cheap. In other words, above the maximum P/FCFPS is considered expensive.
PFCF Price Band consists of 2 parts.
- Firstly, the historical P/FCFPS value in "Green" (if TTM FCFPS is positive) or "Red" (if TTM FCFPS is negative) status changes based on the latest high or low price of TTM FCFPS.
- Second, the blue line is the closing price divided by TTM FCFPS, which shows the current P/FCF.
P.S. It is recommended to use it together with the PE Band indicator because just net profit does not mean that a company has good cash flow.

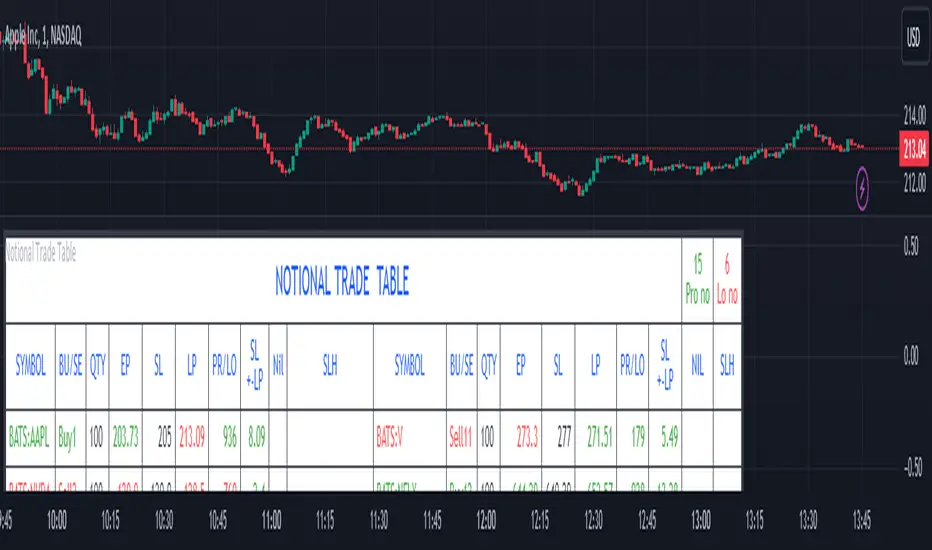
Notional Trade Table
Notional Trade Table indicator displays notional trade values for given Buy and Sell of given input of Symbol, Quantity, Entry Price and Stop Loss .
Sections of Input Menu Table are supported with Tool Tip icons.
Input Symbols:
(Refer Input Menu)
User can choose maximum 20 Symbols.
Input Side Choice (BUY/SELL):
(Refer Input Menu)
After choosing Symbol, User has to choose the BUY or SELL option for each Symbol against the corresponding Sybol number. If NIL is selected “Nil is selected ” message is displayed prompting the user to select BUY or SELL sides.
For example in the above Input Menu:
Sym1 is BATS:AAPL. Corresponding Side 1 is Sell1.
Sym2 is BATS:NVDA Corresponding Side 2 Sell 2.
Sym12 is BATS:NFLX. Corresponding Side 12 is Buy12 and so on.
Input Quantity:
(Refer Input Menu)
Next enter Corresponding Quantity of BUY or SELL in relevant Quantity Input Box. Quantity cannot be Zero. Defval is 1.
For Sym1 input in Qty 1 box,for Sym2 input in Qty 2 box and so on.
Input Entry Price:
(Refer Input Menu)
After entering Quantity Input Entry Price for Corresponding Symbol.
Input for Sym1 Entry Price in EP1 box
Input for Sym2 Entry Price in EP2 box
and so on.
Input Stop Loss:
(Refer Input Menu)
Next Enter corresponding Stop Loss for each Symbol.
SL1 input box denotes Sym1 Stop Loss.
SL2 input box denotes Sym2 Stop Loss.
SL3 input box denotes Sym3 Stop Loss and so on.
Stop Loss for Chosen BUY side should be below corresponding Entry Price/Last Price. Otherwise a message is displayed “SL Hit”. User has to enter valid data.
Stop Loss for Chosen SELL side should be above corresponding Entry Price/Last Price. Otherwise a message is displayed “SL Hit”. User has to enter valid data.
Notional Trade Table:
(Refer the Table on Chart)
From the input menu filled by User script captures the Symbol, BUY/SELL options, Quantity,
Entry Price and Stop Loss details under the corresponding heads in the Notional Trade Table.
The script captures the live Last traded Price under the head LP and calculates and displays corresponding Profit or Loss under PR/LO column in the table.
SL+- LP is the difference between Last traded Price (LP) and Stop Loss Price. Positive figure under this head reflects Stop Loss cushion available .
Nil header column reflects message “NIL selected” prompting the User to select BUY or SELL sides.
SLH header displays “SL Hit” on Stop Loss Hit or wrong input of Stop Loss inconsistent with BUY or SELL sides of Trade. On “SL Hit” message all values in corresponding Symbol becomes Zero. User has to re-enter the details fresh .
On the top left side corner of the table there are 2 cells with Prono and Lono.They denote the number of trades which are in Profit (Prono) and which are in Loss(Lono).
It is preferable to choose Symbols from a single country exchange commensurate with the Time zone. Otherwise if Exchange and Chart time Zone differs there is risk of data loss in the table.
DISCLAIMER: For educational and entertainment purpose only .Nothing in this content should be interpreted as financial advice or a recommendation to buy or sell any sort of security/ies or investment/s.
Dickey-Fuller Test for Mean Reversion and Stationarity **IF YOU NEED EXTRA SPECIAL HELP UNDERSTANDING THIS INDICATOR, GO TO THE BOTTOM OF THE DESCRIPTION FOR AN EVEN SIMPLER DESCRIPTION**
Dickey Fuller Test:
The Dickey-Fuller test is a statistical test used to determine whether a time series is stationary or has a unit root (a characteristic of a time series that makes it non-stationary), indicating that it is non-stationary. Stationarity means that the statistical properties of a time series, such as mean and variance, are constant over time. The test checks to see if the time series is mean-reverting or not. Many traders falsely assume that raw stock prices are mean-reverting when they are not, as evidenced by many different types of statistical models that show how stock prices are almost always positively autocorrelated or statistical tests like this one, which show that stock prices are not stationary.
Note: This indicator uses past results, and the results will always be changing as new data comes in. Just because it's stationary during a rare occurrence doesn't mean it will always be stationary. Especially in price, where this would be a rare occurrence on this test. (The Test Statistic is below the critical value.)
The indicator also shows the option to either choose Raw Price, Simple Returns, or Log Returns for the test.
Raw Prices:
Stock prices are usually non-stationary because they follow some type of random walk, exhibiting positive autocorrelation and trends in the long term.
The Dickey-Fuller test on raw prices will indicate non-stationary most of the time since prices are expected to have a unit root. (If the test statistic is higher than the critical value, it suggests the presence of a unit root, confirming non-stationarity.)
Simple Returns and Log Returns:
Simple and log returns are more stationary than prices, if not completely stationary, because they measure relative changes rather than absolute levels.
This test on simple and log returns may indicate stationary behavior, especially over longer periods. (The test statistic being below the critical value suggests the absence of a unit root, indicating stationarity.)
Null Hypothesis (H0): The time series has a unit root (it is non-stationary).
Alternative Hypothesis (H1): The time series does not have a unit root (it is stationary)
Interpretation: If the test statistic is less than the critical value, we reject the null hypothesis and conclude that the time series is stationary.
Types of Dickey-Fuller Tests:
1. (What this indicator uses) Standard Dickey-Fuller Test:
Tests the null hypothesis that a unit root is present in a simple autoregressive model.
This test is used for simple cases where we just want to check if the series has a consistent statistical property over time without considering any trends or additional complexities.
It examines the relationship between the current value of the series and its previous value to see if the series tends to drift over time or revert to the mean.
2. Augmented Dickey-Fuller (ADF) Test:
Tests for a unit root while accounting for more complex structures like trends and higher-order correlations in the data.
This test is more robust and is used when the time series has trends or other patterns that need to be considered.
It extends the regular test by including additional terms to account for the complexities, and this test may be more reliable than the regular Dickey-Fuller Test.
For things like stock prices, the ADF would be more appropriate because stock prices are almost always trending and positively autocorrelated, while the Dickey-Fuller Test is more appropriate for more simple time series.
Critical Values
This indicator uses the following critical values that are essential for interpreting the Dickey-Fuller test results. The critical values depend on the chosen significance levels:
1% Significance Level: Critical value of -3.43.
5% Significance Level: Critical value of -2.86.
10% Significance Level: Critical value of -2.57.
These critical values are thresholds that help determine whether to reject the null hypothesis of a unit root (non-stationarity). If the test statistic is less than (or more negative than) the critical value, it indicates that the time series is stationary. Conversely, if the test statistic is greater than the critical value, the series is considered non-stationary.
This indicator uses a dotted blue line by default to show the critical value. If the test-static, which is the gray column, goes below the critical value, then the test-static will become yellow, and the test will indicate that the time series is stationary or mean reverting for the current period of time.
What does this mean?
This is the weekly chart of BTCUSD with the Dickey-Fuller Test, with a length of 100 and a critical value of 1%.
So basically, in the long term, mean-reversion strategies that involve raw prices are not a good idea. You don't really need a statistical test either for this; just from seeing the chart itself, you can see that prices in the long term are trending and no mean reversion is present.
For the people who can't understand that the gray column being above the blue dotted line means price doesn't mean revert, here is a more simple description (you know you are):
Average (I have to include the meaning because they may not know what average is): The middle number is when you add up all the numbers and then divide by how many numbers there are. EX: If you have the numbers 2, 4, and 6, you add them up to get 12, and then divide by 3 (because there are 3 numbers), so the average is 4. It tells you what a typical number is in a group of numbers.
This indicator checks if a time series (like stock prices) tends to return to its average value or time.
Raw prices, which is just the regular price chart, are usually not mean-reverting (It's "always" positively autocorrelating but this group of people doesn't like that word). Price follows trends.
Simple returns and log returns are more likely to have periods of mean reversion.
How to use it:
Gray Column (the gray bars) Above the Blue Dotted Line: The price does not mean revert (non-stationary).
Gray Column Below Blue Line: The time series mean reverts (stationary)
So, if the test statistic (gray column) is below the critical value, which is the blue dotted line, then the series is stationary and mean reverting, but if it is above the blue dotted line, then the time series is not stationary or mean reverting, and strategies involving mean reversion will most likely result in a loss given enough occurrences.

CARNAC Trading Support and Resistance LevelsOverview
The "Carnac Trading Support and Resistance Levels" indicator is a powerful tool designed to help traders identify key support and resistance levels across multiple timeframes. This tool enhances trading strategies by visually marking significant price levels and providing configurable stop-loss and alert features.
Features
Support and Resistance Levels: Automatically calculates and plots support and resistance levels for the following timeframes:
5 minutes (5M)
10 minutes (10M)
15 minutes (15M)
30 minutes (30M)
1 hour (1H)
2 hours (2H)
4 hours (4H)
6 hours (6H)
12 hours (12H)
1 day (1D)
1 week (1W)
1 month (1M)
Configurable Stop-Loss (SL) Levels: Adds a stop-loss line below each support level and above each resistance level with customizable padding (as a percentage).
Visual Labels: Clearly labels support, resistance, and stop-loss levels with the corresponding prices and timeframes for easy identification.
Line Customization:
Support Levels: Green lines with varying thickness based on the timeframe.
Resistance Levels: Red lines with varying thickness based on the timeframe.
Stop-Loss Levels: Gray dotted lines for clear distinction.
Alerts: Alerts trigger when the price gets to a configurable percentage from the support or resistance levels, helping you stay informed about potential buying and selling opportunities.
Visibility Toggling: Easily toggle the visibility of support and resistance levels for each timeframe (default enabled for 2H, 4H, and 1D).
How to Use
Add the Indicator:
Navigate to the TradingView Pine Editor.
Paste the provided Pine Script code and click "Add to Chart."
Configure Inputs:
Lookback Periods: Adjust the lookback periods for each timeframe to suit your analysis needs.
Padding Percentage: Set the padding percentage for the stop-loss levels to define the distance below the support levels and above the resistance levels.
Visibility: Toggle the visibility of the support and resistance levels for each timeframe as needed (default enabled for 2H, 4H, and 1D).
Alert Trigger Distance: Set the alert trigger distance as a percentage to determine when the alerts should be triggered.
Interpret the Plotted Levels:
Green Lines: Indicate support levels for the respective timeframes.
Red Lines: Indicate resistance levels for the respective timeframes.
Gray Dotted Lines: Represent the stop-loss levels below each support level and above each resistance level, with the specified padding.
Labels: Provide clear indications of the price levels and their respective timeframes in white text for visibility.
Identifying Buying and Selling Opportunities:
Buying Opportunities:
Look for the price to approach or bounce off a support level (green line).
Confirm the potential for a reversal by checking if the price is nearing a key support level from multiple timeframes.
Use the stop-loss level (gray dotted line) to set your stop-loss order below the support level to minimize risk.
Selling Opportunities:
Look for the price to approach or get rejected at a resistance level (red line).
Confirm the potential for a reversal by checking if the price is nearing a key resistance level from multiple timeframes.
Use the stop-loss level (gray dotted line) to set your stop-loss order above the resistance level to minimize risk.
Alerts:
Alerts will notify you when the price gets within the specified percentage distance from each support or resistance level.
Use these alerts to stay informed about potential buying and selling opportunities.

BBTrend w SuperTrend decision - Strategy [presentTrading]This strategy aims to improve upon the performance of Traidngview's newly published "BB Trend" indicator by incorporating the SuperTrend for better trade execution and risk management. Enjoy :)
█Introduction and How it is Different
The "BBTrend w SuperTrend decision - Strategy " is a trading strategy designed to identify market trends using Bollinger Bands and SuperTrend indicators. What sets this strategy apart is its use of two Bollinger Bands with different lengths to capture both short-term and long-term market trends, providing a more comprehensive view of market dynamics. Additionally, the strategy includes customizable take profit (TP) and stop loss (SL) settings, allowing traders to tailor their risk management according to their preferences.
BTCUSD 4h Long Performance
█ Strategy, How It Works: Detailed Explanation
The BBTrend strategy employs two key indicators: Bollinger Bands and SuperTrend.
🔶 Bollinger Bands Calculation:
- Short Bollinger Bands**: Calculated using a shorter period (default 20).
- Long Bollinger Bands**: Calculated using a longer period (default 50).
- Bollinger Bands use the standard deviation of price data to create upper and lower bands around a moving average.
Upper Band = Middle Band + (k * Standard Deviation)
Lower Band = Middle Band - (k * Standard Deviation)
🔶 BBTrend Indicator:
- The BBTrend indicator is derived from the absolute differences between the short and long Bollinger Bands' lower and upper values.
BBTrend = (|Short Lower - Long Lower| - |Short Upper - Long Upper|) / Short Middle * 100
🔶 SuperTrend Indicator:
- The SuperTrend indicator is calculated using the average true range (ATR) and a multiplier. It helps identify the market trend direction by plotting levels above and below the price, which act as dynamic support and resistance levels. * @EliCobra makes the SuperTrend Toolkit. He is GOAT.
SuperTrend Upper = HL2 + (Factor * ATR)
SuperTrend Lower = HL2 - (Factor * ATR)
The strategy determines market trends by checking if the close price is above or below the SuperTrend values:
- Uptrend: Close price is above the SuperTrend lower band.
- Downtrend: Close price is below the SuperTrend upper band.
Short: 10 Long: 20 std 2
Short: 20 Long: 40 std 2
Short: 20 Long: 40 std 4
█ Trade Direction
The strategy allows traders to choose their trading direction:
- Long: Enter long positions only.
- Short: Enter short positions only.
- Both: Enter both long and short positions based on market conditions.
█ Usage
To use the "BBTrend - Strategy " effectively:
1. Configure Inputs: Adjust the Bollinger Bands lengths, standard deviation multiplier, and SuperTrend settings.
2. Set TPSL Conditions: Choose the take profit and stop loss percentages to manage risk.
3. Choose Trade Direction: Decide whether to trade long, short, or both directions.
4. Apply Strategy: Apply the strategy to your chart and monitor the signals for potential trades.
█ Default Settings
The default settings are designed to provide a balance between sensitivity and stability:
- Short BB Length (20): Captures short-term market trends.
- Long BB Length (50): Captures long-term market trends.
- StdDev (2.0): Determines the width of the Bollinger Bands.
- SuperTrend Length (10): Period for calculating the ATR.
- SuperTrend Factor (12): Multiplier for the ATR to adjust the SuperTrend sensitivity.
- Take Profit (30%): Sets the level at which profits are taken.
- Stop Loss (20%): Sets the level at which losses are cut to manage risk.
Effect on Performance
- Short BB Length: A shorter length makes the strategy more responsive to recent price changes but can generate more false signals.
- Long BB Length: A longer length provides smoother trend signals but may be slower to react to price changes.
- StdDev: Higher values create wider bands, reducing the frequency of signals but increasing their reliability.
- SuperTrend Length and Factor: Shorter lengths and higher factors make the SuperTrend more sensitive, providing quicker signals but potentially more noise.
- Take Profit and Stop Loss: Adjusting these levels affects the risk-reward ratio. Higher take profit percentages can increase gains but may result in fewer closed trades, while higher stop loss percentages can decrease the likelihood of being stopped out but increase potential losses.

Leading MACDThe Moving Average Convergence Divergence (MACD) indicator is one of the most popular and versatile tools used by traders to identify potential buy and sell signals. It helps traders determine the strength and direction of a trend by comparing different moving averages of a security's price. The traditional MACD uses two exponential moving averages (EMAs), a fast EMA (typically 12 periods) and a slow EMA (typically 26 periods), along with a signal line (typically a 9-period EMA of the MACD line) to generate trading signals.
Our "Custom MACD with Leading Length" script for TradingView enhances the traditional MACD by introducing an additional smoothing factor called the "leading length." This customization aims to reduce noise and provide a potentially earlier indication of trend changes, making it a valuable tool for traders seeking to optimize their trading strategies.
- **Purpose:** This additional smoothing factor is designed to reduce noise and provide a potentially leading signal, enhancing the accuracy of trend identification.
## How It Works
1. **Calculate the MACD Line:**
The MACD line is calculated by subtracting the slow EMA from the fast EMA. This difference represents the convergence or divergence between the two EMAs.
2. **Calculate the Signal Line:**
The signal line is an EMA of the MACD line. This additional smoothing helps to generate clearer buy and sell signals based on crossovers with the MACD line.
3. **Calculate the Histogram:**
The histogram represents the difference between the MACD line and the signal line. It visually indicates the strength and direction of the trend. A positive histogram suggests a bullish trend, while a negative histogram indicates a bearish trend.
4. **Apply Leading Length Smoothing:**
To incorporate the leading length, the script applies a simple moving average (SMA) to both the MACD and signal lines using the leading length parameter. This additional smoothing helps to further reduce noise and potentially provides earlier signals of trend changes.
## Benefits of the Leading MACD
### Reduced Noise
The leading length parameter adds an extra layer of smoothing to the MACD and signal lines, helping to filter out market noise. This can be particularly beneficial in volatile markets, where frequent price fluctuations can generate false signals.
### Potential Early Signals
By smoothing the MACD and signal lines, the leading length can help to provide earlier indications of trend changes. This can give traders a potential edge in entering or exiting trades before the broader market reacts.
### Enhanced Trend Identification
The combination of the traditional MACD with the leading length smoothing can enhance the accuracy of trend identification. Traders can use this tool to confirm the strength and direction of trends, making it easier to make informed trading decisions.
### Versatility
The Custom MACD with Leading Length can be applied to various timeframes and asset classes, including stocks, forex, commodities, and cryptocurrencies. Its adaptability makes it a valuable tool for traders with different strategies and preferences.
## Practical Applications
### Buy Signal
A typical buy signal occurs when the MACD line crosses above the signal line. With the additional smoothing provided by the leading length, traders might receive this signal slightly earlier, allowing them to enter a long position sooner. This can be particularly advantageous in capturing the beginning of a bullish trend.
### Sell Signal
Conversely, a sell signal is generated when the MACD line crosses below the signal line. The leading length smoothing can help to provide this signal earlier, enabling traders to exit a long position or enter a short position before the trend reversal is fully recognized by the market.
### Divergence Analysis
Traders can also use the Custom MACD with Leading Length for divergence analysis. Bullish divergence occurs when the price makes a new low, but the MACD line forms a higher low. This suggests that the downward momentum is weakening, potentially leading to a bullish reversal. Bearish divergence is the opposite, where the price makes a new high, but the MACD line forms a lower high, indicating a potential bearish reversal.
### Confirmation Tool
The Custom MACD with Leading Length can be used in conjunction with other technical indicators to confirm trading signals. For example, traders might use it alongside support and resistance levels, trendlines, or other momentum indicators to validate their trade entries and exits.
## Conclusion
The Custom MACD with Leading Length is a powerful enhancement of the traditional MACD indicator. By introducing an additional smoothing factor, it aims to reduce noise and provide earlier signals of trend changes. This makes it a valuable tool for traders seeking to improve their market analysis and trading strategies.
Whether you are a day trader, swing trader, or long-term investor, the Custom MACD with Leading Length can help you make more informed decisions by offering clearer insights into market trends. Its adaptability to different timeframes and asset classes further enhances its utility, making it a versatile addition to any trader's toolkit.
Experiment with the parameters to find the optimal settings that suit your trading style and preferences. Use the Custom MACD with Leading Length to gain a deeper understanding of market dynamics and enhance your trading performance.
Stoch Double Analysis MTFThis indicator utilizes the Stochastic Oscillator on two different timeframes and generates alerts for potential long and short conditions based on the crossovers of the %K and %D lines of the Stochastic Oscillator. Here's a detailed breakdown of the code:
Inputs
Overbought and Oversold Levels:
ob_stc: Overbought level (default 80).
os_stc: Oversold level (default 20).
Timeframe 1 Configuration:
tf_stoch_1: The first timeframe for analysis.
length: Stochastic length (default 8).
smoothK: Smoothing for %K line (default 5).
smoothD: Smoothing for %D line (default 3).
Timeframe 2 Configuration:
tf_stoch_2: The second timeframe for analysis.
length_another: Stochastic length for the second timeframe (default 12).
smoothK_another: Smoothing for %K line for the second timeframe (default 7).
smoothD_another: Smoothing for %D line for the second timeframe (default 3).
Calculations
Volume Trend Calculation:
For both timeframes, the script calculates the volume trend. It determines up days and down days based on whether the closing price is higher or lower than the opening price and accumulates the volume accordingly.
Cumulative Volume:
Calculates the cumulative volume for up days and down days using the average of the high prices and the respective volumes.
Stochastic Oscillator Calculation:
Computes the %K and %D lines of the Stochastic Oscillator for both timeframes using the given lengths and smoothing factors.
Alerts
The script generates alerts for potential long and short conditions based on the crossovers of the %K and %D lines for both timeframes:
Long Condition: When %K crosses above %D.
Short Condition: When %D crosses above %K.
Plotting
Stochastic Lines:
Plots the %K and %D lines for both timeframes with different colors (orange and blue for the first timeframe, green and red for the second timeframe).
Overbought/Oversold Bands:
Adds horizontal lines at the overbought and oversold levels and a middle band at 50.
Fills the background between the overbought and oversold levels with a semi-transparent color.
Code Structure
Inputs Definition:
Defines all input variables for customization.
Volume Trend and Cumulative Volume Calculation:
Computes volume trends and cumulative volumes for both timeframes.
Stochastic Oscillator Calculation:
Calculates the %K and %D lines using the request.security function to get data from the specified timeframes and apply the smoothing functions.
Alert Conditions:
Checks for crossovers between the %K and %D lines to generate alerts for potential trading signals.
Plotting:
Plots the %K and %D lines for both timeframes and adds visual elements for overbought and oversold levels.
This indicator helps traders analyze market trends using the Stochastic Oscillator on multiple timeframes, providing potential buy and sell signals based on the interaction of the %K and %D lines.
The alerts generated by the "Stoch Double Analysis MTF" indicator can be viewed as part of a broader educational and training path for traders!
Market Cipher B by WeloTradesMarket Cipher B by WeloTrades: Detailed Script Description
//Overview//
"Market Cipher B by WeloTrades" is an advanced trading tool that combines multiple technical indicators to provide a comprehensive market analysis framework. By integrating WaveTrend, RSI, and MoneyFlow indicators, this script helps traders to better identify market trends, potential reversals, and trading opportunities. The script is designed to offer a holistic view of the market by combining the strengths of these individual indicators.
//Key Features and Originality//
WaveTrend Analysis:
WaveTrend Channel (WT1 and WT2): The core of this script is the WaveTrend indicator, which uses the smoothed average of typical price to identify overbought and oversold conditions. WT1 and WT2 are calculated to track market momentum and cyclical price movements.
Major Divergences (🐮/🐻): The script detects and highlights major bullish and bearish divergences automatically, providing traders with visual cues for potential reversals. This helps in making informed decisions based on divergence patterns.
Relative Strength Index (RSI):
RSI Levels: RSI is used to measure the speed and change of price movements, with specific levels indicating overbought and oversold conditions.
Customizable Levels: Users can configure the overbought and oversold thresholds, allowing for a tailored analysis based on individual trading strategies.
MoneyFlow Indicator:
Fast and Slow MoneyFlow: This indicator tracks the flow of capital into and out of the market, offering insights into the underlying market strength. It includes configurable periods and multipliers for both fast and slow MoneyFlow.
Vertical Positioning: The script allows users to adjust the vertical position of MoneyFlow plots to maintain a clear and uncluttered chart.
Stochastic RSI:
Stochastic RSI Levels: This combines the RSI and Stochastic indicators to provide a momentum oscillator that is sensitive to price changes. It is used to identify overbought and oversold conditions within a specified period.
Customizable Levels: Traders can set specific levels for more precise analysis.
//How It Works//
The script integrates these indicators through advanced algorithms, creating a synergistic effect that enhances market analysis. Here’s a detailed explanation of the underlying concepts and calculations:
WaveTrend Indicator:
Calculation: WaveTrend is based on the typical price (average of high, low, and close) smoothed over a specified channel length. WT1 and WT2 are derived from this typical price and further smoothed using the Average Channel Length. The difference between WT1 and WT2 indicates momentum, helping to identify cyclical market trends.
RSI (Relative Strength Index):
Calculation: RSI calculates the average gains and losses over a specified period to measure the speed and change of price movements. It oscillates between 0 and 100, with levels set to identify overbought (>70) and oversold (<30) conditions.
MoneyFlow Indicator:
Calculation: MoneyFlow is derived by multiplying price changes by volume and smoothing the results over specified periods. Fast MoneyFlow reacts quickly to price changes, while Slow MoneyFlow offers a broader view of capital movement trends.
Stochastic RSI:
Calculation: Stochastic RSI is computed by applying the Stochastic formula to RSI values, which highlights the RSI’s relative position within its range over a given period. This helps in identifying momentum shifts more precisely.
//How to Use the Script//
Display Settings:
Users can enable or disable various components like WaveTrend OB & OS levels, MoneyFlow plots, and divergence alerts through checkboxes.
Example: Turn on "Show Major Divergence" to see major bullish and bearish divergence signals directly on the chart.
Adjust Channel Settings:
Customize the data source, channel length, and smoothing periods in the "WaveTrend Channel SETTINGS" group.
Example: Set the "Channel Length" to 10 for a more responsive WaveTrend line or adjust the "Average Channel Length" to 21 for smoother trends.
Set Overbought & Oversold Levels:
Configure levels for WaveTrend, RSI, and Stochastic RSI in their respective settings groups.
Example: Set the WaveTrend Overbought Level to 60 and Oversold Level to -60 to define critical thresholds.
Money Flow Settings:
Adjust the periods and multipliers for Fast and Slow MoneyFlow indicators, and set their vertical positions for better visualization.
Example: Set the Fast Money Flow Period to 9 and Slow Money Flow Period to 12 to capture both short-term and long-term capital movements.
//Justification for Combining Indicators//
Enhanced Market Analysis:
Combining WaveTrend, RSI, and MoneyFlow provides a more comprehensive view of market conditions. Each indicator brings a unique perspective, making the analysis more robust.
WaveTrend identifies cyclical trends, RSI measures momentum, and MoneyFlow tracks capital movement. Together, they provide a multi-dimensional analysis of the market.
Improved Decision-Making:
By integrating these indicators, the script helps traders make more informed decisions. For example, a bullish divergence detected by WaveTrend might be validated by an RSI moving out of oversold territory and supported by increasing MoneyFlow.
Customization and Flexibility:
The script offers extensive customization options, allowing traders to tailor it to their specific needs and strategies. This flexibility makes it suitable for different trading styles and timeframes.
//Conclusion//
The indicator stands out due to its innovative combination of WaveTrend, RSI, and MoneyFlow indicators, offering a well-rounded tool for market analysis. By understanding how each component works and how they complement each other, traders can leverage this script to enhance their market analysis and trading strategies, making more informed and confident decisions.
Remember to always backtest the indicator first before implying it to your strategy.

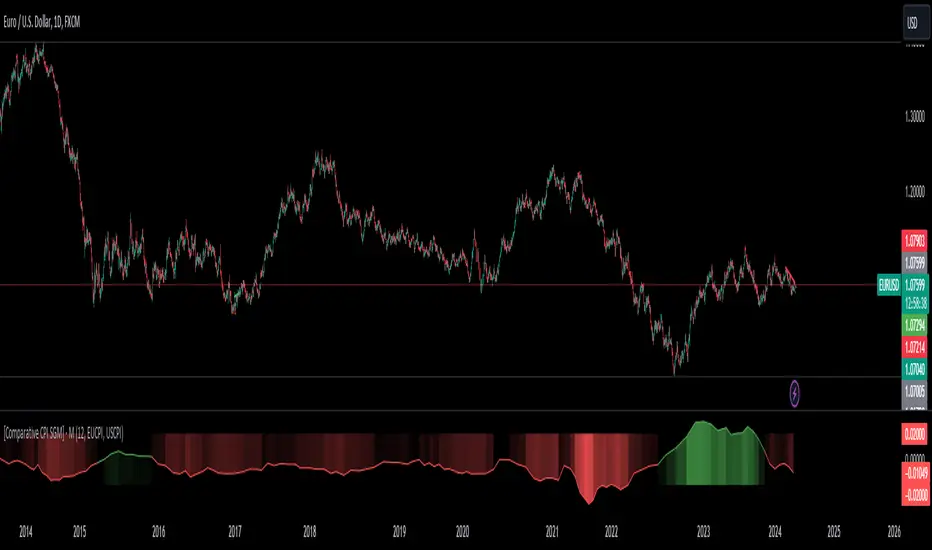
[Comparative CPI SGM]Code Explanation
User Inputs:
len: Defines the period over which CPI changes are calculated, with selectable options of 12, 6, and 3 months.
CP1 and CP2: These are the economic zones whose CPI data are being compared. The options include CPI from various regions like the EU, USA, UK, etc.
Calculating and Comparing Changes:
Calculates the annual change for each CPI and then computes the difference between these two changes.
Trading Utility
In trading, CPI variations are key indicators of inflation within different economic regions. Monetary policy decisions by central banks, heavily influenced by these data, significantly impact financial markets, especially in forex and bond markets.
Monetary Policy Forecasting:
If inflation in one region is significantly higher than in another, the central bank might raise interest rates, potentially strengthening that region's currency.
Currency Trading Strategy:
Traders might use this indicator to speculate on currency pair movements. For example, if US CPI is rising faster than the EU CPI, this might suggest a potential appreciation of the USD against the EUR.
Macroeconomic Analysis:
Understanding where inflation pressures are strongest can guide longer-term investment decisions, such as choosing between emerging and developed markets.