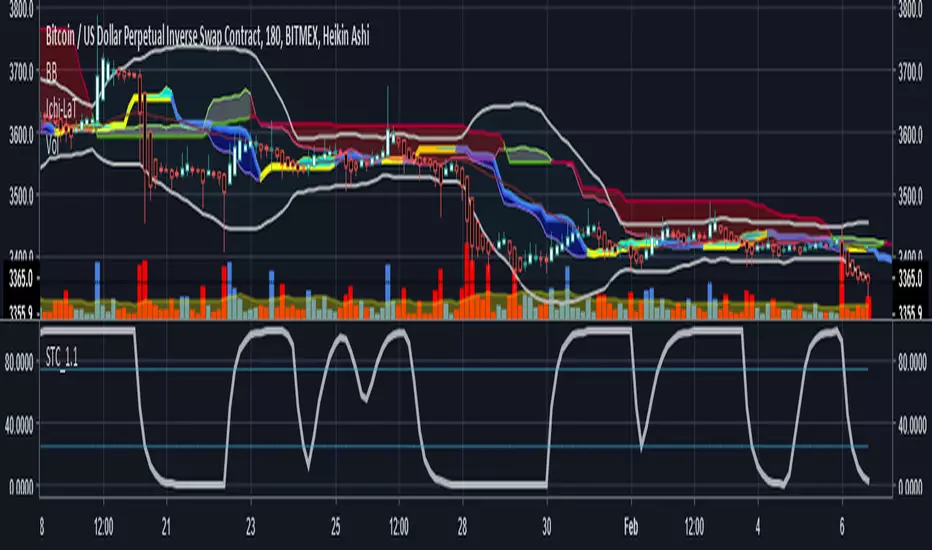
Schaff Trend Cycle 1.1 with signal codingThis is an edit of Lazy Bear's Schaff Trend Cycle original description here. I've added in the syntax so that you can generate an alert when it crosses the threshold in either direction. Just tick the box to show threshold crosses.
More background on the indicator is here.
www.investopedia.com
Other common settings are fast 23 slow 53 or 10/30, 3/10. I have also set it to 9/20 for test purposes. They have different pluses and minuses on different timeframes.
In den Scripts nach "美元未来10天走势预测" suchen
Double EMA & ALMA StrategyThe ALMA (50 period) acts as the main trend filter, meaning that long positions are taken above the ALMA and short positions are taken below the ALMA. For instance, the 5 and 10 period exponential moving averages are added on the chart to give early signals to the trend.
Therefore, when the 5/10 EMA triggers a bullish crossover, long signals are taken when price is above the ALMA, likewise, when the 5/10 EMA triggers a bearish crossover, short signals are taken when price is below the ALMA.
Find out optimal values by trying. May not produce accurate results in horizontal markets. Thank you.

Inverted Yield Curve with VIX Fear IndexUS 2 year and US 10 year comparison, inverted yield curve with VIX. I use this on a weekly chart with 2 moving averages, the 40 week (ma200 daily) and the 520 week (10 year median).
The bottom histogram is the VIX and the plot is the yield curve. When the VIX is above a certain level (you can set it in settings) and the ýield curve is close to or at inversion the background goes red.
The last seven recessions were preceded by an inverted yield curve. Here I combined the two main fear indexes, the VIX and the run for safe US treasuries (Inverted Yield Curve).
This is preset to the 2 year and 10 year US bond, weekly, and the normal VIX ticker but you can set it to whatever you like.
Published with source code for anyone to modify. Please comment below if you do so! This is the second in a series of indicators I intend to publish as a package of economic recoverty/recession symptom indicators.
Follow me for updates, next one up is commodities with dr Copper and oil!

Advanced Larry Williams 9.2- By EduHit rate greater than Setup 9.1
However, the stop of this setup becomes more expensive in certain situations.
PURCHASE SIGN
1 - Paper comes in a bullish trend in the operational term to be operated.
2 - Exponential moving average of 9 upward periods.
3 - Wait for a candle to make the largest closing (candle reference).
4 - If the next candle CLOSES below the minimum of the candle reference the setup is armed.
5 - Mark the candle maxim that closed below the reference. It's the trigger!
6 - If the next candle exceeds this maximum by 1 cent the trade is triggered. Put the stop loss at the low of the candle that closed below (0.01 to 0.10 below)
7 - If the next candle does not fire, let's lower the trigger to the lower maximums, SINCE the mm9exp does not turn down.
8 - It exceeded the maximum we will have the entrance.
9 - Original stop-loss in the minimum of the candle we set the maximum activated.
SIGN OF SALE
1 - Paper comes in a downtrend in the operating period to be operated.
2 - Exponential moving average of 9 periods descending.
3 - Wait for a candle that makes the lowest closing (candle reference).
4 - If the next candle CLOSE above the maximum of the reference candle the setup is armed.
5 - Bookmark the candle that closed above the reference. It's the trigger!
6 - If the next candle breaks this minimum, the trade is triggered.
7 - Place the stop-loss at the maximum of the candle that closed up.
8 - If the next candle does not trigger, we will raise the trigger to the highest minimums SINCE the exponential moving average of 9 periods does not turn upwards.
9 - It broke the minimum we will have the entrance.
10 - Stop-loss original in the maximum of the candle that we set the minimum activated.
*********************************************************************************************************************************************************
Índice de acerto Superior ao Setup 9.1
Porém o stop deste setup acaba se tornando mais caro em determinadas situações.
SINAL DE COMPRA
1 - Papel vem em tendência de alta no prazo operacional a ser operado.
2 - Média móvel exponencial de 9 períodos ascendente.
3 - Aguardar um candle que faça o maior fechamento (candle referência).
4 - Se o próximo candle FECHAR abaixo da mínima do candle referência o setup está armado.
5 - Marcar a máxima do candle que fechou abaixo do referência. É o gatilho!
6 - Se o próximo candle superar essa máxima em 1 centavo o trade é acionado. Colocar o stop-loss na mínima do candle que fechou abaixo (0,01 a 0,10 abaixo)
7 - Se o próximo candle não acionar, vamos abaixando o gatilho para as máximas menores DESDE QUE a mm9exp não vire para baixo.
8 - Superou a máxima teremos a entrada.
9 - Stop-loss original na mínima do candle que marcamos a máxima ativada.
SINAL DE VENDA
1 - Papel vem em tendência de baixa no prazo operacional a ser operado.
2 - Média móvel exponencial de 9 períodos descendente.
3 - Aguardar um candle que faça o menor fechamento (candle referência).
4 - Se o próximo candle FECHAR acima da máxima do candle referência o setup está armado.
5 - Marcar a mínima do candle que fechou acima do referência. É o gatilho!
6 - Se o próximo candle romper essa mínima o trade é acionado.
7 - Colocar o stop-loss na máxima do candle que fechou acima.
8 - Se o próximo candle não acionar, vamos levantando o gatilho para as mínimas maiores DESDE QUE a média móvel exponencial de 9 períodos não vire para cima.
9 - Rompeu a mínima teremos a entrada.
10 - Stop-loss original na máxima do candle que marcamos a mínima ativada.

Reset Every (Price)Someone requested a high/low price indicator that would reset the "remembered" prices daily. I started out doing just that, and then decided to make it much more configurable.
Choose the units (minutes, hours, days, weeks, months) and the number of those units, and this will reset the highest/lowest value remembered to the current values on your chosen time interval.
This should work with any time interval you desire, within reason...asking for resets every 4000 hours on a monthly chart will probably not work.
GE, monthly, every 7 months:
Ford, weekly, every 18 months:
Dow Jones Industrial Average, weekly, every 90 days:
LTCBTC, daily, every 10 days:
ETHUSD, 30 minutes, every 10 days:
BTCUSD, 1 minute, every 10 hours:
EURUSD, 1 minute, every 50 minutes:
Also, I am about to publish another version of this with just one source input that can be applied to any indicator...stay tuned!

XPloRR MA-Trailing-Stop StrategyXPloRR MA-Trailing-Stop Strategy
Long term MA-Trailing-Stop strategy with Adjustable Signal Strength to beat Buy&Hold strategy
None of the strategies that I tested can beat the long term Buy&Hold strategy. That's the reason why I wrote this strategy.
Purpose: beat Buy&Hold strategy with around 10 trades. 100% capitalize sold trade into new trade.
My buy strategy is triggered by the fast buy EMA (blue) crossing over the slow buy SMA curve (orange) and the fast buy EMA has a certain up strength.
My sell strategy is triggered by either one of these conditions:
the EMA(6) of the close value is crossing under the trailing stop value (green) or
the fast sell EMA (navy) is crossing under the slow sell SMA curve (red) and the fast sell EMA has a certain down strength.
The trailing stop value (green) is set to a multiple of the ATR(15) value.
ATR(15) is the SMA(15) value of the difference between the high and low values.
The scripts shows a lot of graphical information:
The close value is shown in light-green. When the close value is lower then the buy value, the close value is shown in light-red. This way it is possible to evaluate the virtual losses during the trade.
the trailing stop value is shown in dark-green. When the sell value is lower then the buy value, the last color of the trade will be red (best viewed when zoomed)(in the example, there are 2 trades that end in gain and 2 in loss (red line at end))
the EMA and SMA values for both buy and sell signals are shown as a line
the buy and sell(close) signals are labeled in blue
How to use this strategy?
Every stock has it's own "DNA", so first thing to do is tune the right parameters to get the best strategy values voor EMA , SMA, Strength for both buy and sell and the Trailing Stop (#ATR).
Look in the strategy tester overview to optimize the values Percent Profitable and Net Profit (using the strategy settings icon, you can increase/decrease the parameters)
Then keep using these parameters for future buy/sell signals only for that particular stock.
Do the same for other stocks.
Important : optimizing these parameters is no guarantee for future winning trades!
Here are the parameters:
Fast EMA Buy: buy trigger when Fast EMA Buy crosses over the Slow SMA Buy value (use values between 10-20)
Slow SMA Buy: buy trigger when Fast EMA Buy crosses over the Slow SMA Buy value (use values between 30-100)
Minimum Buy Strength: minimum upward trend value of the Fast SMA Buy value (directional coefficient)(use values between 0-120)
Fast EMA Sell: sell trigger when Fast EMA Sell crosses under the Slow SMA Sell value (use values between 10-20)
Slow SMA Sell: sell trigger when Fast EMA Sell crosses under the Slow SMA Sell value (use values between 30-100)
Minimum Sell Strength: minimum downward trend value of the Fast SMA Sell value (directional coefficient)(use values between 0-120)
Trailing Stop (#ATR): the trailing stop value as a multiple of the ATR(15) value (use values between 2-20)
Example parameters for different stocks (Start capital: 1000, Order=100% of equity, Period 1/1/2005 to now) compared to the Buy&Hold Strategy(=do nothing):
BEKB(Bekaert): EMA-Buy=12, SMA-Buy=44, Strength-Buy=65, EMA-Sell=12, SMA-Sell=55, Strength-Sell=120, Stop#ATR=20
NetProfit: 996%, #Trades: 6, %Profitable: 83%, Buy&HoldProfit: 78%
BAR(Barco): EMA-Buy=16, SMA-Buy=80, Strength-Buy=44, EMA-Sell=12, SMA-Sell=45, Strength-Sell=82, Stop#ATR=9
NetProfit: 385%, #Trades: 7, %Profitable: 71%, Buy&HoldProfit: 55%
AAPL(Apple): EMA-Buy=12, SMA-Buy=45, Strength-Buy=40, EMA-Sell=19, SMA-Sell=45, Strength-Sell=106, Stop#ATR=8
NetProfit: 6900%, #Trades: 7, %Profitable: 71%, Buy&HoldProfit: 2938%
TNET(Telenet): EMA-Buy=12, SMA-Buy=45, Strength-Buy=27, EMA-Sell=19, SMA-Sell=45, Strength-Sell=70, Stop#ATR=14
NetProfit: 129%, #Trade

Renko Price Bars Overlay// Shows the price renko bars (or range bars) instead of the PERIOD renko
// bars that are integrated into Trading View. The normal renko bars that
// Trading View offers only consider the drawing of a new brick when the
// price closes above or below the required brick size. This can produce
// misleading charts since depending on the time interval of a chart, new
// bricks may or may not be drawn. True price renko bars will draw a new
// brick immediately upon the price exceeding the next target brick size.
// When running this script in "Traditional" mode, the painting of the
// brick overlay band is INDEPENDENT of the chart interval. If price
// exceeds the required target price for the next brick, the band is
// updated immediately, instead of waiting for the price bar on the chart
// interval to close first. The brick starting anchor point will attempt
// to be a "nice number" at a round interval for the chart ticker. For
// example, if viewing EURUSD with the box size equal to 50 ticks/pips,
// the open and close prices will take the form of 1.2100, 1.2150, 1.2200,
// 1.2250, and so on. This is the same behavior as the normal traditional
// Renko bars in Trading View and other major trading platforms such as
// Meta Trader.
// Use the tick size in traditional mode to specify the block size, in
// ticks. This may give interesting results in FOREX pairs... as the tick
// size in Trading View may be 0.00001 instead of the normal pip size of
// 0.0001, so a 10 pip block size may be '100', and not the expected '10'.
// FOREX futures should work in the manner expected, a 10 pip block size
// will indeed equal 0.0010.
// The "ATR" mode functions differently than the Trading View built in
// version. The block size is updated each time the range is exceeded.
// In Trading View, when using the ATR mode, the ATR is the last ATR
// value calculated on the ENTIRE data interval, and is applied to all
// past data. You can see this when you press the '+' sign of the ticker
// in the top left of the chart window and you will see the brick size
// as a constant, the brick size is not a function of the ever changing
// ATR value of the price action. The block size of this script is not
// updated for each price candle (i.e. each 1HR on a 1HR chart), instead
// it is updated only when the price thresholds are exceeded requiring a
// the band to be updated. At that point the current ATR is considered
// and the brick size is updated.
// Options exist to show the current high and low of the brick, and to
// show the required levels that the price must exceed to draw a new
// brick and update the band.
Please leave comments if you notice any bugs or would like any new features added. I don't find much use for plotting the H/L of the current renko candle, but I have seen some request it in the past.
Cheers.

EMA Indicators with BUY sell SignalCombine 3 EMA indicators into 1. Buy and Sell signal is based on
- Buy signal based on 20 Days Highest High resistance
- Sell signal based on 10 Days Lowest Low support
Input :-
1 - Short EMA (20), Mid EMA (50) and Long EMA (200)
2 - Resistance (20) = 20 Days Highest High line
3 - Support (10) = 10 Days Lowest Low line

Volume Range EventsChanges in the feelings (positive, negative, neutral) in the market concerning the valuation of an instrument are often preceded with sudden outbursts of buying and selling frenzies. The aim of this indicator is to report such outbursts. We can see them as expansions of volume, sometimes 10 times more than usual. and as extensions of the trading range, also sometimes 10 times more than usual (e.g. usual range is 10 cent suddenly a whole dollar.) The changes are calculated in such a way that these fit between plus and minus 100 percent, the bars are scaled in some sort of logarithmic way. The Emoline is the same as the one in the True Balance of Power indicator, which I already published
ONLY RISES ARE EVENTS
Sometimes analysts are tempted to give meaning to low volume or small ranges. These simply mean that the market has little interest in trading this instrument. I believe that in such cases the trader needs to wait for expansion and extension events to happen, then he can make a better guess of where the market is heading. As events often mark the beginning or ending of a trend, this indicator provides an early and clear signal, because it doesn’t bother us about non-events.
WHAT IS USUAL?
If the algorithm would use an average as a normal to scale volume or range events, then previous peaks will act as spoilers by making the average so high that a following peak is scaled too small. I developed a function, usual() , that kicks out all extremes of a ‘population of values’ and which returns the average of the non-extreme values. It can be called with any serial. This function is called by both algorithms that report volume and range peaks, which guarantees that the results are really comparable. As this function has a fixed look back of 8 periods, we might state that ‘usual’ is a short lived relative value. I think this doesn’t matter for the practical use of the indicator.
COLORING AND INTERPRETATION
I follow the categories in the ‘Better Volume Indicator’, published by LeazyBear, these are:
1. Climactic Volumes, event >40 % (this means peak is 1.5 X usual)
LIME: Climax Buying Volume, direction up, range event also > 30 %
RED: Climax Selling Volume, direction down, range event also > 30 %
AQUA: Climax Churning Volume, both directions, range event < 30%
2. Smaller Volumes, event <40 %
GREEN: Supportive Volume, both directions, if combined with range event
BLUE: Churning Volume, both directions, if not combined with range event (Professional Trading)
3. Just Range Events
BLACK histogram bars (Amateurish Trading)

Forex Master v4.0 (EUR/USD Mean-Reversion Algorithm)DESCRIPTION
Forex Master v4.0 is a mean-reversion algorithm currently optimized for trading the EUR/USD pair on the 5M chart interval. All indicator inputs use the period's closing price and all trades are executed at the open of the period following the period where the trade signal was generated.
There are 3 main components that make up Forex Master v4.0:
I. Trend Filter
The algorithm uses a version of the ADX indicator as a trend filter to trade only in certain time periods where price is more likely to be range-bound (i.e., mean-reverting). This indicator is composed of a Fast ADX and a Slow ADX, both using the same look-back period of 50. However, the Fast ADX is smoothed with a 6-period EMA and the Slow ADX is smoothed with a 12-period EMA. When the Fast ADX is above the Slow ADX, the algorithm does not trade because this indicates that price is likelier to trend, which is bad for a mean-reversion system. Conversely, when the Fast ADX is below the Slow ADX, price is likelier to be ranging so this is the only time when the algorithm is allowed to trade.
II. Bollinger Bands
When allowed to trade by the Trend Filter, the algorithm uses the Bollinger Bands indicator to enter long and short positions. The Bolliger Bands indicator has a look-back period of 20 and a standard deviation of 1.5 for both upper and lower bands. When price crosses over the lower band, a Long Signal is generated and a long position is entered. When price crosses under the upper band, a Short Signal is generated and a short position is entered.
III. Money Management
Rule 1 - Each trade will use a limit order for a fixed quantity of 50,000 contracts (0.50 lot). The only exception is Rule
Rule 2 - Order pyramiding is enabled and up to 10 consecutive orders of the same signal can be executed (for example: 14 consecutive Long Signals are generated over 8 hours and the algorithm sends in 10 different buy orders at various prices for a total of 350,000 contracts).
Rule 3 - Every order will include a bracket with both TP and SL set at 50 pips (note: the algorithm only closes the current open position and does not enter the opposite trade once a TP or SL has been hit).
Rule 4 - When a new opposite trade signal is generated, the algorithm sends in a larger order to close the current open position as well as open a new one (for example: 14 consecutive Long Signals are generated over 8 hours and the algorithm sends in 10 different buy orders at various prices for a total of 350,000 contracts. A Short Signal is generated shortly after the 14th Long Signal. The algorithm then sends in a sell order for 400,000 contracts to close the 350,000 contracts long position and open a new short position of 50,000 contracts).

My5min1. Follow the instructions for entry and exit exactly as above. Don’t second guess, or assume/presume anything.
2. Avoid entering the trade when the price is temporarily above /below 10 day MA, but the price candle hasn’t fully formed yet. Enter the trade only after the price candle closes above/below the 10 day MA.
3. Exit the trade immediately when the price candle closes above/below 10 day MA in the direction opposite to the trade. Don’t remain in the trade wishing it to turn in your favor.
4. Never ever trade in the opposite direction of the market. i.e. don’t buy when the price is below 200 day MA and sell when the price is above 200 day MA.
5. Take profits when limit is reached. Don’t be greedy and keep on increasing the target. Remember- A bird in hand is worth two in the bush.

MACD, backtest 2015+ only, cut in half and doubledThis is only a slight modification to the existing "MACD Strategy" strategy plugin!
found the default MACD strategy to be lacking, although impressive for its simplicity. I added "year>2014" to the IF buy/sell conditions so it will only backtest from 2015 and beyond ** .
I also had a problem with the standard MACD trading late, per se. To that end I modified the inputs for fast/slow/signal to double. Example: my defaults are 10, 21, 10 so I put 20, 42, 20 in. This has the effect of making a 30min interval the same as 1 hour at 10,21,10. So if you want to backtest at 4hr, you would set your time interval to 2hr on the main chart. This is a handy way to make shorter time periods more useful even regardless of strategy/testing, since you can view 15min with alot less noise but a better response.
Used on BTCCNY OKcoin, with the chart set at 45 min (so really 90min in the strategy) this gave me a percent profitable of 42% and a profit factor of 1.998 on 189 trades.
Personally, I like to set the length/signals to 30,63,30. Meaning you need to triple the time, it allows for much better use of shorter time periods and the backtests are remarkably profitable. (i.e. 15min chart view = 45min on script, 30min= 1.5hr on script)
** If you want more specific time periods you need to try plugging in different bar values: replace "year" with "n" and "2014" with "5500". The bars are based on unix time I believe so you will need to play around with the number for n, with n being the numbers of bars.

Realtime Position CalculatorRisk management is the single most important factor in trading success. This indicator automates the process of position sizing in real-time based on your account risk and a dynamic technical Stop Loss. It eliminates the need for manual calculations and helps you execute trades faster while adhering to strict risk management rules.
How it Works
The indicator visually places a Stop Loss line based on recent market structure (Highs/Lows) and instantly calculates the required position size (Contracts/Lots) to match your defined monetary risk.
1. Dynamic Stop Loss : It identifies the highest high (for Shorts) or lowest low (for Longs) over a user-defined lookback period.
2. Position Calculation : It calculates the distance between the current price and the Stop Loss level.
3. Formula : Contract Size = Risk Amount / (Distance * Point Value)
4. Actual vs. Target Risk : Because of the rounding, the script calculates and displays the Actual Risk (e.g., $95) alongside your Target Risk (e.g., $100), so you know exactly what is at stake.
Key Features
Real-time Calculation : Updates instantly as price moves.
Copy Trading Support : Includes an "Account Multiplier" setting. If you trade 10 accounts via a copy trader, set the multiplier to 10. The indicator will show the total contract size needed across all accounts.
Point Value Support : Works for Stocks/Crypto (Point Value = 1) and Futures (e.g., ES = 50, NQ = 20).
Customizable UI : Toggle specific data on/off in the label (e.g., hide price, show only contracts). Adjustable label offset to keep the chart clean.
Settings Guide
Trade Direction : Toggle between Long and Short setups. Add the indicator two times and set another for Longs and another for Shorts so you can see both direction at the same time.
Risk Amount : Your max risk in currency (e.g., $100).
Lookback : How many bars back to look for the SL pivot (e.g., 10 bars).
Point Value : Crucial for Futures. Use 1.0 for Crypto/Stocks. Use tick value/point value for futures (e.g., 50 for ES).
Account Multiplier : Multiply the position size for multiple accounts.
Label Offset : Move the information label to the right to avoid overlapping with price action.
Disclaimer
This tool is for informational and educational purposes only. Always verify calculations manually before executing trades. Past performance is not indicative of future results.

Momentum Gamma StraddleExact definition of what that script does
1) Purpose
The script is a decision aid for intraday expiry-day ATM straddle trades. It detects intraday structure breakouts and signals candidate long straddle entries for Nifty or Sensex using price structure, volume, RSI momentum, and a user-supplied combined ATM premium value (CE + PE). It draws support/resistance, shows an info box, and raises alerts.
2) Inputs the user can change
Trading time window: startHour, startMin, endHour, endMin.
Structure lookback: res_lookback (how many candles to use to compute resistance/support).
Minimum candle body as fraction of candle range: min_body_pct.
Volume multiplier threshold: vol_mult (breakout candle volume must exceed vol_mult * sma5).
RSI length and thresholds: rsi_len, rsi_bull_thresh, rsi_bear_thresh.
Combined premium source: choose Manual or Symbol. If Manual, set manual_combined. If Symbol, provide a TradingView symbol that returns CE+PE combined ATM premium.
Combined premium acceptable band: min_combined_ok and max_combined_ok.
Profit target percent and SL percent (target_pct and sl_pct).
Misc pattern heuristics: min_res_hits (min tests of resistance inside lookback), low_slope_min (used to detect rising lows).
Micro-confirmation toggle, micro timeframe, nonrepaint option, show_entry_label toggle (in the later fixed versions some of these were added, but the earlier fixed script had basic combined_symbol options and a lookahead fallback).
3) Data calculated on each bar
Safety check hasEnough: true when bar_index >= res_lookback.
resistance: the highest high over res_lookback bars.
support: the lowest low over res_lookback bars.
res_hits: count of bars within lookback whose high is within a tolerance of resistance. Tolerance is 10 percent of the range between resistance and support.
low_slope: simple slope of lows over res_lookback bars.
body_pct: the candle body as a fraction of its high-low range. strong_body true when body_pct >= min_body_pct.
bull_breakout: true if hasEnough and current close > resistance and strong_body and res_hits >= min_res_hits.
bear_breakout: true if hasEnough and current close < support and strong_body and res_hits >= min_res_hits.
vol_sma5 and vol_ok: vol_ok true when current volume > vol_mult * vol_sma5.
rsi and rsi checks: rsi_bull_ok true if rsi >= rsi_bull_thresh; rsi_bear_ok true if rsi <= rsi_bear_thresh.
combined_premium: either the manual_combined input or the value read from combined_symbol via request.security. The script attempted a fallback to manual when the symbol was not valid.
combined_ok: true if combined_premium lies between min_combined_ok and max_combined_ok.
final signals: bull_signal when in_time_window and bull_breakout and vol_ok and rsi_bull_ok and combined_ok. bear_signal similar for bearish breakout.
4) Visual output and alerts
Plots resistance and support lines on the chart.
Plots a label shape "STRADDLE BUY" below the bar for bull_signal and above the bar for bear_signal.
Creates an info label (on last bar) that shows TimeOK, VolOK and vol ratio, RSI, Combined premium and whether it is OK, ResHits and LowSlope.
Sets two alertcondition events: "Bull Straddle BUY" and "Bear Straddle BUY" with a short candidate message. The alerts fire when the corresponding signal is true.
5) Execution assumptions you must follow manually
The script does not place any orders or compute option strike-level prices or greeks. It only flags candidate entry bars.
When combined_source is Manual you must type CE+PE yourself. The indicator will only accept the manual number and treat it as the combined premium.
When combined_source is Symbol the script uses request.security to read that symbol. For historical bars the indicator may repaint depending on lookahead settings. The earlier fixed script attempted to use request.security inside a conditional which leads to runtime or compile errors. You experienced that exact error.
6) Known implementation caveats and bugs you encountered
Pine typing issue with low_slope. The earlier version set low_slope = na without explicit type. That triggers the Pine error: "Value with NA type cannot be assigned to a variable that was defined without type keyword". This required changing to float low_slope = na.
The earlier version attempted to call request.security() inside an if block or conditional. Pine prohibits request.security in conditional blocks unless allowed patterns are followed. That produced the error you saw: "Cannot use request.* call within loops or conditional structures" or similar. The correct pattern is to call request.security at top-level and decide later which value to use.
If combined_symbol is invalid or not available on your TradingView subscription, request.security can return na and the script must fall back to manual value. The earlier fixed script attempted fallback but compiled errors prevented reliable behavior.
The earlier script did not include micro-confirmation or advanced nonrepaint controls. Those were added in later versions. Because of that, the earlier script may have given signals that appear to repaint on historical bars or may have thrown errors when using combined_symbol.
7) Decision logic summary (exact)
Only operate if current chart time is inside user set time window.
Only consider trade candidates when enough history exists for res_lookback.
Identify a resistance level as the highest high in the lookback. Count how many times that resistance was tested. Ensure the breakout candle has a strong body and volume spike. Ensure RSI is aligned with breakout direction.
Require combined ATM premium to be inside a user preferred band. If combined_symbol is used the script tries to read that value and use it; otherwise it uses manual_combined input.
If all the above conditions are true on a confirmed bar, the script plots a STRADDLE BUY label and triggers an alertcondition.
8) What the script does not do
It does not calculate CE and PE prices by strike. It only consumes or accepts combined premium number.
It does not compute greeks, IV, or OI. OI and IV checks must be done manually.
It does not manage positions. No SL management or automatic exits are executed by the script.
It does not simulate fills or account for bid/ask spreads or slippage.
It cannot detect off-exchange block trades or read exchange-level auction states beyond raw volume bars.
It may repaint historical labels if the combined_symbol was read with lookahead_on or the script used request.security in a way that repainted. The corrected final version uses nonrepaint options.
9) Manual checks you must always perform even when the script signals BUY
Confirm the live combined ATM premium and the bid/ask for CE and PE.
Check ATM IV and recent IV movement for a potential IV crush risk.
Check option OI distribution and recent OI changes for strike pinning or large player exposure.
Confirm CE and PE liquidity and depth. Wide spreads make fills unrealistic.
Confirm there is no scheduled news or auction within the next few minutes.
Confirm margin and position sizing fits your risk plan.
10) Quick testing checklist you can run now
Add the script to a 5-minute chart with combined_source = Manual.
Enter manual_combined equal to the real CE+PE at the moment you test.
Set startHour and endHour so the in_time_window is true for current time.
Look for STRADDLE BUY label on confirmed bars. Inspect the info box to see why it did or did not signal.
If you set combined_source = Symbol, verify the symbol exists and that TradingView returns values for it. If you previously saw the request.security error, that was caused by placing the request inside a conditional. The correct behavior is to call request.security unconditionally at top-level like in the final fixed version.

Risk & Position CalculatorThis indicator is called "Risk & Position Calculator".
This indicator shows 4 information on a table format.
1st: 20 day ADR% (ADR%)
2nd: Low of the day price (LoD)
3rd: The percentage distance between the low of the day price and the current market price in real-time (LoD dist.%)
4th: The calculated amount of shares that are suggested to buy (Shares)
The ADR% and LoD is straightforward, and I will explain more on the 3rd and 4th information.
__________________________________________________________________________________
The Lod dist.% is a useful tool if you are a breakout buyer and use the low of the day price as your stop loss, it helps you determine if a breakout buy is at a risk tight area (~1/2 ADR%) or it is more of a chase (>1 ADR%).
I use four different colors to visualize this calculation results (green, yellow, purple, and red).
Green: Lod dist.% <= 0.5 ADR%
Yellow: 0.5 ADR% < Lod dist.% <= 1 ADR%
Purple: 1 ADR% < Lod dist.% <= 1.5 ADR%
Red: 1.5 ADR% < Lod dist.%
(e.g., if Lod dist.% is colored in Green, it means your stop loss is <= 0.5 ADR%, therefore if you buy here, the risk is probably tight enough)
__________________________________________________________________________________
The Shares is a useful tool if you want to know exactly how many shares you should buy at the breakout moment. To use this tool, you first need to input two information in the indicator setting panel: the account size ($) and portfolio risk (%).
Account Size ($) means the dollar value in your total account.
Portfolio Risk (%) means how much risk you are willing to take per trade.
(e.g. a 1% portfolio risk in a 5000$ account is 50$, which is the risk you will take per trade)
After you provide these two inputs, the indicator will help you calculate how many shares you should buy based on the calculated Dollar Risk ($), real-time market price, and the low of the day price.
(e.g. Dollar Risk (50$), real-time market price (100$), Lod price (95$) -> then you will need to buy 50/(100-95) = 10 shares to meet your demand, so it will display as Shares { 10 } )
In addition, I also introduce a mechanism that helps you avoid buying too big of a position relative to your overall account . I set the limit to 25%, which means you don't put more than 25% of your account money into a single trade, which helps prevent single stock risk.
By introducing this mechanism, it will supervise if the suggested Shares to buy exceed max position limit (25%). If it actually exceeds, instead of using Dollar Risk ($) to calculate Shares, it will use position limit to calculate and display the max Shares you should buy.
__________________________________________________________________________________
That's it. Hope you find this explanation helpful when you use this indicator. Have a great day mate:)

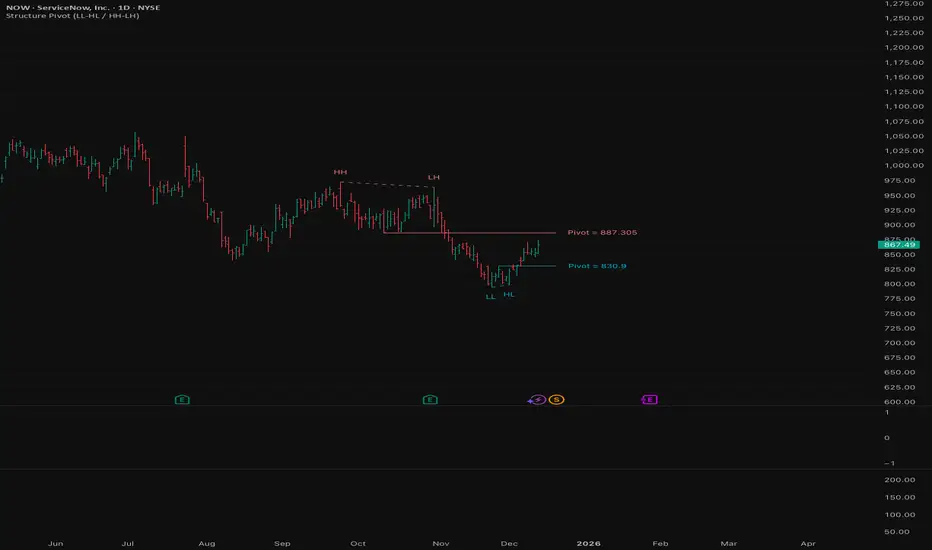
Structure Pivot (LL-HL / HH-LH)Structure Pivot (LL-HL / HH-LH) - Indicator Guide
This indicator scans for market structure pivot patterns—specifically the bullish Higher Low (LL–HL) and the bearish Lower High (HH–LH) —across multiple lengths simultaneously.
It automatically selects the most optimal pattern based on a "Priority Mode" and plots the structure and breakout/breakdown levels on the chart.
1. Basic Calculation Method
The indicator builds upon TradingView’s ta.pivotlow and ta.pivothigh functions to identify structural points.
Bullish Structure (LL–HL)
1.LL (Lowest Low): A standard Pivot Low is identified.
2.HL (Higher Low): A subsequent Pivot Low forms higher than the previous LL. This completes the setup.
3.Pivot Line (Resistance): The indicator finds the highest price (High) that occurred between the LL and the HL. This level becomes the breakout trigger.
Bearish Structure (HH–LH)
1.HH (Highest High): A standard Pivot High is identified.
2.LH (Lower High): A subsequent Pivot High forms lower than the previous HH. This completes the setup.
3.Pivot Line (Support): The indicator finds the lowest price (Low) that occurred between the HH and the LH. This level becomes the breakdown trigger.
2. Multi-Length Scanning
Unlike standard indicators that use a single fixed length (e.g., Length = 5), this indicator scans a range of lengths simultaneously.
・Settings: Defined by Min Length and Max Length.
・Mechanism: If set to Min=2 and Max=10, the indicator internally runs 9 separate calculations (Length 2 through 10) in parallel.
This allows it to capture everything from small, short-term pullbacks to larger, significant structural pivots without manual adjustment.
3. Priority Mode System
Since multiple lengths are scanned, multiple valid patterns may appear at the same time. The Priority Mode determines which single pattern is the "winner" and gets displayed.
A. Tightest Structure (Default)
・For Bullish (Long): Selects the pattern with the lowest Pivot Line (Resistance).
・For Bearish (Short): Selects the pattern with the highest Pivot Line (Support).
・Advantage: It finds the "tightest" contraction (like a VCP). This offers the entry point closest to the stop-loss level, providing the best Risk/Reward ratio.
B. Longest Length
・Selects the pattern detected by the longest length setting.
・Advantage: Focuses on major structural points, filtering out short-term noise. Best for trend confirmation.
C. Shortest Length
・Selects the pattern detected by the shortest length setting.
・Advantage: Extremely sensitive. Best for scalping or catching immediate micro-pullbacks.
4. Real-Time Logic & Features
Structure Invalidation (Failure)
・Bullish: If the current price drops below the HL (the support of the structure), the setup is considered failed.
・Bearish: If the current price rises above the LH (the resistance of the structure), the setup is considered failed.
・Result: All lines and labels for that structure are immediately deleted to keep the chart clean.
Pivot Line Extension
・As long as the structure remains valid (price hasn't violated the HL or LH), the Pivot Line extends to the right, acting as a live reference for breakouts or breakdowns.
Alerts
・Bullish Breakout: Triggered when the Close price crosses over the Pivot Line.
・Bearish Breakdown: Triggered when the Close price crosses under the Pivot Line.
The Reaper WhistleThe Reaper Whistle is a high-precision RSI momentum system engineered for scalpers and intraday traders.
It combines a customizable RSI with a dynamic moving average signal line to detect micro-shifts in momentum, early reversals, and continuation setups with extreme speed.
The indicator includes five key zones used by liquidity and SMC-style traders:
• Strong Sell (90) – Extreme momentum exhaustion
• Sell (80) – Overextension area
• TP Zone (50) – Momentum balance / decision point
• Buy (20) – Discount area
• Strong Buy (10) – Extreme sell-side exhaustion
By tracking how RSI interacts with its MA inside these zones, traders can identify high-probability sniper entries on the 1m, 3m, and 5m charts.
⸻
⭐ HOW IT WORKS (Quick Breakdown)
• RSI Period: defines momentum sensitivity
• MA Period: smooths RSI noise and clarifies direction shifts
• MA Type: SMA, EMA, or WMA for different reaction speeds
• Crossovers: show momentum flips or trend continuation
• Zones: filter out weak signals and highlight only premium setups
⸻
⚡ STRATEGY EXAMPLES
1️⃣ Liquidity Sweep Reversal (Most Powerful Setup)
Use case: Gold, NAS100, NQ, US30
1. Price sweeps a previous high/low
2. RSI spikes into Strong Sell (90) or Strong Buy (10)
3. RSI crosses its MA back inside the zone
4. Enter on candle confirmation
5. TP at the next imbalance, VWAP, or volume cluster
This setup catches V-shaped reversals and trap plays.
⸻
2️⃣ Trend Continuation Pullback
Use case: Trending markets
1. Identify trend direction (EMA 200, structure, etc.)
2. Wait for RSI to pull back to the TP (50) zone
3. Watch for RSI crossing its MA in trend direction
4. Enter with trend
5. TP at previous swing high/low
This setup filters out weak pullbacks and catches clean momentum continuation.
⸻
3️⃣ Breakout Confirmation
Use case: Range breakouts, opening range breaks
1. Price breaks a consolidation high/low
2. RSI holds above Sell (80) in uptrend or below Buy (20) in downtrend
3. RSI crosses its MA with momentum
4. Enter breakout
5. TP at HTF zone or liquidity target
Perfect for fast markets like NAS100 and Bitcoin.
⸻
4️⃣ Divergence + Whistle Flip
Use case: Slow markets or pre-session moves
1. Look for bullish or bearish RSI divergence
2. Wait for RSI to cross the MA in direction of divergence
3. Enter once momentum confirms
4. TP at imbalance, FVG, or mid-range
This increases divergence accuracy dramatically.
⸻
🔥 RECOMMENDED SETTINGS
• Scalping (1m–3m):
• RSI: 5
• MA: 3
• Type: EMA
• Intraday 5m–15m:
• RSI: 7–14
• MA: 5
• Type: SMA
⸻
⭐ WHO IT’S BUILT FOR
• Liquidity + SMC traders
• Scalpers who need fast confirmation
• Traders who want clean, simple entries
• Beginners who want visual guidance
• Professionals who want momentum precision
The Reaper Whistle is intentionally designed for speed, clarity, and reliability — no clutter, no lag, just pure momentum read.
— Created by TheTrendSniper (ChartReaper)
“When the market whispers… the Reaper whistles.”

ICT Breaker Blocks [Exponential-X]🔄 Breaker Blocks
Overview
Breaker Blocks automatically identifies failed order blocks that have reversed their polarity. When an order block gets broken, it often becomes a powerful support or resistance zone in the opposite direction. This indicator tracks these institutional "flips" based on ICT (Inner Circle Trader) concepts, helping identify where price is likely to find strong support or resistance after a structural break.
━━━━━━━━━━━━━━━━━━━━━━━━━━━━
🎯 What This Indicator Does
Detects Breaker Blocks:
• 🔵 Bullish Breaker Blocks (BB+) - Failed bearish order blocks that became support
• 🟣 Bearish Breaker Blocks (BB-) - Failed bullish order blocks that became resistance
• Tracks order blocks first, then monitors when they break
• Converts broken order blocks into breaker blocks automatically
• Shows when breakers get tested by price
How Breakers Form:
1. Order block forms (last opposite candle before strong move)
2. Price returns and breaks through the order block
3. Broken order block becomes a breaker block with flipped polarity
4. Old resistance becomes new support (or vice versa)
Visual Display: Smart Features:
• Auto-timeframe adjustment for optimal detection
• ATR-based strength filtering
• Active block highlighting
• Test tracking
• Distance calculator
• Duplicate prevention
━━━━━━━━━━━━━━━━━━━━━━━━━━━━
📚 Understanding Breaker Blocks
What Are Breaker Blocks?
Breaker blocks are failed order blocks that price has broken through. In ICT methodology:
• When institutions place orders creating an order block
• If that level fails and price breaks through
• The zone often becomes strong support/resistance in the opposite direction
• This represents institutional position flipping
Why Breakers Form:
• Failed Defense: Institutions couldn't defend the original level
• Position Flip: Institutions reversed their position
• Stop Hunt Complete: After sweeping stops, new levels form
• Polarity Change: Old resistance becomes new support (or vice versa)
Key Difference From Order Blocks: [/b>
• Order Block: Original institutional level (unbroken)
• Breaker Block: Failed order block that flipped polarity
• Breakers often provide STRONGER reactions than original OBs
• Represents where institutions changed their strategy
━━━━━━━━━━━━━━━━━━━━━━━━━━━━
🔵 Bullish Breaker Blocks Explained
Formation Process:
1. Step 1: Bearish order block forms (last bullish candle before drop)
2. Step 2: Price breaks ABOVE this bearish OB
3. Step 3: The broken bearish OB becomes a bullish breaker
4. Step 4: Now acts as SUPPORT when price returns
What It Means:
• Old resistance level failed
• Institutions flipped from selling to buying
• When price returns, zone acts as strong support
• Higher probability long setup than regular support
Trading Bullish Breakers:
Entry Setup:
• Wait for price to retrace back to bullish breaker
• Look for rejection/bounce from the breaker zone
• Enter long when price respects the breaker as support
• Stop loss: Below the breaker block
• Target: Recent high or opposite breaker
Why It Works:
Failed resistance becoming support is a strong technical signal indicating structural change in market sentiment.
━━━━━━━━━━━━━━━━━━━━━━━━━━━━
🟣 Bearish Breaker Blocks Explained
Formation Process:
1. Step 1: Bullish order block forms (last bearish candle before rally)
2. Step 2: Price breaks BELOW this bullish OB
3. Step 3: The broken bullish OB becomes a bearish breaker
4. Step 4: Now acts as RESISTANCE when price returns
What It Means:
• Old support level failed
• Institutions flipped from buying to selling
• When price returns, zone acts as strong resistance
• Higher probability short setup than regular resistance
Trading Bearish Breakers:
Entry Setup:
• Wait for price to retrace back to bearish breaker
• Look for rejection/reversal from the breaker zone
• Enter short when price respects the breaker as resistance
• Stop loss: Above the breaker block
• Target: Recent low or opposite breaker
Why It Works:
Failed support becoming resistance indicates structural change and often leads to continuation moves.
━━━━━━━━━━━━━━━━━━━━━━━━━━━━
📊 How To Use This Indicator
Strategy 1: Breaker Block Retest
Timeframes: 15min, 1H, 4H
Style: [/b> Swing trading, reversal entries
Rules:
1. Identify active breaker block (bright color, not gray)
2. Wait for price to return to the breaker zone
3. Look for reversal confirmation (pin bar, engulfing, rejection)
4. Enter in the direction the breaker suggests
5. Stop: Beyond opposite side of breaker
6. Target: 2-3R or previous structure
Example - Bullish Breaker:
• Bullish breaker at $48,000-$48,500
• Price drops to $48,200 (enters breaker)
• Bullish pin bar forms
• Enter long at $48,600, stop at $47,800
• Target: $50,000+
Strategy 2: Multi-Timeframe Breakers
Timeframes: Combine 1H + 4H or 15min + 1H
Style: [/b> High-probability setups
Rules:
1. Identify breaker on higher timeframe (4H or Daily)
2. Switch to lower timeframe (1H or 15min)
3. Look for lower TF breaker WITHIN higher TF breaker
4. Trade the lower TF breaker in same direction as HTF
5. Stop: Below lower TF breaker
6. Target: Edge of higher TF breaker or beyond
Why It Works: Alignment across timeframes increases probability
Strategy 3: Breaker + Order Block Confluence
Timeframes: 1H, 4H
Style: High-conviction trades
Rules:
1. Find breaker block that overlaps with fresh order block
2. This creates double institutional zone
3. Wait for price to reach confluence area
4. Enter on first touch with confirmation
5. Stop: Beyond confluence zone
6. Target: 3-5R
Why It Works: Two ICT concepts aligned = maximum probability
Strategy 4: Breaker Breakout
Timeframes: [/b> 5min, 15min, 1H
Style: Trend continuation
Rules:
1. Price approaches breaker block
2. Instead of respecting it, price breaks THROUGH
3. This indicates very strong momentum
4. Enter breakout in direction of break
5. Stop: Back inside the breaker
6. Target: 2-3R
Why It Works: When breakers fail, momentum is extremely strong
━━━━━━━━━━━━━━━━━━━━━━━━━━━━
⚙️ Settings Explained
Core Settings
Auto-Adjust for Timeframe (Default: ON)
• Automatically optimizes detection for current chart
• 1min: 3 bars lookback
• 5min: 4 bars lookback
• 15min: 5 bars lookback
• 1H: 6 bars lookback
• 4H+: 8-12 bars lookback
• Recommended: Keep ON
Manual Detection Length (Default: 5)
• Only used when Auto-Adjust is OFF
• Lookback period for finding order blocks
• Lower = more sensitive
• Higher = more selective
Display Settings
Show Bullish/Bearish Breaker Blocks
• Toggle each type independently
• Customize colors (default: cyan and fuchsia)
• Tip: Use colors that stand out from order blocks
Max Breaker Blocks to Display (Default: 10) [/b>
• Limits visible breakers
• Lower (5-8): Cleaner chart
• Higher (15-30): More context
• Recommended: 10-15
Show Breaker Block Labels [/b>
• Displays BB+ and BB- text
• Shows 🎯 on active (nearest) breaker
• Turn OFF for minimal appearance
Extend Blocks (bars) (Default: 50)
• How far to extend boxes to the right
• Recommended: 40-60 bars
Filters
Block Strength Filter (Default: Medium)
• Low: 0.5x ATR - More breakers, more noise
• Medium: 1x ATR - Balanced
• High: 1.5x ATR - Only strongest breakers
• Note: Breakers are naturally less common than OBs
• For learning: Use Low to see more examples
• For trading: Use Medium or High
Min Block Size % (Default: 0.1)
• Minimum breaker size as % of price
• Filters tiny insignificant blocks
• Adjust based on instrument volatility
Advanced
Show Tested Blocks (Default: OFF) [/b>
• When ON: Shows gray boxes for tested breakers
• When OFF: Breakers disappear after test
• Use ON: For learning and analysis
• Use OFF: For clean active trading
Highlight Active Block (Default: ON)
• Highlights nearest breaker to current price
• Active block shown with brighter color and 🎯
• Recommended: Keep ON
━━━━━━━━━━━━━━━━━━━━━━━━━━━━
📱 Info Panel Guide
Bullish BB Count Bearish BB Count
• Number of active (untested) bearish breaker blocks
• More bearish breakers = More resistance zones above
Bias Indicator [/b>
• ⬆ Bullish: More bullish breakers (support > resistance)
• ⬇ Bearish: More bearish breakers (resistance > support)
• ↔ Neutral: Equal breakers on both sides
Near Indicator
• Shows nearest active breaker and distance
• Example: "Bull BB -1.5%" = Bullish breaker 1.5% below price
━━━━━━━━━━━━━━━━━━━━━━━━━━━━
📱 Alert Setup
This indicator includes 2 alert types:
1. Price Entering Bullish Breaker [/b>
• Fires when price touches bullish breaker block
• Action: Watch for bounce/support
2. Price Entering Bearish Breaker
• Fires when price touches bearish breaker block
• Action: Watch for rejection/resistance
To Set Up Alerts:
1. Click "Alert" button (clock icon)
2. Select "Breaker Blocks"
3. Choose alert type
4. Configure notifications
5. Click "Create"
━━━━━━━━━━━━━━━━━━━━━━━━━━━━
💎 Pro Tips & Best Practices
✅ DO:
• Wait for confirmation before entering at breakers
• First touch of breaker has highest reliability
• Use breakers with trend direction for best results
• Combine with order blocks and FVGs for confluence
• Check multiple timeframes for breaker alignment
• Respect breakers - they're stronger than regular S/R
• Use proper stop placement beyond the breaker
⚠️ DON'T:
• Don't trade every breaker - quality over quantity
• Don't ignore breaker breaks - very strong momentum signal
• Don't use tight stops - allow room for wicks
• Don't expect all breakers to hold
• Don't trade against strong momentum through breakers
• Don't confuse breakers with regular order blocks
🎯 Best Timeframes:
• Scalping: 5min, 15min (quick breaker tests)
• Day Trading: 15min, 1H (balanced)
• Swing Trading: 1H, 4H, Daily (major breakers)
🔥 Best Markets:
• Excellent: BTC, ETH, Forex majors, ES, NQ
• Good: Gold, Oil, Major indices
• Note: Breakers need volatility to form
━━━━━━━━━━━━━━━━━━━━━━━━━━━━
🎓 Advanced Concepts
Breaker Strength Hierarchy
From weakest to strongest:
1. Support/Resistance lines
2. Order Blocks (unbroken)
3. Breaker Blocks (broken OBs) ← Often strongest
4. Multiple breakers stacked together
Breaker vs Order Block Priority
If breaker and order block overlap:
• Breaker takes precedence
• Failed levels are more significant
• Price respects breakers more reliably
Nested Breakers [/b>
When lower timeframe breaker exists within higher timeframe breaker:
• Trade lower TF breaker first
• Use higher TF breaker as final target
• Highest probability setups
Multiple Breaker Tests [/b>
• First test: Highest probability
• Second test: Still valid but weaker
• Third test: Likely to break through
Breaker Breakouts [/b>
When price breaks through breaker:
• Extremely strong momentum signal
• Old level completely invalidated
• Trade the breakout aggressively
━━━━━━━━━━━━━━━━━━━━━━━━━━━━
📈 Common Patterns [/b>
Pattern 1: The Perfect Flip
• Bearish OB forms
• Price breaks above it cleanly
• Becomes bullish breaker
• First retest bounces perfectly
• High-probability setup
Pattern 2: The Double Break
• Bullish OB breaks down (becomes bearish breaker)
• Price tests it and rejects
• Later breaks back up through breaker
• Very strong momentum signal
Pattern 3: The Breaker Ladder [/b>
• Multiple breakers stacked like stairs
• Price bounces from one to next
• Each breaker provides support/resistance
Pattern 4: The Failed Breaker
• Breaker forms but gets broken immediately
• Shows extreme momentum
• Don't fight it - trade the breakout
━━━━━━━━━━━━━━━━━━━━━━━━━━━━
🙏 If You Find This Helpful
• ⭐ Leave your feedback
• 💬 Share your experience in the comments
• 🔔 Follow for updates and new tools
Questions about breaker blocks? Feel free to ask in the comments.
━━━━━━━━━━━━━━━━━━━━━━━━━━━━
Version History [/b>
• v1.0 - Initial release with auto-timeframe detection and polarity flip tracking

DR/IDR Break .5 TPDR/IDR Extension Breakout with Custom Stop
This strategy is a systematic, counter-trend, and momentum-based system designed for intraday trading. It operates on the principle of an Opening Range Breakout (ORB), utilizing the initial market consolidation to project high-probability targets, while offering multiple methods for managing risk.
1. Market Identification (The Opening Range)
The strategy begins by defining the market's initial boundaries and volatility:
Session Window: The strategy calculates the Opening Range (OR) over a user-defined time period (default: 9:30 AM to 10:30 AM New York Time).
ORB Levels: Two key price levels are established and locked once the time window closes:
Wick High/Low: The absolute highest and lowest prices of the session. These serve as the entry trigger lines.
Body High/Low (Shaded Range): The highest and lowest open/close prices of the session. The height of this range is used to calculate the Take Profit and Stop Loss levels.
2. Entry Rule (The Breakout)
The strategy is passive until the range is violated, looking for a strong move out of the consolidation area.
Trigger Condition: A trade is signaled when a candle closes either:
Above the Wick High (for a Long entry).
Below the Wick Low (for a Short entry).
Execution: The entry is a Market Order executed on the candle that meets the trigger condition, subject to a user-defined Entry Delay (default 0 bars, meaning the entry is taken immediately upon the breakout candle's close).
Direction Control: The user can select to trade Long Only, Short Only, or Both.
3. Exit and Risk Management
All trades are placed with simultaneous Take Profit and Stop Loss orders (a bracket order) once the entry is filled.
A. Take Profit (TP)
The Take Profit is set at the 0.5 Extension of the Shaded Range (Body Range).
Calculation: The distance from the Body High/Low to the TP level is exactly 50% of the total height of the Shaded Range.
B. Stop Loss (SL)
The Stop Loss is dynamically calculated based on a user-selected method for risk control:
Range 0.5 (Body Range): The Stop Loss is placed an equal distance (0.5 times the Body Range height) outside the opposite side of the Body Range.
Example (Long): If entry is above the Wick High, the SL is set 0.5 times the Body Range height below the Body Low.
ATR Multiple: The Stop Loss distance is determined by the asset's recent volatility.
Calculation: The distance is calculated as a user-defined Multiplier (default 2.0) times the Average True Range (ATR).
Recent Swing Low/High: The Stop Loss is placed based on a structural level defined by recent price action.
Long Entry: SL is placed at the Lowest Swing Low within a user-defined lookback period.
Short Entry: SL is placed at the Highest Swing High within a user-defined lookback period.
Summary of Workflow
The market sets the Wick and Body boundaries (e.g., 9:30–10:30 AM).
Price breaks and closes beyond a Wick boundary, triggering a signal.
The trade enters after the specified delay.
A bracket order is placed: TP is fixed at the 0.5 Extension, and SL is set based on the user's chosen risk method.
The trade is closed upon reaching either the TP or the SL level.

LL-HL PivotThis indicator scans for the bullish structure known as a Higher Low (HL) across multiple lengths simultaneously, automatically selects the most suitable pattern, and plots it on the chart.
Below is a detailed explanation of how it works.
1. Basic Calculation Method (Definition of LL and HL)
This indicator is built on TradingView’s ta.pivotlow function.
Detecting Pivot Lows
For a given length, a Pivot Low is identified as the lowest point among the candles within the specified range to the left and right.
LL and HL Determination
LL (Lowest Low): The most recent Pivot Low is treated as the previous low.
HL (Higher Low): When a new Pivot Low forms above the previous LL, it is recognized as an HL, and the setup is considered “complete.”
Identifying the Pivot Line
During the LL–HL structure, the highest high between them is identified and used as the breakout level (Pivot Line / resistance), where a horizontal line is drawn.
2. Multi-Length Scanning
Unlike standard indicators that use only one length (e.g., Length = 5), this indicator evaluates a full range of lengths.
Min Length to Max Length
Example: Min = 2, Max = 10
Internally, it functions as if nine separate indicators (Length 2, 3, 4 … 10) are running simultaneously.
This allows the indicator to capture:
Small waves (short-term pullbacks)
Larger waves (broader structural moves)
3. Priority Mode System
Because multiple lengths are calculated at the same time, different LL–HL patterns may appear simultaneously.Priority Mode determines which setup is selected and displayed.
A. Lowest LH
Selects the pattern with the lowest pivot line (intermediate high).
Advantages:
Produces the lowest possible entry price
B. Longest Length
Selects the pattern with the longest length.
Advantages:
Focuses on larger structures and broader waves
Filters out noise
C. Shortest Length
Selects the pattern with the shortest length.
Advantages:
Reacts quickly to small moves
Useful for scalping or fast trend-following
Captures very short-term pullbacks
4. Additional Behavior and Features
Real-Time Invalidation
If price breaks below the confirmed HL, the structure is immediately considered invalid.
All previously drawn lines and labels are removed instantly, preventing outdated structures from remaining on the chart.
Pivot Line Extension
As long as the HL remains intact, the Pivot Line (breakout level) continues extending to the right.
Alerts
An alert can be triggered the moment price breaks above the Pivot Line on a closing basis.

DR/IDR, fractals, break + EMA Clouds + VWAPThis indicator is a powerful, multi-layered trading tool that combines three distinct forms of market analysis—volume, trend, and opening volatility—onto a single chart.
1. Opening Range Breakout (ORB) System
This is the foundation of the indicator, designed to capture the initial volatility and set key price boundaries for the trading day.
Time Focus: The indicator's primary analysis is centered on a specific, user-defined time period (default is 9:30 AM to 10:30 AM New York Time). Nothing related to the ORB drawing will appear on the chart before this session starts.
Wick High/Low (The Trigger): These lines track the absolute highest and lowest prices reached during the time window. They define the full extent of the initial range and are used to determine when a genuine breakout occurs.
Body High/Low (The Range & Targets): These lines track the highest and lowest open/close prices of the candles within the session. This area forms the central, shaded zone, representing the core consolidation area.
Range Shading: The background between the Body High and Body Low is shaded, but this visual feature only appears during the active forming time window (e.g., 9:30 AM to 10:30 AM) to maintain chart clarity.
Fractals: While the range is forming, the indicator detects 5-bar Williams Fractal patterns that occur inside the range. These small triangles (▲ or ▼) highlight minor reversal points established by the early trading action.
Breakout Signal: After the user-defined time window closes, the indicator waits. If a subsequent candle's price moves above the Wick High or below the Wick Low, a "BREAK" label is displayed on that candle. It is programmed to label only the first decisive break in each direction per day.
Extension Targets: When a breakout occurs, target lines are automatically projected above the Body High (for a bullish break) or below the Body Low (for a bearish break). The distance between these targets is calculated based on a user-defined fraction (e.g., 0.5 steps) of the total height of the Body Range.
Line Cutoff: For tidiness, you can set a "Stop Time" (e.g., 4:00 PM) after which the ORB lines will automatically disappear.
2. EMA Clouds (Trend and Momentum)
Four distinct Exponential Moving Average (EMA) clouds are plotted to provide a dynamic, multi-speed view of the market's trend and momentum.
Structure: Each "Cloud" is the shaded area between two EMAs (one shorter length and one longer length). The indicator includes four customizable pairs (defaulting to common settings like 8/9, 8/14, 34/50, and 14/21).
Trend Coloring: The clouds are color-coded:
Bullish (Greenish): The shorter EMA is trading above the longer EMA, signaling upward momentum.
Bearish (Reddish): The shorter EMA is trading below the longer EMA, signaling downward momentum.
Application: These clouds are used to confirm the overall market direction or identify potential zones of support and resistance.
3. Volume-Weighted Average Price (VWAP)
The VWAP is a crucial anchor for measuring the market's efficiency throughout the trading day.
Function: It calculates the average price of the asset, giving more weight to prices where higher volume was traded.
Context: It helps traders quickly determine if the current price is trading at a premium (above VWAP) or a discount (below VWAP) relative to the day's volume.
Reset: The VWAP line automatically resets at the beginning of each trading day.
Customization: The VWAP line can be toggled on or off, and its color and width are fully adjustable.

DR/IDR fractals break candle (ChadAnt)This indicator is an Opening Range Breakout (ORB) tool. It identifies the high and low price range established during a specific time window (e.g., the first hour of trading, 9:30–10:30 AM NY time). Once that time window closes, it watches for the price to "break out" of that range and projects profit targets based on the size of the initial range.
Key Features & How They Work
1. The Opening Range (The Box)
Time Window: The indicator waits for your specific start time (default 9:30 AM NY). It does not draw anything before this time.
The "Wicks": It tracks the absolute highest and lowest prices reached during this time (the Wicks). These act as your Breakout Triggers.
The "Body": It tracks the highest and lowest candle closes/opens during this time. This creates a shaded "zone" on your chart, representing the core area where most trading occurred.
Shading: To keep your chart clean, the background shading only appears during the forming time window.
2. Breakout Signals
Once the time window ends (e.g., 10:30 AM), the indicator "locks" the levels.
It then waits for a candle to move above the Wick High or below the Wick Low.
The Signal: When this happens, a label ("BREAK") appears on the chart.
Green Label: Bullish breakout (price went above the range).
Red Label: Bearish breakout (price went below the range).
Note: It only signals the first breakout of the day to avoid false alarms during choppy markets.
3. Extension Targets (Profit Levels)
When a breakout signal occurs, the indicator automatically draws target lines (extensions).
Calculation: These targets are based on the height of the "Body" zone (the shaded area).
Example: If your setting is 1.0, the indicator measures the height of the shaded body range and projects that exact distance above the breakout point. This is often used as a "Measured Move" target.
You can customize how many lines appear and how far apart they are (e.g., 0.5, 1.0, 1.5 times the range size).
4. Williams Fractals
During the opening range time, the indicator looks for specific price patterns called "Williams Fractals" (a 5-candle pattern that highlights potential turning points).
If a fractal peak or valley occurs inside your opening range, it marks it with a small triangle (▲ or ▼). Traders often use these as early signs of support or resistance forming inside the range.
5. Clean Visuals
Line Cutoff: You can set a "Stop Time" (e.g., 16:00 or 4:00 PM). The lines will stop drawing at that time so they don't clutter your chart overnight.
Gap Handling: The lines are programmed to break cleanly between days, so you don't see messy diagonal lines connecting yesterday's close to today's open.
Summary of Settings You Can Change
Session Time: When the range starts and ends.
Line Stop Time: When the lines should disappear for the day.
Visuals: Colors, line width, and style (solid, dotted, dashed).
Extensions: How many target lines to draw and the step size (e.g., 0.5x, 1.0x).
Fractals: Toggle the triangle icons on/off.

Fanfans-Supertrend 10in1
## English Summary
This indicator, named "Multi-Indicator Trend Grid (Weighted Version)", is a comprehensive technical analysis tool. It integrates 10 classic technical indicators, categorized into three tiers based on trading weight: Tier 1 (GWMA, EMA, MACD) are core trend judgment indicators; Tier 2 (RSI, CCI, Bollinger Bands) are trend confirmation indicators; Tier 3 (VWAP, KDJ, ADX, Supertrend) are auxiliary filtering indicators. Using MACD histogram coloring logic, it visually displays the strength changes of bullish/bearish trends through dark/light green and dark/light red colors. This tool helps traders quickly identify market trend directions, confirm signal validity, and filter out false signals. It is particularly suitable for multi-timeframe analysis and trend reversal warnings, providing a visual "trend consensus" judgment method.
## 中文总结
此指标名为"多指标趋势网格(权重排序版)",是一个综合性的技术分析工具。它整合了10个经典技术指标,按照交易权重分为三个梯队:第一梯队(GWMA、EMA、MACD)为核心趋势判断指标;第二梯队(RSI、CCI、布林带)为趋势确认指标;第三梯队(VWAP、KDJ、ADX、Supertrend)为辅助过滤指标。指标采用MACD柱状图配色逻辑,通过深绿/浅绿和深红/浅红直观显示多头/空头趋势的强弱变化。该工具能帮助交易者快速识别市场趋势方向、确认信号有效性并过滤虚假信号,特别适用于多时间框架分析和趋势转换预警,提供了一种可视化的"趋势共识"判断方法。
