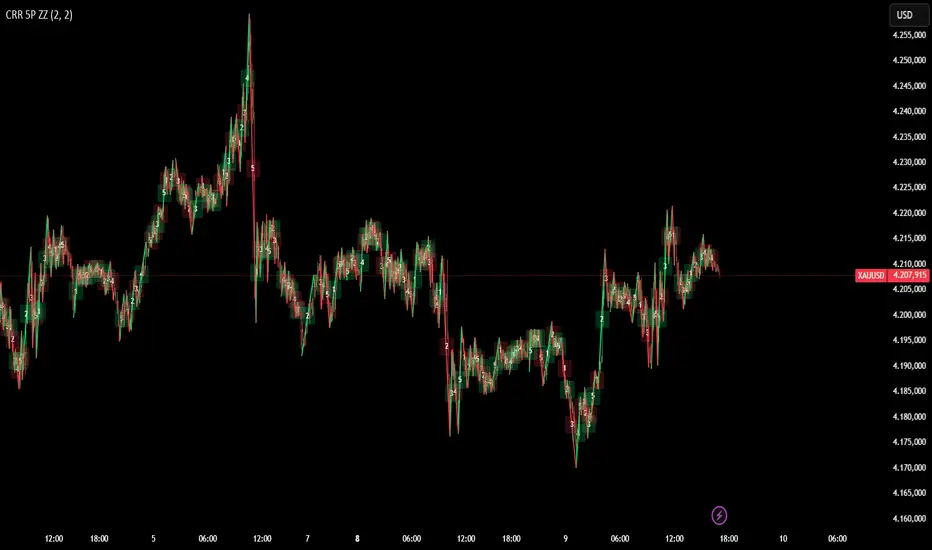
CRR 5P ZZ SIMPLEIt detects High and Low pivots using the number of bars you choose.
It connects these pivots, forming a professional ZigZag pattern.
Every time the price changes direction (from high to low or low to high), it draws a new leg of the movement.
Each leg receives a number from 1 to 5, showing the "Elliott" wave sequence simply and automatically.
⚙️ How does it work?
It identifies a HIGH pivot → bullish leg.
It identifies a LOW pivot → bearish leg.
When it detects a change from HIGH to LOW or LOW to HIGH:
It draws the ZigZag line.
It advances the wave counter (1–5).
It places a number in the middle of the line.
Green lines represent bullish legs,
red lines represent bearish legs.
🎯 What is it for?
To see the real market structure without noise.
To quickly identify key movements.
To help you understand the 1–5 wave progression without complications.
Ideal for scalping, day trading, and structural analysis.
If you'd like, I can create a short manual, a client version, or a marketing-style explanation for social media.
In den Scripts nach "纳斯达克期货cfd" suchen
CRR Darvas Nemesis SCALP 1m–5m v1.5CRR Darvas Nemesis Scalp 1m–5m – What it is and how it works
The CRR Darvas Nemesis Scalp is an indicator designed to help you detect strong and reliable breakouts in scalping, using a smart Darvas box with professional confirmations.
What does it do?
It automatically draws a "Darvas Box" on a higher timeframe (usually 5 minutes).
This box represents an area where the price has been accumulating or consolidating.
It detects the actual breakout of that box only when:
There is strong volume (higher than average).
The trend is favorable (measured with the EMA of the higher timeframe).
It provides A+ entry and exit signals for scalping trades:
✔️ LONG A+ when it breaks the top of the box with volume + trend.
❌ EXIT when it breaks below the bottom of the box.
Includes a professional HUD with:
Current status (In box, Breakout A+, Exit, etc.)
Box High / Box Low
Suggested Stop (bottom of the box)
Volume strength
📌 How to get the most out of it? (SUMMARY)
1. Wait for the Darvas Box to form
The box marks the accumulation zone.
While the price is inside: DO NOT trade yet.
2. Only look for movement when the box is broken
The upward breakout is only valid if:
There is high volume
The trend is aligned
The indicator already filters this for you → it shows you LONG A+.
3. Enter only on A+ signals (the strongest ones)
The green triangle indicates:
Legitimate breakout
High volume
Favorable trend
This is the highest probability entry.
4. Use the bottom of the box as a stop
Each LONG signal automatically comes with a suggested stop:
Stop = bottom of the Darvas Box
Simple, clear, and professional.
5. Exit the trade when the system indicates EXIT
If a red triangle or "Long Exit" text appears, it means:
The breakout failed or ran out of momentum
It's time to close the trade
📌 In short
This indicator allows you to identify real breakouts and avoid traps.
It filters trend, volume, and structure to give you only A+ signals. Ideal for fast and precise scalping on 1m–5m timeframes.

CRR Range Timer (Recarga)What this indicator does (CRR Range Timer – “Recarga”)
In simple words:
Defines a price range (your “reload zone”)
You set:
Zona Low → bottom of the range (e.g. 4210.0)
Zona High → top of the range (e.g. 4220.0)
Optional Tolerancia in ticks, to make the zone a bit wider.
The script automatically calculates zonaMin and zonaMax and checks if the current close is inside that zone.
Counts how long price stays inside that range
If close is inside the zone → enRango = true.
It counts consecutive bars inside the zone: barrasEnRango.
It converts that into time:
Uses your chart timeframe (timeframe.in_seconds(timeframe.period))
Calculates total seconds → minutes → then splits into:
Days (d)
Hours (h)
Minutes (m)
Example text: 2d 5h 30m means price has been stuck inside that range for 2 days, 5 hours and 30 minutes.
Shows a HUD table with the range information
It creates a small table (HUD) on the chart (position configurable: top/bottom left/center/right) with:
Header row
"CRR RANGE TIMER"
"Recarga"
Symbol (e.g. XAUUSD)
Row 2
"Estado" → status: "En RANGO" (inside) or "Fuera RANGO" (outside), with green/red color
The time it has been in range: Xd Yh Zm
Row 3
"Zona" → the exact price range zonaMin - zonaMax
"Barras: N" → number of bars inside the range
Draws a text label on the chart near price
When price is inside the zone and Mostrar texto sobre el precio is ON:
It shows a label like:
Recarga: 0d 3h 15m
Zona: 4210.00 - 4220.00
The label moves with the latest bar near the current price.
Optional background highlight
When mostrarBg is true and price is inside the range, the background of the chart in that bar is tinted (teal, very transparent).
This visually marks the “reload” area so you can see clearly when the market is stuck there.
How to use it to trade and “win” (trading logic idea)
This tool is not a buy/sell signal by itself.
It is a timer of accumulation / ranging in a specific price zone.
Think of it like this:
“The more time price spends inside a narrow zone, the stronger the potential move when it finally breaks out.”
Main use cases
Detect long consolidations before a big move
Choose an important zone: for example a NY range, a London range, or a zone between two key levels (support/resistance, supply/demand, OB, etc).
Set Zona Low and Zona High around that area.
Let the indicator count time:
If the HUD shows only a few minutes/bars, it’s a fresh range.
If the HUD shows many hours or even days, the market is “charging” (recargando) in that zone.
Trading idea:
You wait for a strong breakout of that zone after a good amount of “recarga” time.
The longer the recarga, the more aggressive the move can be when it finally escapes.
Filter bad trades inside dead ranges
Many traders lose money trading inside choppy ranges, especially in NY afternoon or Asia when the market is asleep.
With this indicator:
If you see the HUD saying En RANGO and 0d 2h 45m for example,
You know the market has been stuck almost 3 hours there.
You can create a rule for yourself:
“No new trades when price is inside my recarga box for more than X minutes/hours.”
That protects you from overtrading in low-volatility chop.
Objective measure of “how long it has been loading”
Instead of “it feels like it’s ranging”, you have a number:
On a 5m chart:
12 bars in range = 60 minutes
48 bars in range = 4 hours
On a 15m chart:
16 bars in range = 4 hours
The indicator does this math for you and displays it clearly.
Simple trading playbook example
You can adapt, but here’s a very simple way to use it:
Define your key zone
Use an important range: yesterday’s NY range, an accumulation box around a key level, or a consolidation before news.
Set Zona Low and Zona High to cover that area.
Optionally add Tolerancia (a few ticks) so small spikes don’t reset the timer.
Wait for recarga
Watch the HUD:
If time < 30–60 minutes → market still “loading”, small opportunities.
If time ≥ 2–4 hours (depending on timeframe and instrument) → stronger compression, potential for bigger breakout.
Plan your trade around the breakout
Don’t chase random candles inside the range.
Wait for:
A clear close above the high of the zone → bullish breakout idea.
A clear close below the low of the zone → bearish breakout idea.
Combine with your other tools (volume, structure, SMC, your CRR dashboard, etc) to confirm direction.
Risk management
Your stop can be placed:
Just inside the box (back inside the range = invalid breakout).
Target:
Previous swing levels, liquidity pools, or a multiple of your risk (1:2, 1:3, etc).

Bästa Bob Multi-RSI 😎👊✅ RSI 7 → Fast impulse indicator
• Shows micro-movements
• Reacts instantly to liquidity sweeps
• Perfect for entry timing
✅ RSI 14 → Macro momentum indicator
• Captures the real trend
• Filters out noise
• Confirms larger market movements
When both are in sync → you get true market direction plus perfect timing.
👉 How to Use RSI 7 + RSI 14
1️⃣ Entry Signals (the best method)
BUY when:
• RSI 7 turns up from oversold
• RSI 14 is also sloping upward or gets crossed by RSI 7 from below
→ Extremely accurate right after a liquidity sweep.
SELL when:
• RSI 7 turns down from overbought
• RSI 14 is sloping downward or gets crossed by RSI 7 from above
→ Works insanely well for fakeouts and FVG entries.
2️⃣ Trend Filter
• When RSI 14 stays above 50 → market is bullish
• When RSI 14 stays below 50 → bearish
RSI 7 is then used only for timing entries.
3️⃣ A++ Setups (your favorite ones 😉🔥)
The best signals appear when:
✔ RSI 7 crosses RSI 14 at the same time as:
• a liquidity sweep happens
• price taps into an FVG or Order Block
• volume reacts
• your trend filter (EMA, HTF) supports the move
This combo is criminally effective when scalping BTC, NAS100, and XAUUSD.

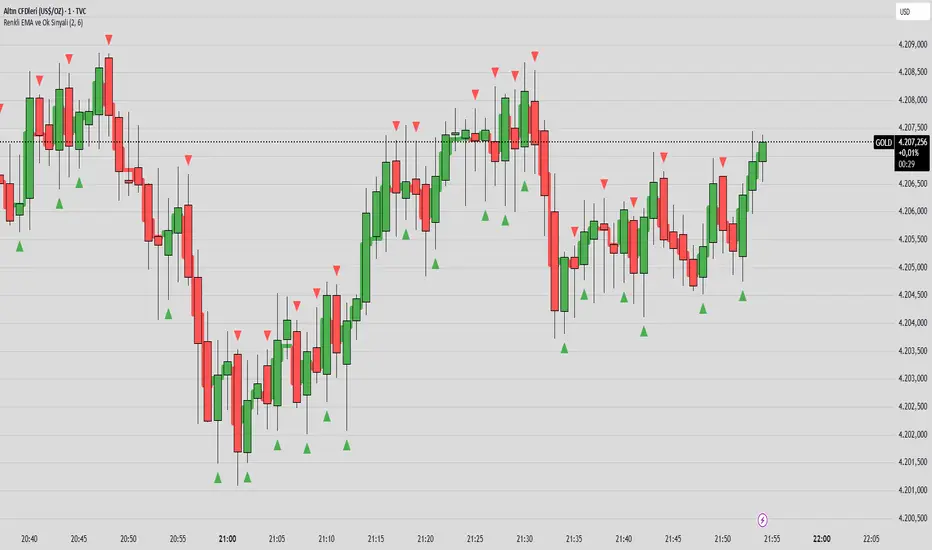
Renkli EMA ve Ok Sinyali by incebacak//@version=5
indicator(, overlay=true)
//
emaLength = input.int(20, "EMA Periyodu")
emaColorUp = input.color(color.green, "EMA Yukarı Renk")
emaColorDown = input.color(color.red, "EMA Aşağı Renk")
barColorUp = input.color(color.new(color.green, 0), "Yukarı Mum Renk")
barColorDown = input.color(color.new(color.red, 0), "Aşağı Mum Renk")
emaThickness = input.int(3, "EMA Kalınlığı")
//
emaValue = ta.ema(close, emaLength)
//
emaRising = emaValue > emaValue
emaFalling = emaValue < emaValue
emaCol = emaRising ? emaColorUp : emaColorDown
plot(emaValue, color=emaCol, linewidth=emaThickness, title="EMA")
//
barcolor(close > emaValue ? barColorUp : barColorDown)
//
plotshape(ta.crossover(close, emaValue), title="Al Sinyali", location=location.belowbar, color=color.green, style=shape.triangleup, size=size.small)
plotshape(ta.crossunder(close, emaValue), title="Sat Sinyali", location=location.abovebar, color=color.red, style=shape.triangledown, size=size.small)
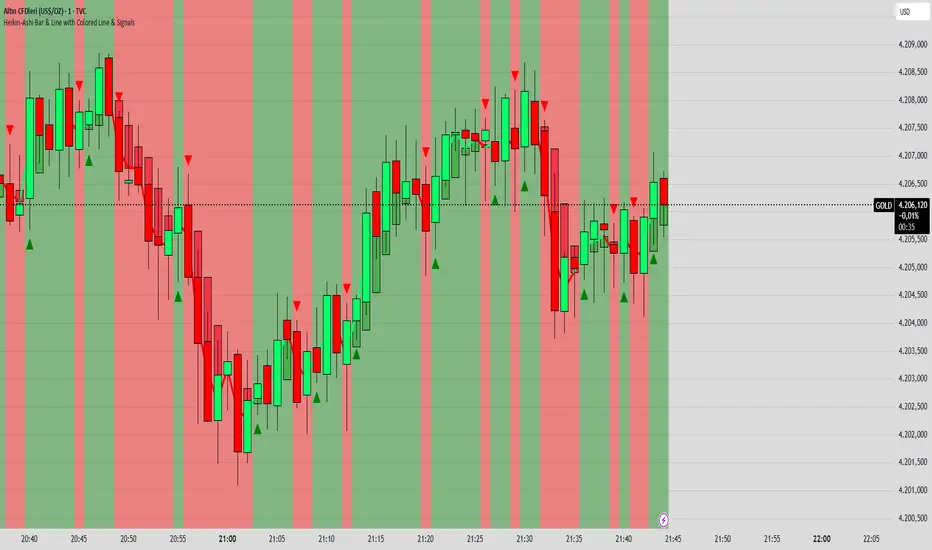
Heikin-Ashi Bar & Line with Colored Line & Signals//@version=6
indicator("Heikin-Ashi Bar & Line with Colored Line & Signals", overlay=true)
// Heikin-Ashi hesaplamaları
var float haOpen = na
haClose = (open + high + low + close) / 4
haOpen := na(haOpen) ? (open + close)/2 : (haOpen + haClose )/2
haHigh = math.max(high, haOpen, haClose)
haLow = math.min(low, haOpen, haClose)
// Trend hesaplamaları
haBull = haClose >= haOpen
haColor = haBull ? color.new(color.green, 0) : color.new(color.red, 0)
// HA Barları
plotcandle(haOpen, haHigh, haLow, haClose, color=haColor, wickcolor=haColor)
// HA Line (renk değişiyor)
lineColor = haBull ? color.green : color.red
plot(haClose, title="HA Close Line", color=lineColor, linewidth=2)
// Trend arka planı
bgcolor(haBull ? color.new(color.green, 85) : color.new(color.red, 85))
// Al/Sat sinyalleri (trend değişimlerinde)
longSignal = haBull and haClose > haOpen and haClose < haOpen
shortSignal = not haBull and haClose < haOpen and haClose > haOpen
plotshape(longSignal, title="Al Sinyali", style=shape.triangleup, location=location.belowbar, color=color.green, size=size.small)
plotshape(shortSignal, title="Sat Sinyali", style=shape.triangledown, location=location.abovebar, color=color.red, size=size.small)
Volume State Box (Session-Normalized, M5)Zeigt in der Mitte des Charts oben das aktuellen Volumen an High Normal und Low der Session

ICT Order Block Identifier [Eˣ]📦 Order Block Identifier
Overview
The Order Block Identifier automatically detects and displays institutional order blocks on your charts - zones where banks, hedge funds, and market makers place their orders. This indicator helps identify where institutions are likely to defend their positions and where price often finds support or resistance, based on ICT (Inner Circle Trader) concepts.
━━━━━━━━━━━━━━━━━━━━━━━━━━━━
🎯 What This Indicator Does
Detects Order Blocks:
• 🟢 Bullish Order Blocks (OB+) - Last bearish candle before strong bullish move
• 🔴 Bearish Order Blocks (OB-) - Last bullish candle before strong bearish move
• Automatically identifies institutional buying/selling zones
• Tracks up to 30 order blocks simultaneously
• Works on all timeframes and instruments
Smart Features:
• Auto-Timeframe Adjustment - Optimizes detection for 1min to Weekly charts
• Active Block Highlighting - Shows which OB price is approaching
• Touch Tracking - Knows when blocks are tested
• ATR-Based Detection - Adapts to each instrument's volatility
• Strength Filtering - Choose Low/Medium/High to control sensitivity
━━━━━━━━━━━━━━━━━━━━━━━━━━━━
📚 Understanding Order Blocks
What Are Order Blocks?
Order blocks are the "footprints" left behind by institutional traders (banks, hedge funds, market makers) when they enter large positions. Because institutions can't fill massive orders at once without moving the market, they:
1. Place orders gradually over time
2. Leave zones where their buy/sell orders are concentrated
3. Defend these zones when price returns
4. Create reliable support and resistance levels
The ICT Concept:
Developed by Michael Huddleston (Inner Circle Trader), order block theory states that:
• The last opposite-colored candle before a strong move contains institutional orders
• Price often returns to test these zones before continuing
• These zones act as strong support (bullish OB) or resistance (bearish OB)
• Smart money defends their positions at these levels
Why Order Blocks Work:
• Unfilled Orders: Institutions may still have pending orders in the block
• Position Defense: They protect their entries by adding to positions
• Stop Placement: Retail stops cluster near these zones (liquidity for institutions)
• Market Structure: Price respects these levels due to order flow dynamics
━━━━━━━━━━━━━━━━━━━━━━━━━━━━
🟢 Bullish Order Blocks Explained
How They Form:
1. Price is consolidating or declining
2. Institutions begin accumulating (buying)
3. A strong bullish move erupts
4. The last bearish candle before this move = Bullish Order Block
5. This candle represents where institutions were buying aggressively
Why The Last Bearish Candle?
• Institutions absorbed all selling pressure at this level
• Their buy orders filled as price was declining
• When price returns, they defend this zone with more buying
• It becomes a demand zone / support level
Trading Bullish Order Blocks:
Setup:
• Wait for price to retrace back to bullish OB (green box)
• Look for rejection/reversal pattern (pin bar, engulfing, etc.)
• Enter long when price bounces from the OB zone
• Stop loss: Below the order block
• Target: Recent high or opposite order block
Best Scenarios:
• OB aligns with other support (trendline, fibonacci, round number)
• First touch of OB (unmitigated) has highest probability
• Occurs during high-volume sessions (London/NY)
• Trend is bullish on higher timeframe
Example Trade:
• Bullish OB forms at $50,000 (last red candle before rally)
• Price rallies to $52,000 then retraces
• Price drops back to $50,100 (touching OB)
• Bullish pin bar forms on the OB
• Enter long at $50,200, stop at $49,800
• Target: $52,000+ (previous high)
━━━━━━━━━━━━━━━━━━━━━━━━━━━━
🔴 Bearish Order Blocks Explained
How They Form:
1. Price is consolidating or rising
2. Institutions begin distributing (selling)
3. A strong bearish move erupts
4. The last bullish candle before this move = Bearish Order Block
5. This candle represents where institutions were selling aggressively
Why The Last Bullish Candle?
• Institutions absorbed all buying pressure at this level
• Their sell orders filled as price was rising
• When price returns, they defend this zone with more selling
• It becomes a supply zone / resistance level
Trading Bearish Order Blocks:
Setup:
• Wait for price to retrace back to bearish OB (red box)
• Look for rejection/reversal pattern (shooting star, bearish engulfing)
• Enter short when price rejects from the OB zone
• Stop loss: Above the order block
• Target: Recent low or opposite order block
Best Scenarios:
• OB aligns with other resistance (trendline, fibonacci, round number)
• First touch of OB (unmitigated) has highest probability
• Occurs during high-volume sessions (London/NY)
• Trend is bearish on higher timeframe
Example Trade:
• Bearish OB forms at $48,000 (last green candle before drop)
• Price drops to $46,000 then retraces
• Price rallies back to $47,900 (touching OB)
• Bearish engulfing forms at the OB
• Enter short at $47,800, stop at $48,200
• Target: $46,000- (previous low)
━━━━━━━━━━━━━━━━━━━━━━━━━━━━
📊 How To Use This Indicator
Strategy 1: Order Block Retest (Classic)
Best For: Swing trading, capturing reversals
Timeframes: 15min, 1H, 4H, Daily
Win Rate: 60-70% (first touch)
Entry Rules:
1. Identify unmitigated order block (bright color, not gray)
2. Wait for price to return to the OB zone
3. Look for price action confirmation:
• Bullish OB: Pin bar, bullish engulfing, hammer
• Bearish OB: Shooting star, bearish engulfing, doji
4. Enter in the direction of the OB
5. Stop loss: Beyond the opposite side of OB (20-30 pips)
6. Target: 2-3R or opposite OB
Example:
• Bullish OB at $100-$102
• Price drops to $101.50 (enters OB)
• Bullish pin bar forms with low at $100.80
• Enter long at $102 (OB high), stop at $99.50
• Risk: $2.50, Target: $107.50 (3R)
Strategy 2: Break & Retest
Best For: Trend trading, breakout confirmation
Timeframes: 5min, 15min, 1H
Win Rate: 65-75%
Entry Rules:
1. Price breaks through an order block
2. Wait for pullback to the broken OB
3. The OB now acts as support (if broken up) or resistance (if broken down)
4. Enter when price respects the flipped OB
5. Stop: Inside the OB zone
6. Target: Next OB or structure level
Why It Works: Broken OBs flip polarity - support becomes resistance and vice versa
Strategy 3: Multi-Timeframe Confirmation
Best For: High-probability setups
Timeframes: Combine 1H + 4H or 15min + 1H
Win Rate: 70-80%
Entry Rules:
1. Identify order block on higher timeframe (4H or Daily)
2. Switch to lower timeframe (1H or 15min)
3. Wait for lower TF order block to form within higher TF OB
4. Trade the lower TF OB in direction of higher TF OB
5. Stop: Below lower TF OB
6. Target: Edge of higher TF OB or beyond
Why It Works: Alignment across timeframes = institutional consensus
Strategy 4: Order Block to Order Block
Best For: Range trading, swing entries
Timeframes: 1H, 4H
Win Rate: 55-65%
Entry Rules:
1. Identify both bullish OB below and bearish OB above
2. Price is ranging between these OBs
3. Enter long at bullish OB, target bearish OB
4. Enter short at bearish OB, target bullish OB
5. Stop: Beyond the trading OB
6. Exit at opposite OB
Why It Works: Price moves from one institutional zone to another
Strategy 5: Mitigation Fade
Best For: Aggressive scalping
Timeframes: 5min, 15min
Win Rate: 50-60% (higher risk)
Entry Rules:
1. Price approaches an order block
2. Instead of bouncing, price breaks through (mitigates it)
3. Enter immediately in direction of breakout
4. Stop: Back inside the mitigated OB
5. Quick target: 1-1.5R
Why It Works: When OB fails, it often leads to strong continuation
━━━━━━━━━━━━━━━━━━━━━━━━━━━━
⚙️ Settings Explained
Core Settings
Auto-Adjust for Timeframe (Default: ON)
• Automatically optimizes detection for current chart timeframe
• 1min: 3 bars lookback
• 5min: 4 bars lookback
• 15min: 5 bars lookback
• 1H: 6 bars lookback
• 4H: 8 bars lookback
• Daily+: 10-12 bars lookback
• Recommended: Keep ON for best results
Manual Detection Length (Default: 5)
• Only used when Auto-Adjust is OFF
• Number of bars to look back for the "last opposite candle"
• Lower (2-4): More sensitive, more blocks, more noise
• Higher (6-10): Less sensitive, fewer blocks, higher quality
• Recommended: Use Auto-Adjust instead
Display Settings
Show Bullish/Bearish Order Blocks
• Toggle each type on/off independently
• Customize colors for each OB type
• Tip: Match colors to your chart theme
Max Order Blocks to Display (Default: 10)
• Limits how many OBs are shown at once
• Lower (5-8): Cleaner chart, only recent blocks
• Higher (15-30): More historical context
• Recommended: 8-12 for most trading
Show Order Block Labels (Default: ON)
• Displays "OB+" and "OB-" text on blocks
• Shows 🎯 on active (nearest) block
• Turn OFF for minimal chart appearance
• Recommended: Keep ON for clarity
Extend Blocks (bars) (Default: 50)
• How far to extend OB boxes to the right
• Lower (20-30): Shorter boxes, less clutter
• Higher (100+): Longer boxes, easier to see
• Blocks auto-extend until mitigated or limit reached
• Recommended: 40-60 bars
Filters
Block Strength Filter (Default: Medium)
• Controls how strong a move must be to create an OB
• Low: 0.5x ATR move required - Many blocks, more noise
• Medium: 1x ATR move required - Balanced quality/quantity
• High: 1.5x ATR move required - Only strongest institutional moves
• Recommended for beginners: High
• Recommended for experienced: Medium
• Recommended for scalpers: Low
Min Block Size % (Default: 0.1)
• Minimum size of OB as percentage of price
• Filters out tiny, insignificant blocks
• Crypto: 0.1-0.3%
• Forex: 0.05-0.15%
• Stocks: 0.1-0.5%
• Adjust based on instrument volatility
Advanced Settings
Show Mitigated Blocks (Default: OFF)
• When ON: Shows gray boxes for "used" order blocks
• When OFF: Blocks disappear after mitigation
• Use ON: For learning and analysis
• Use OFF: For clean, active trading
Highlight Active Block (Default: ON)
• Highlights the nearest order block to current price
• Active block shown with 🎯 emoji and brighter color
• Helps focus on most relevant trading opportunity
• Recommended: Keep ON
━━━━━━━━━━━━━━━━━━━━━━━━━━━━
📱 Info Panel Guide
Bullish OB Count
• Number of active (unmitigated) bullish order blocks
• Higher number = More support zones below price
• Multiple bullish OBs = Strong demand structure
Bearish OB Count
• Number of active (unmitigated) bearish order blocks
• Higher number = More resistance zones above price
• Multiple bearish OBs = Strong supply structure
Bias Indicator
• ⬆ Bullish: More bullish OBs than bearish (demand > supply)
• ⬇ Bearish: More bearish OBs than bullish (supply > demand)
• ↔ Neutral: Equal OBs on both sides
• Trade in direction of bias for higher probability
Near Indicator
• Shows which OB price is closest to
• Displays distance as percentage
• Example: "Bull OB 0.85%" = Bullish OB is 0.85% below current price
• Watch for "Near" alerts to time entries
━━━━━━━━━━━━━━━━━━━━━━━━━━━━
📱 Alert Setup
This indicator includes 4 alert types:
1. Price Entering Bullish OB
• Fires when price touches a bullish order block
• Action: Watch for bounce/reversal pattern
• High-probability long setup developing
2. Price Entering Bearish OB
• Fires when price touches a bearish order block
• Action: Watch for rejection/reversal pattern
• High-probability short setup developing
3. New Bullish OB Detected
• Fires when a new bullish order block forms
• Action: Mark the zone for future retest
• New demand zone identified
4. New Bearish OB Detected
• Fires when a new bearish order block forms
• Action: Mark the zone for future retest
• New supply zone identified
To Set Up Alerts:
1. Click "Alert" button (clock icon)
2. Select "Order Block Identifier"
3. Choose your alert condition
4. Configure notification method
5. Click "Create"
Pro Tip: Set "Price Entering" alerts to catch trading opportunities in real-time
━━━━━━━━━━━━━━━━━━━━━━━━━━━━
💎 Pro Tips & Best Practices
✅ DO:
• First touch is best - Unmitigated OBs have highest win rate (60-70%)
• Wait for confirmation - Don't buy/sell just because price touched OB
• Use multiple timeframes - Higher TF OBs are stronger than lower TF
• Combine with structure - OB + trendline/support = high probability
• Trade with the bias - More bullish OBs = favor longs
• Respect mitigation - Once OB is mitigated, it's less reliable
• Use proper stop loss - Always place stops beyond the OB zone
• Consider session timing - OBs work best during London/NY sessions
⚠️ DON'T:
• Don't blindly buy/sell at OBs - Wait for confirmation
• Don't ignore mitigation - Gray blocks are much weaker
• Don't trade every OB - Quality over quantity
• Don't fight strong trends - OBs can be run through in strong momentum
• Don't use alone - Combine with price action, support/resistance
• Don't expect 100% win rate - Even best OBs fail sometimes (30-40% of time)
• Don't overtrade - Wait for A+ setups with confluence
🎯 Best Timeframes By Trading Style:
• Scalpers: 1min, 5min (quick OB touches)
• Day Traders: 5min, 15min, 1H (balanced view)
• Swing Traders: 1H, 4H, Daily (major institutional zones)
• Position Traders: 4H, Daily, Weekly (strongest OBs)
🔥 Best Instruments:
• Excellent: Forex major pairs (EUR/USD, GBP/USD), BTC, ETH, ES, NQ
• Good: Gold, Oil, Major indices, Large-cap stocks
• Moderate: Altcoins, small-cap stocks (more noise)
• Avoid: Very low liquidity instruments (OBs less reliable)
⏰ Best Times To Trade OBs:
• London Session (03:00-12:00 EST): Highest OB respect rate
• NY Session (08:00-17:00 EST): Strong OB reactions
• London-NY Overlap (08:00-12:00 EST): Best probability
• Asian Session: Lower probability, wait for London
━━━━━━━━━━━━━━━━━━━━━━━━━━━━
🎓 Advanced Order Block Concepts
Order Block Flips (Polarity Change)
When price breaks through an OB and closes beyond it:
• Bullish OB that's broken becomes bearish (support becomes resistance)
• Bearish OB that's broken becomes bullish (resistance becomes support)
• Trading: Watch for retest of broken OB from opposite side
Order Block Refinement
When multiple OBs form at similar level:
• Later OB "refines" or "replaces" the earlier one
• Use the most recent OB as the active zone
• Older OBs become less relevant
Order Block Clusters
Multiple OBs stacked close together:
• Creates a "super zone" of institutional interest
• Higher probability of reversal
• Wider zone for entries (more room for confirmation)
Fair Value Gaps + Order Blocks
When OB aligns with Fair Value Gap:
• Extremely high probability setup
• Price is drawn to fill the gap AND test the OB
• Double confluence = institutional magnet
Order Block Mitigation Types
• Full Mitigation: Price fully enters and closes inside OB
• Partial Mitigation: Price wicks into OB but closes outside
• False Mitigation: Quick touch then immediate rejection
• Partial/false mitigation = OB still somewhat valid
━━━━━━━━━━━━━━━━━━━━━━━━━━━━
📈 Common Order Block Patterns
Pattern 1: The Perfect Retest
• OB forms during strong move
• Price continues 100-200+ pips
• Price retraces back to OB
• Clean bounce with confirmation candle
• Highest probability pattern
Pattern 2: The Double Tap
• Price tests OB, bounces weakly
• Price tests same OB again
• Second test produces stronger reaction
• Second touch often better entry
Pattern 3: The Fake-Out
• Price breaks through OB
• Immediately reverses back
• "Stop hunt" or liquidity grab
• Enter after price reclaims OB
Pattern 4: The Ladder
• Multiple OBs stacked like stairs
• Price steps from one OB to next
• Each OB provides support/resistance
• Trade OB-to-OB movements
Pattern 5: The Failed OB
• Price crashes through OB without pause
• OB completely invalidated
• Often signals strong momentum
• Don't fight it, trade the breakout
━━━━━━━━━━━━━━━━━━━━━━━━━━━━
🚀 What Makes This Different?
Unlike basic support/resistance indicators, Order Block Identifier:
• ICT Methodology - Based on proven institutional concepts
• Auto-Timeframe Optimization - Works perfectly on all timeframes
• ATR-Based Detection - Adapts to each instrument's volatility
• Mitigation Tracking - Knows when blocks are no longer valid
• Active Block Highlighting - Shows most relevant opportunity
• Smart Filtering - Only shows high-quality institutional zones
• Visual Clarity - Clean, professional appearance
• Real-Time Updates - Blocks update as price action develops
Based On Professional Concepts:
• ICT Smart Money Concepts (SMC)
• Institutional order flow analysis
• Market maker behavior patterns
• Supply and demand zone theory
━━━━━━━━━━━━━━━━━━━━━━━━━━━━
🙏 If You Find This Helpful
• ⭐ Leave your feedback
• 💬 Share your experience in the comments
• 🔔 Follow for updates and new tools
Questions about Order Blocks? Feel free to ask in the comments.
━━━━━━━━━━━━━━━━━━━━━━━━━━━━
Version History
• v1.0 - Initial release with auto-timeframe detection and ATR-based strength filtering

XAU Micro ScalperThis indicator is designed for short-term price rotation detection on XAUUSD, especially on the 1-minute timeframe.
It combines three momentum components—Stochastic, RSI, and OBV slope—to highlight potential reversal points and short-term scalping opportunities.
Core Logic
The script generates a signal only when multiple conditions align:
1. Stochastic Reversal (Timing Component)
A basic long/short trigger occurs when the Stochastic oscillator exits oversold (long) or overbought (short).
This represents a potential shift in short-term momentum.
2. RSI “Smart Rotation” Filter (Context Component)
Instead of using fixed oversold/overbought thresholds, the indicator checks whether RSI is turning:
Long: RSI is below a contextual ceiling (default 50) and rising
Short: RSI is above a contextual floor (default 55) and falling
This avoids premature entries during strong trending phases and confirms that momentum is actually rotating.
3. OBV Slope Filter (Volume Confirmation)
The On-Balance Volume trend is compared to its previous value:
Long: OBV slope improving
Short: OBV slope deteriorating
This helps confirm whether volume pressure is shifting in favor of the trade direction.
Both RSI and OBV filters can be enabled or disabled independently via the indicator settings.
Signals
Small circles mark raw Stochastic reversal points (unfiltered).
Green / red triangles represent validated long/short signals where all active filters agree.
Optional candle coloring highlights confirmed entry signals on the chart.
Use Cases
Intraday and scalping strategies on XAUUSD
Identifying short-term momentum reversals
Filtering noisy signals during high-volatility sessions
Studying how volume and momentum align around turning points
Customization
Users can adjust:
RSI contextual thresholds
Lookback periods
OBV slope sensitivity
Stochastic parameters
Activation of RSI and OBV filters
This flexibility allows the indicator to adapt to different market conditions and timeframes.
Disclaimer
This indicator does not provide financial advice or guarantee performance.
Always test any strategy on historical data and use proper risk management.

Session Sweep System – WarRoomXYZ V1WarRoom Session Sweep System v1 is a open-source institutional trading framework built to identify liquidity behavior across Asia, London, and New York sessions.
It combines session-based liquidity mapping, sweep detection, daily expansion modeling, and trend confirmation into a unified, timing-driven system optimized for XAUUSD, FX pairs, indices, and any instrument with session-dependent volatility.
This tool does not attempt to predict direction with arbitrary oscillators.
Instead, it focuses on the underlying market mechanisms that drive price:
liquidity, timing, expansion, and trend alignment.
Below is a detailed explanation of what the script does, how its components work, and how traders can use it effectively.
🔹 1. Session Liquidity Mapping
The script automatically identifies the Asia (00:00–06:00 GMT), London (07:00–12:00 GMT), and New York (13:00–17:00 GMT) sessions and builds real-time session ranges.
Each session creates a liquidity pool.
Trading institutions frequently sweep the high or low of one session before delivering the real move in the next session.
This script captures that behavior by:
►Drawing session range boxes
►Tracking previous session highs/lows
►Highlighting high-probability sweep locations
These ranges are essential reference points for timing entries and exits.
🔹 2. Liquidity Sweep Detection (Buy & Sell Sweeps)
The indicator identifies when price runs a previous session high/low and rejects back inside the range, which is commonly interpreted as a liquidity sweep.
The following sweep types are monitored:
►London sweeping Asia
►New York sweeping London
►Asia sweeping New York
►Daily sweep of PDH/PDL
Sweeps signal that liquidity has been collected and that a potential reversal or continuation is likely.
These are marked clearly on the chart for real-time decision-making.
🔹 3. Killzone Timing Model (GMT Time)
Market manipulation and expansion often occur during specific time windows.
The script highlights these institutional killzones:
►London Killzone: 07:00–10:00 GMT
►New York Killzone: 13:30–15:30 GMT
►NY PM Session: 19:00–21:00 GMT
Sweeps occurring inside these windows carry a significantly higher probability.
The timing layer helps filter out low-quality setups.
🔹 4. Daily Range & ADR Expansion Engine
A dedicated panel displays:
►Current day range
►ADR (Average Daily Range)
►Expansion stage (Early / Developed / Extended)
►PDH/PDL swept or intact
►Overall session bias
This allows traders to understand whether the daily move is likely to continue or reverse.
For example:
►Early expansion → trend continuation likely
►Extended expansion → reversal setups become more probable
This is useful for intraday targets and risk management.
🔹 5. MA Cloud Trend Model (Fast/Slow Structure)
To align liquidity behavior with directional conviction, the script includes a configurable MA engine:
►Fast & slow MA
►MA cloud
►Slope-based trend coloring
►Trend background
►MA cross alerts
The cloud provides trend confirmation without relying on oscillators.
Trades are higher quality when the sweep direction aligns with the MA trend.
🔹 6. How the Components Work Together
The script integrates several institutional concepts into one coherent model:
►Sessions define liquidity pools
►Sweeps identify stop-hunts and reversals
►Killzones define optimal timing
►MA Cloud confirms directional bias
►ADR engine indicates expansion potential
This creates a structured framework:
Sweep → Timing → Trend → Expansion → Execution
Each component strengthens the others, forming a robust decision-making model.
🔹 7. How to Use the Indicator (Practical Guide)
✔ Look for a sweep of a previous session level
When price runs a session high/low and closes back inside, liquidity has likely been collected.
✔ Confirm timing
Sweeps inside London or NY killzones tend to produce the strongest moves.
✔ Confirm trend
Use MA cloud direction and slope:
►Cloud green → long setups preferred
►Cloud red → short setups preferred
✔ Check ADR panel
If the day has already expanded significantly, reversal setups are more likely.
If expansion is still early, continuation setups are favored.
✔ Plan your trade
Common targets include:
►Opposite side of session range
►ADR High/Low
►PDH/PDL
Stops are typically placed beyond the sweep wick.
This creates a repeatable, rule-based approach to intraday liquidity trading.
🔹 8. Why This Script Is Original
This is not a mashup of existing open-source indicators.
It introduces:
►A custom session-linked liquidity sweep engine
►A structured daily expansion model
►Integrated killzone timing aligned with GMT
►A unified bias panel merging sweeps, ADR, and session manipulation
►A trend confirmation layer designed around session behavior
While it uses known institutional concepts, their integration, execution, and timing framework are unique, purpose-built, and not directly found in open-source scripts.
🔹 9. Suitable Markets
This indicator works best on:
►XAUUSD
►Major FX pairs
►US indices
►Synthetic markets with session cycles
Ideal timeframes: 1m, 5m, 15m, 30m
🔹 10. Limitations / Notes
This is an analytical tool, not a buy/sell signal generator
All sweeps are confirmed at candle close (non-repaint)
The tool assumes GMT session windows unless chart time differs
Users must practice risk management and entry triggers manually
Disclaimer
This script is provided for informational and educational purposes only. It does not provide financial, investment, or trading advice, and it does not guarantee profits or future performance. All decisions made based on this script are solely the responsibility of the user.
This script does not execute trades, manage risk, or replace the need for trader discretion. Market behavior can change quickly, and past behavior detected by the script does not ensure similar future outcomes.
Users should test the script on demo or simulation environments before applying it to live markets and must maintain full responsibility for their own risk management, position sizing, and trade execution.
Trading involves risk, and losses can exceed deposits. By using this script, you acknowledge that you understand and accept all associated risks.

Momentum Candle by DNDFXMomentum Candle v2 is a simple yet powerful indicator designed to detect strong momentum candles based on candle body size and the ratio between the body and total wick.
This indicator is ideal for traders who focus on:
Momentum trading
Breakout strategies
XAUUSD (Gold) scalping
Supply & Demand / Smart Money Concepts (SMC) confirmation
🔧 How the Indicator Works
The indicator analyzes each candle and classifies it as a Bullish Momentum or Bearish Momentum candle when these conditions are met:
✅ The candle body exceeds the minimum size
✅ The total wick is smaller compared to the body
✅ The Body-to-Wick ratio meets the strength filter
Visual signals include:
Green background for bullish momentum
Red background for bearish momentum
Up/Down triangle markers as entry guidance
⚙️ Customizable Parameters
Min Body Size (Points) – Sets the minimum candle body size
Min Body : Wick Ratio – Controls how dominant the body is compared to the wicks
All parameters can be optimized according to your trading style and timeframe.
✅ Best Use Cases
This indicator is useful for:
Breakout confirmation
Momentum validation
Filtering false breakouts
Scalping and intraday trading on XAUUSD
🧠 Trading Tips
For better accuracy, combine this indicator with:
Support & Resistance
Supply & Demand zones
Break of Structure (BOS) / CHoCH
Best performance on M5 – H1 timeframes.
⚠️ DISCLAIMER
This indicator is a supporting tool, not a guaranteed profit system. Always apply proper risk management. You are fully responsible for your trading decisions.

rosha xau-usd 3.1.6 (v6)one of my fresh creations, use to trade profitably, includes months of my analysis and sgreen time for you all xauusd traders


rosha 3.1.6 (v6)ema based for scalping xauusd,good during london and newyork sassions, use withour modifications, dont enter in tranverse markate

Z-Score – Clean & Hover Info Wang Shi JieClean Z-Score indicator with no clutter. Shows Z-Score line and key levels (+2/–2/–3). Hover any bar to view date, close price, and Z value. Simple, fast, and ideal for quant and mean-reversion trading.

Koushik_BBEMAJust a combination of BB and EMA. An easy way to immediately add bollinger band and multiple ema to your chart.

window//@version=5
indicator("Smart Money Time Windows (GMT+3:30)", overlay=true)
// ✅ Window 1 — 08:30 to 09:05 Tehran Time
w1 = time(timeframe.period, "0830-0905", "Asia/Tehran")
// ✅ Window 2 — 13:50 to 14:40 Tehran Time
w2 = time(timeframe.period, "1350-1440", "Asia/Tehran")
// ✅ Window 3 — 17:15 to 18:00 Tehran Time
w3 = time(timeframe.period, "1715-1800", "Asia/Tehran")
bgcolor(not na(w1) ? color.new(color.blue, 85) : na)
bgcolor(not na(w2) ? color.new(color.orange, 85) : na)
bgcolor(not na(w3) ? color.new(color.purple, 85) : na)

5MA+スーパートレンド + Disparity Scalping (SIMPLE FILTER)5MA + ATR Trend Filter + Disparity Scalping
This indicator combines a five-EMA trend framework, an ATR-based trailing trend line, a volatility breakout detector, and an ultra-fast scalping module using RSI and custom momentum prediction.
It is designed for both trend continuation and rapid reversal trading.
🔹 Main Components
1️⃣ Five-EMA Trend Framework
Uses 9 / 20 / 50 / 100 / 200 EMAs
Identifies short-term and long-term market direction
Provides dynamic support and resistance
Helpful for determining breakout vs. pullback conditions
2️⃣ ATR-Based Trailing Trend Line
Uses ATR multiplier to build a trailing stop line
Color change indicates directional shift
Works as a trend filter or trailing stop reference
Helps avoid counter-trend trades during strong trends
3️⃣ High-Volatility Breakout Detector (Optimized for Fast Markets)
Uses ATR expansion, Bollinger band breakout, and volatility comparison (HV vs RV)
Detects sudden market acceleration
Generates breakout BUY/SELL signals when volatility pressure aligns with direction
Useful for explosive markets such as gold or crypto, but compatible with all assets
4️⃣ Ultra-Fast Disparity Scalper
Measures price distance from EMA5 and EMA10
Uses RSI for exhaustion filtering
Predicts momentum turns with a custom RVI-based algorithm
Generates early reversal BUY/SELL signals before full market reaction
Designed for scalping in high-speed environments
5️⃣ Simple Overheat Filter
Blocks trades in extremely overbought/oversold zones
Gray signals indicate low-quality trade setups to avoid
Helps remove “chasing” entries during excessive deviation
🎯 Best Use Cases
Scalping fast reversals
Entering trends after confirmed volatility breakouts
Filtering entries during extreme overbought/oversold phases
Combining EMA structure with breakout momentum
⚠️ Important Notice
This tool is designed to support decision making, not guarantee trade results.
For best performance, combine with:
Price action (market structure)
Volume/volatility context
Support and resistance analysis
🏷️ Short Description (for compact summary)
Five-EMA trend structure with ATR trailing filter, volatility breakout detection, and ultra-fast scalping using RSI + momentum prediction. Suitable for both rapid reversals and trend continuation setups.

5MA+TrendMagic + Disparity Scalping (SIMPLE FILTER)5MA + Trend Filter + Disparity Scalping
This multi-purpose indicator combines a five-EMA trend structure, a volatility-based trend filter, and an ultra-fast scalping module to detect both trend continuation and sharp reversal opportunities.
It is suitable for scalping, day trading, and trend-following strategies.
🔹 Main Components
1️⃣ Five-EMA Trend Structure
Displays 9 / 20 / 50 / 100 / 200 EMA levels
Helps identify short-term and long-term market direction
Useful for support and resistance during trending markets
2️⃣ Volatility-Driven Trend Filter
Uses CCI and ATR to form a dynamic trailing line
The line switches color based on momentum direction
Can act as a trailing stop or trend confirmation filter
Helps avoid counter-trend entries
3️⃣ High-Volatility GOLD Signal
Detects sudden volatility expansions using ATR, Bollinger metrics, and volatility comparison (HV vs RV)
Marks rapid breakout situations with potential continuation setups
Available for all assets, optimized for highly volatile markets
4️⃣ Ultra-Fast Disparity Scalper
Measures price deviation from EMA5 and EMA10
Confirms exhaustion using RSI + momentum prediction from a custom RVI model
Generates early BUY/SELL reversal markers
Detects momentum shifts before price fully reacts
5️⃣ Simple Overheat Filter
Prevents trades in extremely overbought/oversold zones
Gray-colored signals indicate unsafe trades to avoid
🎯 Best Use Cases
Catching early reversals during fast movement
Identifying strong trend continuation after volatility expansion
Avoiding low-probability scalps in overheated conditions
Applying EMA structure for confluence with price action
⚠️ Note
This indicator is a decision-support tool, not a standalone signal generator.
For best precision, combine with:
Market structure
Volume analysis
Support / resistance levels
🏷️ Short Description (for compact field)
Multi-function tool combining 5EMA structure, volatility-based trend filtering, and ultra-fast reversal scalping using RSI + custom RVI momentum. Ideal for both trend continuation and rapid reversals.

ATR + BJ Signal(GOLD)This script visualizes a price-based counting pattern that highlights potential market exhaustion and reversal areas.
When a series of candles continues in one direction, the indicator measures price momentum loss and marks possible turning points.
Features
Counts consecutive upward or downward price movement
Highlights possible exhaustion or reversal areas
Optional alerts, take-profit and stop-loss visual levels
Fully customizable colors and display settings
Useful as a confirmation tool with trend or volume indicators
This indicator is designed to assist decision-making, not to generate mechanical buy/sell signals.
Best used together with other trend or volatility tools.
📎 Short Description (for compact field)
Counts consecutive price movement to highlight potential market exhaustion and reversal zones.
Helps identify when strong trends may be weakening.

RSI + Psy + ADX P2RSI + Psy + ADX
This indicator combines multi-length RSI analysis with the Psychological Line (PSY) and ADX trend strength to highlight reversal zones, emotional extremes, and trend conditions in a single unified panel.
🔹 Features
1️⃣ Triple RSI with Dynamic Colors
Displays Short / Mid / Long RSI values (9 / 26 / 52 by default)
Line color changes based on RSI levels:
🔴 Overbought (above 68)
🟢 Oversold (below 32)
⚪ Neutral market conditions
Fixed zone levels at 70 / 50 / 30 for simple visual analysis
2️⃣ Psychological Line (PSY) Extreme Signal
Measures the percentage of bearish candles in the selected period
Only highlights emotional extremes (overbought & oversold conditions)
Red/Green histogram makes market sentiment easy to read
3️⃣ ADX Trend Strength Detector
Confirms trend momentum using ADX
Color-coded levels:
🔵 Weak trend
🟡 Moderate trend
🔴 Strong trend (possible trend continuation)
Helps avoid counter-trend trades during strong momentum
4️⃣ RSI Background Highlight (Mid-term RSI Only)
Background turns RED in overbought area
Background turns GREEN in oversold area
Provides fast and clean recognition of reversal zones
🎯 Best Uses
Identifying low-risk reversal entry zones
Avoiding entries against strong trends
Confirming momentum and sentiment alignment
Useful for scalping, day-trading, and swing-trading strategies
💡 Tip
For higher precision, combine this indicator with:
🔹 Support/Resistance Levels
🔹 Candlestick Reversal Patterns
🔹 Volume Spikes or Breakout Tools

3 Lines RCI + Psy Signal + RSI Background📌 3 Lines RCI + Psy Signal + RSI Background
This indicator combines three RCI lines, Psychological Line signals, RSI-based background highlights, and ADX strength detection to visualize market momentum, trend strength, and potential reversal zones.
🔍 Main Features
📌 1. Triple RCI (Rank Correlation Index)
Displays Short / Mid / Long RCI
Detects momentum shifts and trend reversals
Highlight zones:
Overbought: +80 ~ +100 (Red Zone)
Oversold: -80 ~ -100 (Green Zone)
📌 2. Psychological Line Signal
Column bars appear only in extreme conditions:
Overbought → Red Bars
Oversold → Green Bars
Helps detect short-term sentiment extremes
📌 3. RSI Background Highlight
Red Background: RSI > Overbought threshold
Green Background: RSI < Oversold threshold
Provides a visual cue of underlying market pressure.
📌 4. ADX Trend Strength
ADX line color shows strength level:
Blue: Weak trend
Yellow: Moderate trend
Red: Strong trend
Useful to identify whether signals occur in a trend or range state.
🎯 Trading Usage Tips
RCI + RSI + Psy confluence can identify strong reversal timing.
Use signals only when ADX is weak or moderate to avoid counter-trading a strong trend.
Combine short/mid RCI crossovers with extreme zones for potential entry timing.
⚙️ Suitable For
Scalping, day trading, swing trading
Stocks, Forex, Crypto, Indices, Commodities
