Indicator: Trend Trigger FactorIntroduced by M.H.Pee, Trend Trigger Factor is designed to keep the trader trading with the trend.
System rules according to the developer:
* If the 15-day TTF is above 100 (indicating an uptrend), you will want to be in long positions.
* If the 15-day TTF is below -100, you will want to be short.
* If it is between -100 and 100, you should remain with the current position.
More info:
Original Article by Mr.Pee: drive.google.com
In den Scripts nach "机械革命无界15+时不时闪屏" suchen

Unmitigated Cave Diving MTF High Low - BookMap Style Chart
Unmitigated Cave Diving MTF High Low - BookMap Style Chart
Introduction
This Pine Script indicator tracks unmitigated higher timeframe highs and lows with a session-aware approach, inspired by KinetiCapital's X D HL Targets.
Built for precision trading on instruments like NQ during extended trading hours (ETH), it visualizes support and resistance levels that have not yet been breached, helping traders identify key price zones for potential reversals or breakouts.
Core Features
The indicator monitors multi-timeframe levels (default 15-minute) and applies intelligent styling based on recency and survival duration:
Most Recent Levels: The 1st and 2nd most recent unmitigated highs and lows are highlighted with distinct colors and widths for quick visual identification
Session Age Tracking: Levels are categorized by how many full trading sessions (1800-1700 NQ ETH) they've survived unmitigated, with "old" levels receiving special highlighting once they exceed your defined threshold
BookMap-Style Visualization: Clean horizontal lines with optional price labels positioned above highs and below lows for minimal chart clutter
Real-Time Summary Table: Displays the four most recent levels with their prices, distance in points from current price, and session age
Mitigation Logic
Levels automatically update when price touches them - high levels are mitigated when price reaches or exceeds them, while low levels are mitigated when price touches or breaks below. Mitigated levels change to a neutral gray color and can optionally be deleted at session end to preserve chart memory.
This tool is particularly valuable for intraday traders who trade around key structural levels and need to understand which unmitigated zones represent the freshest or most significant price memory in the market.

Intraday High Engulf 50% delta- RTH (CME)
Intraday High Engulf 50%Δ - RTH (CME)
Simple Introduction
The Intraday High Engulf 50%Δ - RTH indicator is a session-based breakout tool designed specifically for CME futures traders during Regular Trading Hours. It automatically tracks when price makes new highs throughout the trading day and displays three key levels on your chart: the session high (red line), the associated low (green line), and the midpoint between them (blue line).
Every morning at 9:30 AM Eastern Time, the indicator starts fresh and monitors price action until 4:00 PM. When price breaks above the current session high, the indicator updates all three lines and marks the breakout with a red circle. This gives you instant visual confirmation of upward momentum shifts.
The 50% Delta label shows you exactly half the distance between the midpoint and low, which helps with setting realistic profit targets and managing risk. Think of it as having automatic resistance levels that adjust as the market moves higher throughout the day.
This indicator works best for traders who focus on short-term upward breakouts in liquid futures markets like the E-mini S&P 500 or Nasdaq. It keeps your chart clean by only showing current session data and automatically resetting each new trading day.
Whether you're scalping on 1-minute charts or swing trading on 15-minute timeframes, the indicator adapts to your style while maintaining precise session-based tracking. The visual cues make it easy to spot bullish breakout opportunities even on busy trading days.
Use this alongside the Low Engulf version to track both upward and downward breakouts simultaneously, giving you a complete picture of intraday momentum shifts in both directions.

Intraday Low Engulf 50% delta- RTH (CME)
Intraday Low Engulf 50%Δ - RTH (CME)
Simple Introduction
The Intraday Low Engulf 50%Δ - RTH indicator is a session-based breakout tool designed specifically for CME futures traders during Regular Trading Hours. It automatically tracks when price makes new lows throughout the trading day and displays three key levels on your chart: the session low (green line), the associated high (red line), and the midpoint between them (blue line).
Every morning at 9:30 AM Eastern Time, the indicator starts fresh and monitors price action until 4:00 PM. When price drops below the current session low, the indicator updates all three lines and marks the breakout with a green circle. This gives you instant visual confirmation of downward momentum shifts.
The 50% Delta label shows you exactly half the distance between the high and midpoint, which helps with setting realistic profit targets and managing risk. Think of it as having automatic support levels that adjust as the market moves lower throughout the day.
This indicator works best for traders who focus on short-term downward breakouts in liquid futures markets like the E-mini S&P 500 or Nasdaq. It keeps your chart clean by only showing current session data and automatically resetting each new trading day.
Whether you're scalping on 1-minute charts or swing trading on 15-minute timeframes, the indicator adapts to your style while maintaining precise session-based tracking. The visual cues make it easy to spot breakout opportunities even on busy trading days.

Time Window Highlight📌 What this script does
Time Window Highlight highlights a specific intraday time window directly on your chart using a background color and optional vertical lines.
It was built for traders who focus on behavior around the US market open, where volatility, positioning, and false initial moves often occur.
The script does not generate signals.
It provides visual structure and timing clarity.
⸻
⏰ Default Use Case
By default, the window is set to:
• 15:40 – 16:00 (Europe/Rome time)
This time range is commonly used to observe:
• post-open fake moves
• early reversals
• stabilization after initial volatility
All times are fully customizable.
⸻
🎛️ Features
• ✅ Custom start & end time (hours and minutes)
• ✅ Background highlight for the active window
• ✅ Optional vertical start & end lines
• ✅ Option to include the full end candle
• ✅ Option to shift the end line to the end of the end candle
• ✅ Optional weekday filter (Monday–Friday only)
• ✅ Clean chart logic (historical background, live-day focus)
⸻
🧠 Designed Philosophy
This script was intentionally built to:
• avoid repainting
• avoid signals or bias
• avoid over-engineering
It is meant to support discretion, not replace it.
Use it to:
• stay patient outside your key window
• focus only when your session begins
• avoid forcing trades at random times
⸻
⚠️ Important Notes
• The script uses the chart’s timezone
→ Make sure your chart is set to Europe/Rome (or your preferred timezone).
• Background coloring works on full candles only (TradingView limitation).
• Vertical lines are time-anchored and align precisely with the session window.
⸻
🧪 Recommended Timeframes
• 1m / 2m / 5m (intraday)
• Not intended for daily or higher timeframes
⸻
❗ Disclaimer
This script is a visual aid only.
It does not provide buy or sell signals and should be used as part of a broader trading plan.

Multi-Timeframe High Low Marking LinesThis indicator automatically draws clean horizontal lines at the high and low of the previous 10 periods (adjustable) for four different timeframes simultaneously: Daily, Weekly, Monthly, and Quarterly.
Perfect for marking key support/resistance levels across multiple timeframes on any chart.
Key features:
• Shows previous 10 highs and lows per timeframe (change to 5, 15, 20 etc. in settings)
• Lines extend 20 bars to the right so they remain visible (adjustable)
• Individual on/off switch for each timeframe
• Clean blue lines, max 500 lines limit respected
• Works perfectly on any chart timeframe (1-minute to monthly)
• No repainting – lines only appear after the period has closed
Use cases:
Spot major daily/weekly/monthly support & resistance at a glance
Trade breakouts and reversals with higher-timeframe confirmation
Combine with your existing strategy (ICT, SMC, price action)
Ideal for stocks, forex, crypto and futures
Settings explained:
Timeframe 1–4 → Choose any timeframe (D, W, M, 3M already preset)
Show/Hide → Turn any timeframe on or off instantly
Periods to show → How many previous highs/lows you want visible
Extend lines → How far right each line continues (default 20 bars)
Completely free to use.
If you like it, please add to favorites and leave a comment – it helps other traders find it!
Enjoy cleaner charts and stronger confluence.
Happy trading!

Unmitigated High Low (Day/MTF)
# Unmitigated High Low (Day/MTF)
## Overview
The **Unmitigated High Low (Day/MTF)** indicator tracks previous timeframe highs and lows that remain "unmitigated" (untouched by price) and displays them as dynamic support and resistance levels. By default, the indicator monitors daily highs and lows, making it ideal for intraday traders seeking key institutional levels, though it supports any multi-timeframe (MTF) interval. The indicator extends horizontal lines from each level until price touches them, creating visual "zones of interest" where price action may react.
## What It Does
This indicator identifies and plots two types of levels on your chart:
- **High Levels** (yellow lines) - Previous timeframe highs that price has not yet reached or exceeded
- **Low Levels** (cyan lines) - Previous timeframe lows that price has not yet broken below
Each time a new timeframe period completes (e.g., daily candle closes), the indicator captures that period's high and low and extends them forward as horizontal reference lines. When price finally touches or crosses these levels, they become "mitigated" - the line stops extending, becomes transparent (60% opacity), and is marked as historical.
## Key Features
**Multi-Timeframe Capability**: While defaulting to daily ("D") timeframe, you can switch to any interval (15-minute, 4-hour, weekly, etc.) to match your trading style.
**Band Visualization**: The indicator creates colored bands between the two most recent active levels in each direction - an upper band (purple fill) between the 1st and 2nd unmitigated highs, and a lower band (cyan fill) between the 1st and 2nd unmitigated lows.
**Visual Clarity**: Active unmitigated levels display in full color with customizable line width (default: 2), while mitigated levels fade to 60% transparency, helping you distinguish between current zones and historical references.
## How to Use It
Add the indicator to your chart and observe where unmitigated levels cluster - these zones often act as magnets for institutional order flow. The most recent unmitigated high represents overhead supply/resistance, while the most recent unmitigated low represents underlying demand/support. Traders commonly use these levels for:
- Entry zones when price approaches unmitigated levels with confluent signals
- Stop-loss placement beyond unmitigated levels to avoid institutional sweeps
- Profit targets at the next unmitigated level in the direction of your trade
- Breakout confirmation when price finally mitigates a long-standing level
The colored bands between the 1st and 2nd levels highlight "zones of friction" where price may consolidate or reverse before continuing its trend.
## Settings
**HL interval**: Select your desired timeframe (default: "D" for daily)
**High Line Color**: Color for unmitigated high levels (default: yellow #fff176)
**Low Line Color**: Color for unmitigated low levels (default: cyan #00bcd4)
**Upper Band Fill**: Fill color between 1st and 2nd highs (default: purple #880e4f at 85% transparency)
**Lower Band Fill**: Fill color between 1st and 2nd lows (default: cyan #00bcd4 at 85% transparency)
**Line Width**: Thickness of level lines (default: 2, range: 1-5)

MRX_M7 777//@version=5
indicator("MRX_M7 777 MTF ALERT (jgar)", overlay=true)
// === SOZLAMALAR ===
tfInput = input.timeframe("15", "Qaysi TF")
showZone = input.bool(true, "Zonani ko‘rsat / o‘chirish")
zoneColor = color.new(color.lime, 75)
// === MTF DATA (BITTA QATORDA!) ===
= request.security(syminfo.tickerid, tfInput, )
// === ENGULF ===
engulf = mtfHigh > mtfHigh and mtfLow < mtfLow
// === ZONA ===
zoneHigh = mtfHigh
zoneLow = mtfLow
// === CHARTGA CHIZISH ===
if engulf and showZone
box.new(bar_index - 1, zoneHigh, bar_index, zoneLow, bgcolor = zoneColor, border_color = color.lime)
label.new(bar_index, zoneHigh, "ENGULF " + tfInput, style = label.style_label_down, textcolor = color.white, bgcolor = color.lime)
// === ALERT ===
alertcondition(engulf, title="MTF ENGULF", message="ENGULF " + tfInput + " timeframe da sodir bo‘ldi")

HTF EMA Bias BackgroundThis indicator gives you the cross over points from EMAs on the 15 min chart as a coloured background, you can then go to the 1 min chart to see the overlay. Useful for a higher time frame BIAS.

Custom ORB (Adjustable Time + Alerts)Opening range Breakout for the current day only. Time frame and be adjusted for first 15 min, 30 min, e.g., 9:30 am to 9:45 am or to 10 am, etc. You can add price alerts for high and low. You can also change the color of solid lines.

First Presented FVGSummary: First Presented FVG Indicator
This is a Pine Script v6 TradingView indicator that identifies and visualizes the first Fair Value Gap (FVG) that forms within configurable time windows during a trading session.
What it Does
1. Detects FVGs : Uses the classic 3-candle FVG definition:
- Bullish FVG: When low > high (gap up)
- Bearish FVG: When high < low (gap down)
2. "First Presented" Logic : For each configured time slot, it captures only the first qualifying FVG that forms—subsequent FVGs in that window are ignored.
3. Visual Display :
- Draws a colored box spanning from detection time to session end
- Optional text label showing detection time (e.g., "9:38 Tue FP FVG")
- Optional grade lines at 25%, 50%, and 75% levels within the FVG
Key Configuration
Setting Description
Timeframe Only works on 5-minute charts or lower
Timezone IANA timezone for session times (default: America/New_York)
Session Futures trading hours (default: 1800-1715)
Min FVG Size Minimum gap size in ticks to qualify
4 Time Slots Each with enable toggle, time window, and color
Default Time Slots
Slot 1 (enabled): 09:30-10:30 — lime green
Slot 2 (enabled): 13:30-14:30 — blue
Slot 3 (disabled): 13:00-13:30 — teal
Slot 4 (disabled): 14:15-14:45 — fuchsia
Technical Features
Handles cross-midnight sessions correctly
Resets all drawings at each new session
Skips the first bar of each window to ensure valid 3-candle lookback
Clamps slot windows to session boundaries

QuantLabs Multi Asset Similarity Matrix [V3 Final]The Market is a graph. See the flows:
The QuantLabs MASM is not a standard correlation table. It is an Alpha-Grade Scanner architected to reveal the hidden "hydraulic" relationships between global macro assets in real-time.
Rebuilt from the ground up for Version 3, this engine pushes the absolute limits of the Pine Script™ runtime. It utilizes a proprietary Logarithmic Math Engine, Symmetric Compute Optimization, and a futuristic "Ghost Mode" interface to deliver a 15x15 real-time correlation matrix with zero lag.
Under the Hood: The Quant Architecture
We stripped away standard libraries to build a lean, high-performance engine designed for institutional-grade accuracy.
1. Alpha Math Engine (Logarithmic Returns) Most tools calculate correlation based on Price, which generates spurious signals (e.g., "Everything is correlated in a bull run").
The Solution: Our engine computes Logarithmic Returns (log(close /close )) by default. This measures the correlation of change (Velocity & Vector), not price levels.
The Result: A mathematically rigorous view of statistical relationships that filters out the noise of general market drift.
Dual-Core: Toggle seamlessly between "Alpha Mode" (Log Returns) for verified stats and "Visual Mode" (Price) for trend alignment.
Calculation Modes: Pearson (Standard), Euclidean (Distance), Cosine (Vector), Manhattan (Grid).
2. Symmetric Compute Optimization Calculating a 15x15 matrix requires evaluating 225 unique relationships per bar, which often crashes memory limits.
The Fix: The V3 Engine utilizes Symmetric Logic, recognizing that Correlation(A, B) == Correlation(B, A).
The Gain: By computing only the lower triangle of the matrix and mirroring pointers to the upper triangle, we reduced computational load by 50%, ensuring a lightning-fast data feed even on lower timeframes.
3. Context-Aware "Ghost Mode" The UI is designed for professional traders who need focus, not clutter.
Smart Detection: The matrix automatically detects your current chart's Ticker ID. If you are trading QQQ, the matrix will visually highlight the Nas100 row and column, making them opaque and bright while dimming the rest.
Dynamic Transparency: Irrelevant data ("Noise" < 0.3 correlation) fades into the background. Only significant "Alpha Signals" (> 0.7) glow with full Neon Saturation.
Key Features
Dominant Flow Scanner: The matrix scans all 105 unique pairs every tick and prints the #1 Strongest Correlation at the bottom of the pane (e.g., DOMINANT FLOW: Bitcoin ↔ Nas100 ).
Streak Counter: A "Stubbornness" metric that tracks how many consecutive days a strong correlation has persisted. Instantly identify if a move is a "flash event" or a "structural trend."
Neon Palette: Proprietary color mapping using Electric Blue (+1.0) for lockstep correlation and Deep Red (-1.0) for inverse hedging.
Usage Guide
Placement: Best viewed in a bottom pane (Footer).
Assets: Pre-loaded with the Essential 15 Macro Drivers (Indices, BTC, Gold, Oil, Rates, FX, Key Sectors). Fully editable via settings (Ticker|Name).
Reading the Grid:
🔵 Bright Blue: Assets moving in lockstep (Risk-On).
🔴 Bright Red: Assets moving perfectly opposite (Hedge/Risk-Off).
⚫ Faded/Black: No statistical relationship (Decoupled).
Key Improvements Made:
Formatting: Added clear bullet points and bolding to make it scannable.
Clarity: Clarified the "Logarithmic Returns" section to explain why it matters (Velocity vs. Price Levels).
Tone: Maintained the "high-tech/quant" vibe but removed slightly clunky phrases like "spurious signals" (unless you prefer that academic tone, in which case I left it in as it fits the persona).
Structure: Grouped the "Modes" under the Math Engine for better logic.
Created and designed with love by David James @QuantLabs : )

Monthly High/Low - [JTCAPITAL]Monthly High/Low Probability Table - is a modified way to use historical monthly high and low tracking combined with probabilistic analysis for bullish and bearish months to detect potential patterns in monthly price behavior.
The indicator works by calculating in the following steps:
Variable Declaration
Persistent variables ( var ) are used to store monthly highs, lows, open and close prices, and the days on which highs and lows occurred. Separate arrays track bullish and bearish month statistics for highs and lows ( highBull, lowBull, highBear, lowBear ). Counters ( bullCount, bearCount ) store the number of bullish and bearish months recorded.
New Month Detection
The script detects the start of a new month by comparing the current bar’s month to the previous bar’s month. If a new month is detected, the script proceeds to update statistics for the previous month.
Monthly High/Low Recording and Classification
At the start of each new month, the previous month’s high, low, open, and close are evaluated:
If monthClose > monthOpen , the month is classified as bullish.
If monthClose < monthOpen , the month is classified as bearish.
The arrays ( highBull, lowBull, highBear, lowBear ) are updated at the respective high and low days of the month by incrementing counts, which allows the script to keep track of the frequency of monthly highs and lows occurring on specific days.
Monthly High/Low Tracking
During the month, the script continuously updates monthHigh and monthLow if the current bar’s high exceeds monthHigh or the low is below monthLow . The days on which these highs and lows occur are recorded ( highDay and lowDay ). The monthClose variable is continuously updated to the latest closing price.
Probability Calculation
Once monthly data is accumulated, the script calculates probabilities for each day of the month:
bullHighProb and bullLowProb represent the probability (in percentage) that a bullish month’s high or low occurred on a given day.
bearHighProb and bearLowProb represent the probability for bearish months.
These probabilities are calculated by dividing the count of high or low occurrences on each day by the total number of bullish or bearish months, then multiplying by 100. This probabilistic approach allows traders to see recurring patterns for highs and lows across multiple months.
Gradient Coloring Function
The helper function gradientRelative computes a color gradient between lowColor and highColor based on the relative probability value. Higher probabilities are colored closer to highColor , and lower probabilities closer to lowColor . This visual representation allows for quick identification of the most probable days for highs and lows in bullish or bearish months.
Dynamic Updates
As new bars are processed, the table is updated in real-time with new probabilities reflecting the most recent month’s data. This dynamic behavior ensures that the table remains accurate and responsive to the latest market information.
Buy and Sell Conditions:
This indicator does not provide direct buy or sell signals. Instead, it provides probabilistic information about historical patterns for bullish and bearish months. Traders can use the table to:
Identify days in the month where highs or lows are statistically more likely to occur.
Combine with other trend-following or reversal strategies to optimize entry and exit points.
For example, if a trader notices that bullish month highs frequently occur around day 15, they may plan trades around that period when other indicators align.
Features and Parameters:
Dynamic Probability Table : Updates in real-time as new monthly data becomes available.
Historical Pattern Tracking : Maintains arrays for highs and lows in bullish and bearish months.
Gradient Visualization : Uses color interpolation to quickly highlight higher probability days.
Specifications:
Monthly High/Low Tracking
Tracks the highest and lowest prices within each month. This is the foundation of the probability calculations. It allows traders to understand when significant price events historically occur.
Bullish/Bearish Month Classification
Each month is classified based on the relationship between monthClose and monthOpen . This provides context for the high/low occurrences: whether they happened in bullish or bearish months.
High/Low Occurrence Arrays
Four arrays ( highBull, lowBull, highBear, lowBear ) store the count of high and low occurrences for each day of the month. These arrays are the core of the statistical analysis.
Probability Calculation
Divides the count of occurrences for each day by the total number of months in that category (bullish/bearish). Multiplying by 100 converts this to a percentage probability, giving traders a numerical sense of recurrence.
Real-Time Updates
The table and probabilities are recalculated and refreshed with each new bar. This ensures that traders have the most current information available without manual recalculation.
User-Centric Visualization
By showing probabilities for both bullish and bearish months separately, traders gain a deeper understanding of market tendencies and recurring monthly patterns, which can be leveraged for improved timing and strategy alignment.
Important:
There is a misalign in percentages due to not all months having the same amount of days.

SUPER SPX T.SHere is the professional English description for your indicator. You can use this if you want to save the script in your TradingView library or share it with others.
### **Indicator Name:** `SPX Pro: EMA Crossover with RSI Filter`
### **Description:**
This indicator is specifically optimized for **SPX (S&P 500)** trading, particularly for options traders (CALL/PUT). It combines trend-following moving averages with a momentum filter to identify high-probability entry points.
---
### **Key Features:**
* **Dual EMA Engine:** Uses a **9-period Exponential Moving Average (Fast)** and a **21-period Exponential Moving Average (Slow)**. These are the standard benchmarks for identifying short-term momentum on the SPX.
* **RSI Momentum Filter:** Unlike standard crossover indicators, this script includes a built-in **Relative Strength Index (RSI)** filter.
* **CALL signals** are only generated if the RSI is below 65 (preventing buying at the absolute peak).
* **PUT signals** are only generated if the RSI is above 35 (preventing selling at the absolute bottom).
* **Visual Signals:** * **Green Triangle + "CALL":** Triggered when the 9 EMA crosses above the 21 EMA while the RSI allows for more upside.
* **Red Triangle + "PUT":** Triggered when the 9 EMA crosses below the 21 EMA while the RSI allows for more downside.
* **Clean Interface:** Displays the EMAs clearly on the chart to help identify dynamic support and resistance levels.
---
### **How to Use:**
1. **Timeframe:** Recommended for **5-minute** and **15-minute** charts for day trading.
2. **Confirmation:** Look for the signal to appear after the candle closes to ensure the crossover is confirmed.
3. **Strategy:** This indicator works best when the SPX is trending. During a "sideways" or "choppy" market, the RSI filter will help eliminate many false signals that standard crossovers usually fail to catch.
---
**Next Step:**
Would you like me to add a **"Table"** on the corner of the screen that shows the current RSI value and the trend status (Bullish/Bearish) so you don't have to keep looking at the bottom of the chart?

Trappp's Advanced Multi-Timeframe Trading ToolkitThis comprehensive trading script by Trappp provides a complete market analysis framework with multiple timeframe support and resistance levels. The indicator features:
Key Levels:
· Monthly (light blue dashed) and Weekly (gold dashed) levels for long-term context
· Previous day high/low (yellow) with range display
· Pivot-based support/resistance (pink dashed)
· Premarket levels (blue) for pre-market activity
Intraday Levels:
· 1-minute opening candle (red)
· 5-minute (white), 15-minute (green), and 30-minute (purple) session levels
· All intraday levels extend right throughout the trading day
Technical Features:
· EMA 50/200 cross detection with alert labels
· Candlestick pattern recognition near key levels
· Smart proximity detection using ATR
· Automatic daily/weekly/monthly updates
Trappp's script is designed for traders who need immediate visual reference of critical price levels across multiple timeframes, helping identify potential breakouts, reversals, and pattern-based setups with clear, color-coded visuals for quick decision-making.

AI PRE-MARKET PRO - True/Fake Gap Classification-Version 1.0## **AI PRE-MARKET PRO: QUICK START GUIDE**
This indicator classifies market gaps by comparing the **Current Price** to yesterday’s **High (PDH)**, **Low (PDL)**, and **Close (PDC)**.
### **1. GAP CLASSIFICATIONS**
* **🔥 TRUE GAPS (High Momentum)**
* **True Gap Up:** Price is above PDH. The market is in "Discovery Mode." High probability of trend continuation.
* **True Gap Down:** Price is below PDL. Significant bearish sentiment. High probability of further selling.
* **⚠️ FAKE GAPS (Mean Reversion)**
* **Fake Gap Up:** Above PDC but below PDH. Price is "trapped" in yesterday's value. Often reverts to the Close (PDC).
* **Fake Gap Down:** Below PDC but above PDL. Price is "trapped." Often bounces back toward the Close (PDC).
### **2. TRADING STRATEGY CHEAT SHEET**
| Scenario | Primary Play | Entry Logic |
| --- | --- | --- |
| **True Gap Up** | **Continuation** | Wait for a pullback to **PDH**; buy the hold. |
| **True Gap Down** | **Continuation** | Wait for a rally to **PDL**; short the rejection. |
| **Fake Gap Up** | **Fade/Range** | Short the rejection of **PDH** or **ONH**; target **PDC**. |
| **Fake Gap Down** | **Fade/Range** | Buy the bounce at **PDL** or **ONL**; target **PDC**. |
### **3. CRITICAL LEVELS ON YOUR CHART**
* **PDH / PDL:** The "Line in the Sand." Breaking these turns a Fake Gap into a True Gap.
* **ONH / ONL:** Overnight High/Low. These are your immediate support/resistance targets for the first 30 minutes of trading.
* **PDC:** Previous Day Close. The "Magnet." If the market doesn't trend, it usually returns here.
### **4. HOW TO READ THE AI TABLES**
* **Left Table:** Shows real-time distance (RT Δ) to key levels and whether they have been hit yet (**Mitigated**).
* **Bottom Tables:** Provide a probability-based "Game Plan" and specific execution rules (e.g., "Wait for 15-minute confirmation").
---
**Next Step:** Would you like me to show you how to set up an alert for when the price crosses the **PDH** or **PDL** to catch a True Gap breakout?

HSI Long & Short: BG + EMA330Strategy: HSI 5-min mean-reversion with EMA10/20 crossover and EMA330 filter.
Background green (EMA10 > EMA20) or red (EMA10 < EMA20).
Long entry: Background turns green AND price below EMA330.
Short entry: Background turns red AND price above EMA330.
Exit long: Background turns red.
Exit short: Background turns green.
No new entries 15:01–16:00 HKT.
Reverses position on signals; 100% equity per trade.

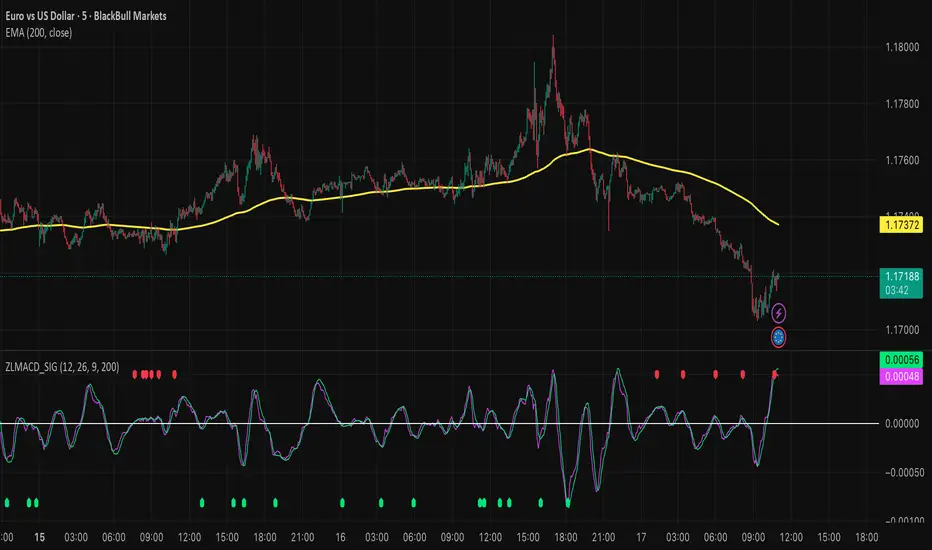
Zero Lag MACD and EMA 200 with SignalsZero Lag MACD with EMA Filter and Smart Signals
This indicator is an enhanced version of the traditional MACD that uses Zero Lag EMA calculations to provide faster and more responsive signals for scalping and day trading.
Key Features:
🎯 Zero Lag Technology - Uses double-smoothed EMA calculations to eliminate lag and provide earlier signals compared to standard MACD
📊 Clean Visualization - Displays histogram with MACD and Signal lines for clear trend analysis
🔍 Smart Signal Logic - Only shows valid trading signals based on strict conditions:
Buy Signal (Green dot at bottom): Triggers when price is above 200 EMA AND MACD crosses Signal line from below AND crossover occurs below zero line
Sell Signal (Red dot at top): Triggers when price is below 200 EMA AND MACD crosses Signal line from above AND crossover occurs above zero line
🔔 Built-in Alerts - Easy alert setup for both buy and sell signals so you never miss a trading opportunity
📈 200 EMA Filter - Incorporates trend filter to avoid counter-trend trades and improve signal quality
⚙️ Fully Customizable - Adjust all parameters:
Fast EMA Length (default: 12)
Slow EMA Length (default: 26)
Signal Length (default: 9)
EMA Filter Length (default: 200)
How to Use:
-Add the indicator to your chart
-Look for green dots (buy signals) when price is in an uptrend above 200 EMA
-Look for red dots (sell signals) when price is in a downtrend below 200 EMA
-Set up alerts by clicking "Create Alert" and selecting "Buy Signal" or "Sell Signal"
-Use signals in conjunction with your trading strategy and risk management
Best Practices:
-Works best on 1-15 minute timeframes for scalping
-Combine with support/resistance levels for confirmation
-Use proper stop-loss and take-profit levels
-Not all signals will be profitable - use proper risk management
-Signals are filtered to reduce noise and false entries
Color Scheme:
Histogram: Red (bearish) / Cyan (bullish)
MACD Line: Fuchsia/Pink
Signal Line: Lime/Green
Buy Signal: Green dot (bottom)
Sell Signal: Red dot (top)
This indicator is perfect for traders who want a cleaner, faster-responding MACD with built-in trend filtering and clear entry signals. Free to use and customize!
Gold Smart Scalper AI V21. The "Red Zone" (News Management)
The strategy logic does not "know" when the Federal Reserve is speaking.
Rule: Disable the strategy or stop taking signals 15 minutes before and after high-impact news (CPI, NFP, FOMC).
Why: During these times, Gold can move $30 in seconds. Slippage will cause your $1.50 Stop Loss to execute much further away, leading to massive drawdown.
2. Session Selection
Gold "Scalping" requires high liquidity and tight spreads.
Discretionary Filter: Only trade during the London/New York overlap (13:00 – 17:00 UTC).
Avoid: The late Asian session or Sunday market open. Spreads often widen to $0.50–$1.00, meaning you are already down 30-50% of your Stop Loss the moment you enter.
3. Market "Mood" (Trend vs. Range)
Trend Context: If the 50 EMA (the White line) is completely flat, the market is in a "Bracket." In this state, EMA crossovers generate many false signals.
The Adjustment: Discretionary traders wait for the 50 EMA to show a clear slope (up or down) before trusting the 9/21 crossover signals.

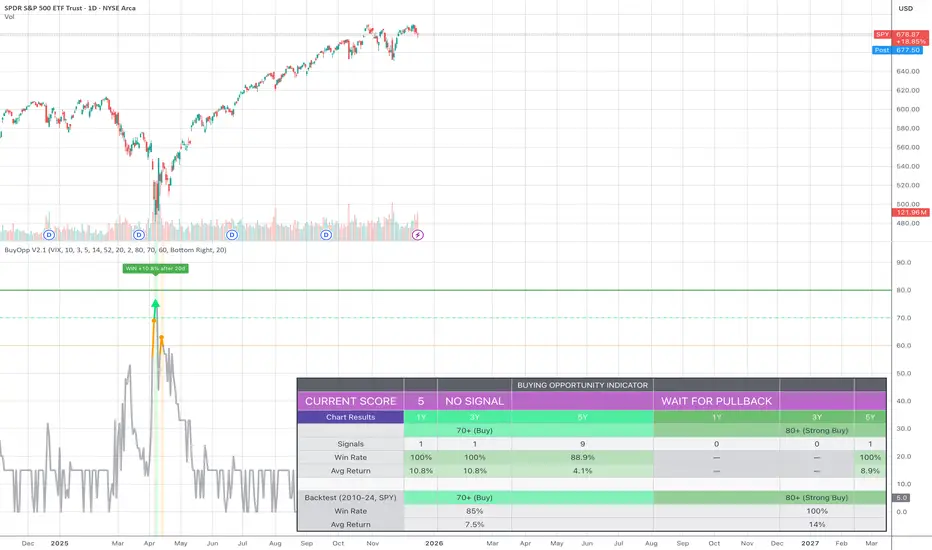
Buying Opportunity Score V2.1Overview
A composite scoring system (0-100) that identifies high-probability buying opportunities during market pullbacks. Validated through backtesting on SPY from 2010-2024.
How It Works
The indicator combines multiple fear and oversold signals into a single actionable score. When fear is elevated and the market is oversold, the score rises. Higher scores historically correlate with better forward returns.
Scoring Components
VIX Level (30 pts) - Market fear gauge
Drawdown (30 pts) - Distance from 52-week high
RSI 14 (12 pts) - Oversold confirmation
Bollinger Band (13 pts) - Statistical extreme
VIX Timing (15 pts) - Bonus when VIX declining from peak
Signal Levels
80+ = STRONG BUY (high conviction)
70-79 = BUY (consider entry)
60-69 = WATCH (monitor closely)
Below 60 = No signal
Backtest Results (SPY, 2010-2024)
70+ Signals: 85% win rate, 7.5% average 20-day return
80+ Signals: 100% win rate, 14% average 20-day return
Features
Statistics table showing 1Y, 3Y, 5Y rolling performance
Signal markers (green triangles) on buy signals
Outcome labels showing WIN/LOSS after measurement period
Multiple alert options
Works on SPY, QQQ, IWM (use VIX for all)
How To Use
Add to SPY, QQQ, or IWM (daily timeframe)
Wait for score to reach 70+ or 80+
Green triangle marks signal day
Check statistics table for recent performance
Set alerts for notifications
Alerts Available
STRONG BUY Signal (80+)
BUY Signal (70+)
Moderate Signal (60+)
Score Crossed 80/70
Score Dropped Below 70
Important Notes
Designed for daily timeframe on broad market ETFs
Signals confirm at end of day (bar close)
Statistics table shows rolling windows based on loaded data
Past performance does not guarantee future results

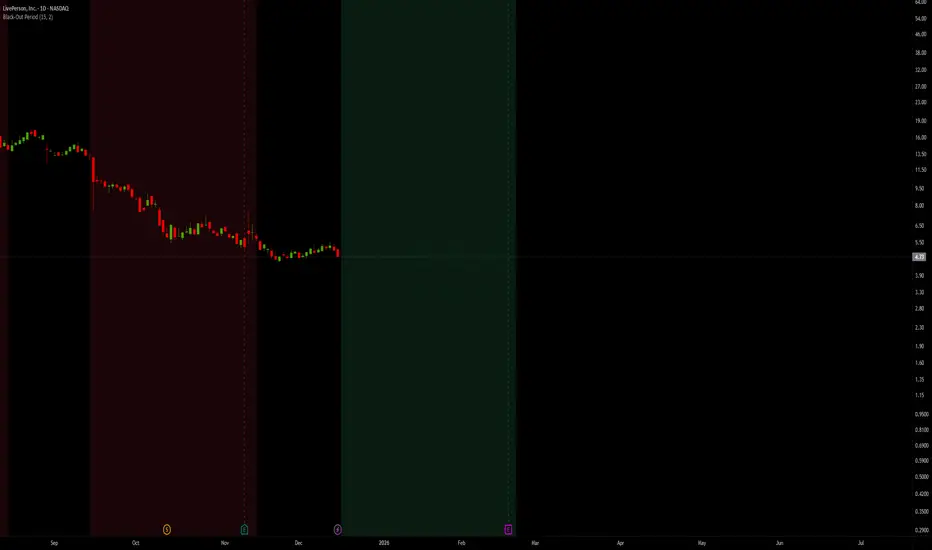
Black-Out PeriodYou'll need to input the black-out logic of the company you are analyzing manually. For example Liveperson, Insider trading and disclosure policy can be found here:
www.sec.gov
Under paragraph nr 12 we find:
"12.Black-Out Period. During the end of each fiscal quarter and until public disclosure of the financial results for that quarter, persons subject to this Policy may possess material nonpublic information about the expected financial results for the quarter. Even if you don’t actually possess any such information, any trades by you during that period may give the appearance that you are trading on inside information. Accordingly, the Company has designated a regularly-scheduled quarterly “black-out period” on trading beginning with the close of business on the 15th day of the last month of each fiscal quarter (or the close of business on the last day on which The Nasdaq Global Select Market is open prior to such 15th day, in the event that the Nasdaq Global Select Market is not open on such 15th day) and ending at the close of the second full trading day (day on which the relevant stock market is open) after public disclosure of the quarter’s financial results."
So we put in the values "15" and "2"
Note that other rules than those specific dates around earnings applies, and not all employees are subject to the same rules.
CS Trendline ProTitle: CS Trendline Pro
Description:
CS Trendline Pro is a comprehensive scalping and day-trading system designed to filter out noise and identify high-probability breakout setups. It combines the structural precision of Fractal Trendlines with a robust Dual-EMA Filter, visualized through an intuitive "Traffic Light" color system.
This tool is specifically engineered for traders who want to trade Trendline Breakouts but need a safety mechanism to avoid false signals (fakeouts) and counter-trend traps.
🚦 How the "Traffic Light" Logic Works
The core feature of this script is the dynamic coloring of the candles, which acts as a visual filter for your entries:
🟢 GREEN Zone (Safe Buy):
Condition: A Bullish Trendline Breakout has occurred AND the price is holding ABOVE the EMA 30 (Yellow Line).
Meaning: Momentum is bullish, and you are in a safe zone to look for Long entries.
🔴 RED Zone (Safe Sell):
Condition: A Bearish Trendline Breakout has occurred AND the price is holding BELOW the EMA 30 (Yellow Line).
Meaning: Momentum is bearish, and you are in a safe zone to look for Short entries.
⚪ GRAY Zone (No Trade / Wait):
Condition: A breakout occurred, but the price is on the "wrong side" of the EMA 30.
Meaning: Indecision. The market structure is conflicting with the immediate momentum. It is recommended to stay out until the color changes.
🛠️ Key Features
** automated Trendlines:** Automatically draws Support and Resistance dynamic trendlines based on pivot points (LuxAlgo engine).
Dual EMA Filter:
EMA 30 (Yellow): Acts as the immediate "Safe Zone" filter.
EMA 200 (White): Displays the macro trend. (Pro Tip: Only take Green signals if price is above the White line).
CS-BUY / CS-SELL Labels: Clear text markers appear exactly when a valid breakout occurs.
Customizable: Adjustable sensitivity (Length), EMA periods, and Slope calculation methods (ATR, Stdev, Linreg).
📉 How to Trade with CS Trendline Pro
For Scalping (5m / 15m):
Identify the Main Trend: Look at the White EMA (200).
If Price > EMA 200 → Focus on BUY signals.
If Price < EMA 200 → Focus on SELL signals.
Wait for the Signal:
Wait for the candle to turn Teal (Green) or Red.
Ensure the candle closes with the new color.
Risk Management:
Place Stop Loss below the recent swing low (for buys) or above the swing high (for sells).
Target a 1.5 Risk/Reward ratio or trail your stop using the EMA 30.
⚠️ Important Note on Backpainting
This indicator uses pivot points to draw trendlines. By nature, a pivot point can only be confirmed after a few bars have passed (Lag).
Backpaint Setting (Default ON): Keeps your historical chart clean by connecting the exact pivot points in the past.
Real-Time Behavior: In live trading, the trendline and signal will appear once the pivot is confirmed (based on your 'Length' setting). This is normal behavior for any trendline script.
Settings Recommended:
5-Minute Chart: Length 10 or 14.
15-Minute Chart: Length 14.
Enjoy trading with precision! ~ CS Trading
