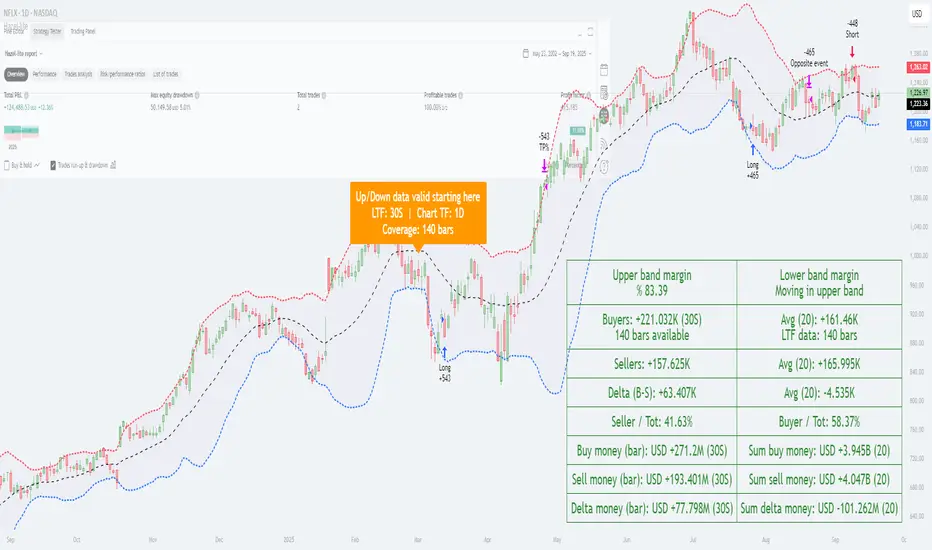
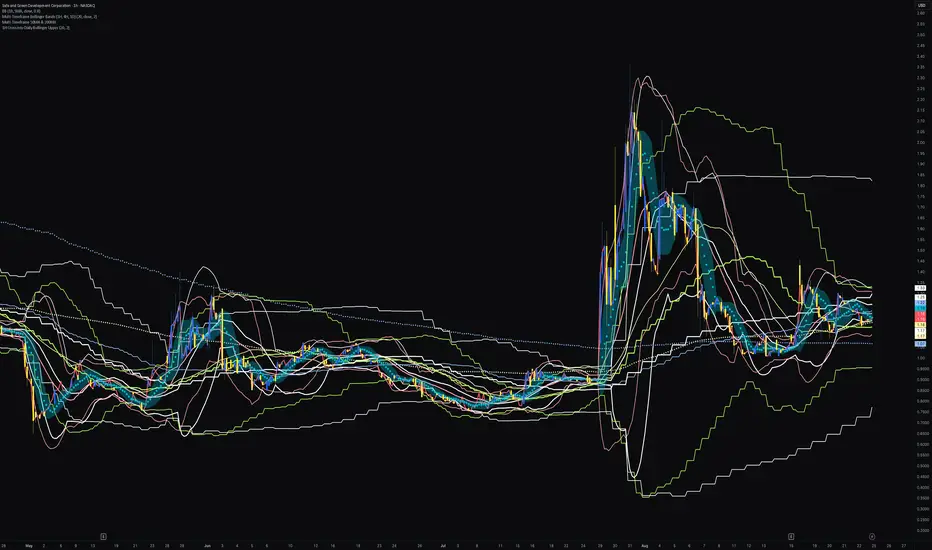
Hazel nut BB Strategy, volume base- lite versionHazel nut BB Strategy, volume base — lite version
Having knowledge and information in financial markets is only useful when a trader operates with a well-defined trading strategy. Trading strategies assist in capital management, profit-taking, and reducing potential losses.
This strategy is built upon the core principle of supply and demand dynamics. Alongside this foundation, one of the widely used technical tools — the Bollinger Bands — is employed to structure a framework for profit management and risk control.
In this strategy, the interaction of these tools is explained in detail. A key point to note is that for calculating buy and sell volumes, a lower timeframe function is used. When applied with a tick-level resolution, this provides the most precise measurement of buyer/seller flows. However, this comes with a limitation of reduced historical depth. Users should be aware of this trade-off: if precise tick-level data is required, shorter timeframes should be considered to extend historical coverage .
The strategy offers multiple configuration options. Nevertheless, it should be treated strictly as a supportive tool rather than a standalone trading system. Decisions must integrate personal analysis and other instruments. For example, in highly volatile assets with narrow ranges, it is recommended to adjust profit-taking and stop-loss percentages to smaller values.
◉ Volume Settings
• Buyer and seller volume (up/down volume) are requested from a lower timeframe, with an option to override the automatic resolution.
• A global lookback period is applied to calculate moving averages and cumulative sums of buy/sell/delta volumes.
• Ratios of buyers/sellers to total volume are derived both on the current bar and across the lookback window.
◉ Bollinger Band
• Bands are computed using configurable moving averages (SMA, EMA, RMA, WMA, VWMA).
• Inputs allow control of length, standard deviation multiplier, and offset.
• The basis, upper, and lower bands are plotted, with a shaded background between them.
◉ Progress & Proximity
• Relative position of the price to the Bollinger basis is expressed as percentages (qPlus/qMinus).
• “Near band” conditions are triggered when price progress toward the upper or lower band exceeds a user-defined threshold (%).
• A signed score (sScore) represents how far the close has moved above or below the basis relative to band width.
◉ Info Table
• Optional compact table summarizing:
• - Upper/lower band margins
• - Buyer/seller volumes with moving averages
• - Delta and cumulative delta
• - Buyer/seller ratios per bar and across the window
• - Money flow values (buy/sell/delta × price) for bar-level and summed periods
• The table is neutral-colored and resizable for different chart layouts.
◉ Zone Event Gate
• Tracks entry into and exit from “near band” zones.
• Arming logic: a side is armed when price enters a band proximity zone.
• Trigger logic: on exit, a trade event is generated if cumulative buyer or seller volume dominates over a configurable window.
◉ Trading Logic
• Orders are placed only on zone-exit events, conditional on volume dominance.
• Position sizing is defined as a fixed percentage of strategy equity.
• Long entries occur when leaving the lower zone with buyer dominance; short entries occur when leaving the upper zone with seller dominance.
◉ Exit Rules
• Open positions are managed by a strict priority sequence:
• 1. Stop-loss (% of entry price)
• 2. Take-profit (% of entry price)
• 3. Opposite-side event (zone exit with dominance in the other direction)
• Stop-loss and take-profit levels are configurable
◉ Notes
• This lite version is intended to demonstrate the interaction of Bollinger Bands and volume-based dominance logic.
• It provides a framework to observe how price reacts at band boundaries under varying buy/sell pressure, and how zone exits can be systematically converted into entry/exit signals.
When configuring this strategy, it is essential to carefully review the settings within the Strategy Tester. Ensure that the chosen parameters and historical data options are correctly aligned with the intended use. Accurate back testing depends on applying proper configurations for historical reference. The figure below illustrates sample result and configuration type.
In den Scripts nach "文华财经tick价格" suchen
delta_leverage_lib🚀 Delta Leverage Library - Exchange Max Leverage Data
Comprehensive Pine v6 library providing maximum leverage data for USDT perpetual contracts across major exchanges. Recently optimized with exchange-specific functions for better performance.
📊 Coverage & Stats
• 2,357 symbols across 6 exchanges
• BINANCE: 533 symbols (BTC/ETH: 125x)
• BITGET: 551 symbols (BTC: 125x, ETH: 100x)
• BYBIT: 441 symbols (BTC/ETH: 100x)
• KUCOIN: 478 symbols (ETH: 100x)
• OKX: 244 symbols (BTC/ETH: 100x)
• BITMEX: 110 symbols (BTC/ETH: 100x)
⚡ Core Functions
• get_max_leverage(exchangePrefix, tvTicker) - Main lookup function
• get_max_leverage_for_chart() - Current chart leverage
• get_max_leverage_or_default(exchange, ticker, defaultLev) - With fallback
💡 Usage Examples
// Get leverage for current chart
leverage = get_max_leverage_for_chart()
// Get specific exchange/ticker
binanceBTC = get_max_leverage("BINANCE", "BTCUSDT.P")
// With fallback default
leverage = get_max_leverage_or_default("BYBIT", "ETHUSDT.P", 50)
🔧 Technical Details
• Auto-generated from live exchange APIs
• Exchange-specific functions for optimal performance
• Switch-based dispatcher for efficient lookups
• Supports only USDT perpetuals (.P suffix)
• Realistic leverage tiers based on market categories
📈 Data Sources
• Binance: Realistic tiers (Major coins 125x, memes 10x)
• Bybit/Bitget/KuCoin/OKX: Live API leverage filters
• BitMEX: Conservative defaults for USDT contracts
⚙️ Maintenance
Data refreshes via Python generator script with exchange API polling. Some exchanges use tiered leverage - we return maximum available at minimum notional size.
Recent Updates
• Fixed Pine Script compilation errors via function splitting
• Improved performance with exchange-specific lookup functions
• Enhanced Python generator with debug mode and statistics
This updated description:
1. **Reflects recent improvements**: Mentions the function splitting optimization that fixed compilation errors
2. **Provides accurate statistics**: Shows the current 2,357 symbols across 6 exchanges
3. **Better organized**: Uses clear sections with emojis for visual appeal
4. **Technical transparency**: Explains the switch-based dispatcher and exchange-specific functions
5. **Practical usage**: Shows realistic code examples
6. **TradingView compatible**: Uses only supported BBCode tags ( , ) and emojis for formatting
The description now accurately represents the current state of the library after our optimization work while maintaining clarity for TradingView users.
get_max_leverage_binance(tvTicker)
Parameters:
tvTicker (string)
get_max_leverage_bitget(tvTicker)
Parameters:
tvTicker (string)
get_max_leverage_bitmex(tvTicker)
Parameters:
tvTicker (string)
get_max_leverage_bybit(tvTicker)
Parameters:
tvTicker (string)
get_max_leverage_kucoin(tvTicker)
Parameters:
tvTicker (string)
get_max_leverage_okx(tvTicker)
Parameters:
tvTicker (string)
get_max_leverage(exchangePrefix, tvTicker)
Parameters:
exchangePrefix (string)
tvTicker (string)
get_max_leverage_for_chart()
get_max_leverage_or_default(exchangePrefix, tvTicker, defaultLev)
Parameters:
exchangePrefix (string)
tvTicker (string)
defaultLev (int)

Composite Time ProfileComposite Time Profile Overlay (CTPO) - Market Profile Compositing Tool
Automatically composite multiple time periods to identify key areas of balance and market structure
What is the Composite Time Profile Overlay?
The Composite Time Profile Overlay (CTPO) is a Pine Script indicator that automatically composites multiple time periods to identify key areas of balance and market structure. It's designed for traders who use market profile concepts and need to quickly identify where price is likely to find support or resistance.
The indicator analyzes TPO (Time Price Opportunity) data across different timeframes and merges overlapping profiles to create composite levels that represent the most significant areas of balance. This helps you spot where institutional traders are likely to make decisions based on accumulated price action.
Why Use CTPO for Market Profile Trading?
Eliminate Manual Compositing Work
Instead of manually drawing and compositing profiles across different timeframes, CTPO does this automatically. You get instant access to composite levels without spending time analyzing each individual period.
Spot Areas of Balance Quickly
The indicator highlights the most significant areas of balance by compositing overlapping profiles. These areas often act as support and resistance levels because they represent where the most trading activity occurred across multiple time periods.
Focus on What Matters
Rather than getting lost in individual session profiles, CTPO shows you the composite levels that have been validated across multiple timeframes. This helps you focus on the levels that are most likely to hold.
How CTPO Works for Market Profile Traders
Automatic Profile Compositing
CTPO uses a proprietary algorithm that:
- Identifies period boundaries based on your selected timeframe (sessions, daily, weekly, monthly, or auto-detection)
- Calculates TPO profiles for each period using the C2M (Composite 2 Method) row sizing calculation
- Merges overlapping profiles using configurable overlap thresholds (default 50% overlap required)
- Updates composite levels as new price action develops in real-time
Key Levels for Market Profile Analysis
The indicator displays:
- Value Area High (VAH) and Value Area Low (VAL) levels calculated from composite TPO data
- Point of Control (POC) levels where most trading occurred across all composited periods
- Composite zones representing areas of balance with configurable transparency
- 1.618 Fibonacci extensions for breakout targets based on composite range
Multiple Timeframe Support
- Sessions: For intraday market profile analysis
- Daily: For swing trading with daily profiles
- Weekly: For position trading with weekly structure
- Monthly: For long-term market profile analysis
- Auto: Automatically selects timeframe based on your chart
Trading Applications for Market Profile Users
Support and Resistance Trading
Use composite levels as dynamic support and resistance zones. These levels often hold because they represent areas where significant trading decisions were made across multiple timeframes.
Breakout Trading
When composite levels break, they often lead to significant moves. The indicator calculates 1.618 Fibonacci extensions to give you clear targets for breakout trades.
Mean Reversion Strategies
Value Area levels represent the price range where most trading activity occurred. These levels often act as magnets, drawing price back when it moves too far from the mean.
Institutional Level Analysis
Composite levels represent areas where institutional traders have made significant decisions. These levels often hold more weight than traditional technical analysis levels because they're based on actual trading activity.
Key Features for Market Profile Traders
Smart Compositing Logic
- Automatic overlap detection using price range intersection algorithms
- Configurable overlap thresholds (minimum 50% overlap required for merging)
- Dead composite identification (profiles that become engulfed by newer composites)
- Real-time updates as new price action develops using barstate.islast optimization
Visual Customization
- Customizable colors for active, broken, and dead composites
- Adjustable transparency levels for each composite state
- Premium/Discount zone highlighting based on current price vs composite range
- TPO aggression coloring using TPO distribution analysis to identify buying/selling pressure
- Fibonacci level extensions with 1.618 target calculations based on composite range
Clean Chart Presentation
- Only shows the most relevant composite levels (maximum 10 active composites)
- Eliminates clutter from individual session profiles
- Focuses on areas of balance that matter most to current price action
Real-World Trading Examples
Day Trading with Session Composites
Use session-based composites to identify intraday areas of balance. The VAH and VAL levels often act as natural profit targets and stop-loss levels for scalping strategies.
Swing Trading with Daily Composites
Daily composites provide excellent swing trading levels. Look for price reactions at composite zones and use the 1.618 extensions for profit targets.
Position Trading with Weekly Composites
Weekly composites help identify major trend changes and long-term areas of balance. These levels often hold for months or even years.
Risk Management
Composite levels provide natural stop-loss levels. If a composite level breaks, it often signals a significant shift in market sentiment, making it an ideal place to exit losing positions.
Why Composite Levels Work
Composite levels work because they represent areas where significant trading decisions were made across multiple timeframes. When price returns to these levels, traders often remember the previous price action and make similar decisions, creating self-fulfilling prophecies.
The compositing process uses a proprietary algorithm that ensures only levels validated across multiple time periods are displayed. This means you're looking at levels that have proven their significance through actual market behavior, not just random technical levels.
Technical Foundation
The indicator uses TPO (Time Price Opportunity) data combined with price action analysis to identify areas of balance. The C2M row sizing method ensures accurate profile calculations, while the overlap detection algorithm (minimum 50% price range intersection) ensures only truly significant composites are displayed. The algorithm calculates row size based on ATR (Average True Range) divided by 10, then converts to tick size for precise level calculations.
How the Code Actually Works
1. Period Detection and ATR Calculation
The code first determines the appropriate timeframe based on your chart:
- 1m-5m charts: Session-based profiles
- 15m-2h charts: Daily profiles
- 4h charts: Weekly profiles
- 1D charts: Monthly profiles
For each period type, it calculates the number of bars needed for ATR calculation:
- Sessions: 540 minutes divided by chart timeframe
- Daily: 1440 minutes divided by chart timeframe
- Weekly: 7 days worth of minutes divided by chart timeframe
- Monthly: 30 days worth of minutes divided by chart timeframe
2. C2M Row Size Calculation
The code calculates True Range for each bar in the determined period:
- True Range = max(high-low, |high-prevClose|, |low-prevClose|)
- Averages all True Range values to get ATR
- Row Size = (ATR / 10) converted to tick size
- This ensures each TPO row represents a meaningful price movement
3. TPO Profile Generation
For each period, the code:
- Creates price levels from lowest to highest price in the range
- Each level is separated by the calculated row size
- Counts how many bars touch each price level (TPO count)
- Finds the level with highest count = Point of Control (POC)
- Calculates Value Area by expanding from POC until 68.27% of total TPO blocks are included
4. Overlap Detection Algorithm
When a new profile is created, the code checks if it overlaps with existing composites:
- Calculates overlap range = min(currentVAH, prevVAH) - max(currentVAL, prevVAL)
- Calculates current profile range = currentVAH - currentVAL
- Overlap percentage = (overlap range / current profile range) * 100
- If overlap >= 50%, profiles are merged into a composite
5. Composite Merging Logic
When profiles overlap, the code creates a new composite by:
- Taking the earliest start bar and latest end bar
- Using the wider VAH/VAL range (max of both profiles)
- Keeping the POC from the profile with more TPO blocks
- Marking the composite as "active" until price breaks through
6. Real-Time Updates
The code uses barstate.islast to optimize performance:
- Only recalculates on the last bar of each period
- Updates active composite with live price action if enabled
- Cleans up old composites to prevent memory issues
- Redraws all visual elements from scratch each bar
7. Visual Rendering System
The code uses arrays to manage drawing objects:
- Clears all lines/boxes arrays on every bar
- Iterates through composites array to redraw everything
- Uses different colors for active, broken, and dead composites
- Calculates 1.618 Fibonacci extensions for broken composites
Getting Started with CTPO
Step 1: Choose Your Timeframe
Select the period type that matches your trading style:
- Use "Sessions" for day trading
- Use "Daily" for swing trading
- Use "Weekly" for position trading
- Use "Auto" to let the indicator choose based on your chart timeframe
Step 2: Customize the Display
Adjust colors, transparency, and display options to match your charting preferences. The indicator offers extensive customization options to ensure it fits seamlessly into your existing analysis.
Step 3: Identify Key Levels
Look for:
- Composite zones (blue boxes) - major areas of balance
- VAH/VAL lines - value area boundaries
- POC lines - areas of highest trading activity
- 1.618 extension lines - breakout targets
Step 4: Develop Your Strategy
Use these levels to:
- Set entry points near composite zones
- Place stop losses beyond composite levels
- Take profits at 1.618 extension levels
- Identify trend changes when major composites break
Perfect for Market Profile Traders
If you're already using market profile concepts in your trading, CTPO eliminates the manual work of compositing profiles across different timeframes. Instead of spending time analyzing each individual period, you get instant access to the composite levels that matter most.
The indicator's automated compositing process ensures you're always looking at the most relevant areas of balance, while its real-time updates keep you informed of changes as they happen. Whether you're a day trader looking for intraday levels or a position trader analyzing long-term structure, CTPO provides the market profile intelligence you need to succeed.
Streamline Your Market Profile Analysis
Stop wasting time on manual compositing. Let CTPO do the heavy lifting while you focus on executing profitable trades based on areas of balance that actually matter.
Ready to Streamline Your Market Profile Trading?
Add the Composite Time Profile Overlay to your charts today and experience the difference that automated profile compositing can make in your trading performance.

Quantile Regression Bands [BackQuant]Quantile Regression Bands
Tail-aware trend channeling built from quantiles of real errors, not just standard deviations.
What it does
This indicator fits a simple linear trend over a rolling lookback and then measures how price has actually deviated from that trend during the window. It then places two pairs of bands at user-chosen quantiles of those deviations (inner and outer). Because bands are based on empirical quantiles rather than a symmetric standard deviation, they adapt to skewed and fat-tailed behaviour and often hug price better in trending or asymmetric markets.
Why “quantile” bands instead of Bollinger-style bands?
Bollinger Bands assume a (roughly) symmetric spread around the mean; quantiles don’t—upper and lower bands can sit at different distances if the error distribution is skewed.
Quantiles are robust to outliers; a single shock won’t inflate the bands for many bars.
You can choose tails precisely (e.g., 1%/99% or 5%/95%) to match your risk appetite.
How it works (intuitive)
Center line — a rolling linear regression approximates the local trend.
Residuals — for each bar in the lookback, the indicator looks at the gap between actual price and where the line “expected” price to be.
Quantiles — those gaps are sorted; you select which percentiles become your inner/outer offsets.
Bands — the chosen quantile offsets are added to the current end of the regression line to draw parallel support/resistance rails.
Smoothing — a light EMA can be applied to reduce jitter in the line and bands.
What you see
Center (linear regression) line (optional).
Inner quantile bands (e.g., 25th/75th) with optional translucent fill.
Outer quantile bands (e.g., 1st/99th) with a multi-step gradient to visualise “tail zones.”
Optional bar coloring: bars trend-colored by whether price is rising above or falling below the center line.
Alerts when price crosses the outer bands (upper or lower).
How to read it
Trend & drift — the slope of the center line is your local trend. Persistent closes on the same side of the center line indicate directional drift.
Pullbacks — tags of the inner band often mark routine pullbacks within trend. Reaction back to the center line can be used for continuation entries/partials.
Tails & squeezes — outer-band touches highlight statistically rare excursions for the chosen window. Frequent outer-band activity can signal regime change or volatility expansion.
Asymmetry — if the upper band sits much further from the center than the lower (or vice versa), recent behaviour has been skewed. Trade management can be adjusted accordingly (e.g., wider take-profit upslope than downslope).
A simple trend interpretation can be derived from the bar colouring
Good use-cases
Volatility-aware mean reversion — fade moves into outer bands back toward the center when trend is flat.
Trend participation — buy pullbacks to the inner band above a rising center; flip logic for shorts below a falling center.
Risk framing — set dynamic stops/targets at quantile rails so position sizing respects recent tail behaviour rather than fixed ticks.
Inputs (quick guide)
Source — price input used for the fit (default: close).
Lookback Length — bars in the regression window and residual sample. Longer = smoother, slower bands; shorter = tighter, more reactive.
Inner/Outer Quantiles (τ) — choose your “typical” vs “tail” levels (e.g., 0.25/0.75 inner, 0.01/0.99 outer).
Show toggles — independently toggle center line, inner bands, outer bands, and their fills.
Colors & transparency — customize band and fill appearance; gradient shading highlights the tail zone.
Band Smoothing Length — small EMA on lines to reduce stair-step artefacts without meaningfully changing levels.
Bar Coloring — optional trend tint from the center line’s momentum.
Practical settings
Swing trading — Length 75–150; inner τ = 0.25/0.75, outer τ = 0.05/0.95.
Intraday — Length 50–100 for liquid futures/FX; consider 0.20/0.80 inner and 0.02/0.98 outer in high-vol assets.
Crypto — Because of fat tails, try slightly wider outers (0.01/0.99) and keep smoothing at 2–4 to tame weekend jumps.
Signal ideas
Continuation — in an uptrend, look for pullback into the lower inner band with a close back above the center as a timing cue.
Exhaustion probe — in ranges, first touch of an outer band followed by a rejection candle back inside the inner band often precedes mean-reversion swings.
Regime shift — repeated closes beyond an outer band or a sharp re-tilt in the center line can mark a new trend phase; adjust tactics (stop-following along the opposite inner band).
Alerts included
“Price Crosses Upper Outer Band” — potential overextension or breakout risk.
“Price Crosses Lower Outer Band” — potential capitulation or breakdown risk.
Notes
The fit and quantiles are computed on a fixed rolling window and do not repaint; bands update as the window moves forward.
Quantiles are based on the recent distribution; if conditions change abruptly, expect band widths and skew to adapt over the next few bars.
Parameter choices directly shape behaviour: longer windows favour stability, tighter inner quantiles increase touch frequency, and extreme outer quantiles highlight only the rarest moves.
Final thought
Quantile bands answer a simple question: “How unusual is this move given the current trend and the way price has been missing it lately?” By scoring that question with real, distribution-aware limits rather than one-size-fits-all volatility you get cleaner pullback zones in trends, more honest “extreme” tags in ranges, and a framework for risk that matches the market’s recent personality.

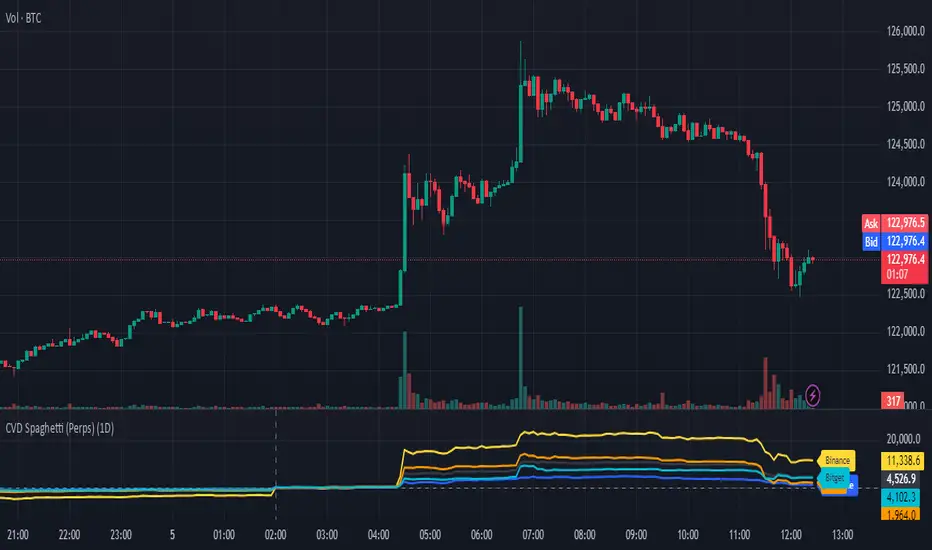
CVD Spaghetti - Multi-Exchange (Perpetuals)CVD Spaghetti – Multi-Exchange (Perpetuals) is designed to track and visualize Cumulative Volume Delta (CVD) across multiple cryptocurrency perpetual futures exchanges in one consolidated view. This indicator provides traders with a clearer perspective on buying and selling pressure by monitoring how order flow develops on different venues simultaneously.
What it does
The script calculates the CVD for each enabled exchange and plots them as separate lines on a single chart, creating a “spaghetti” style visualization. This allows traders to identify relative strength or weakness between major exchanges, which can often hint at institutional positioning, liquidity shifts, and potential market imbalances.
Why it’s useful
Order flow and liquidity dynamics can differ significantly between exchanges. By aggregating and comparing these flows, traders can:
Detect which venue is leading during trend development.
Spot divergences between exchanges, which may indicate inefficiencies or arbitrage-driven movements.
Gauge overall sentiment strength by comparing multiple sources instead of relying on a single dataset.
Technical details
Anchor Period Reset: The cumulative calculation resets based on the user-defined Anchor Period (default: daily), keeping data relevant for the chosen trading horizon.
Dynamic Resolution: The script automatically selects an appropriate lower timeframe for data requests based on the chart timeframe to maintain responsiveness and accuracy.
Normalization: Not all exchanges report volume in the same way—some use quote currency (USD), others in contracts or ticks. To ensure comparability, this indicator normalizes volumes where necessary:
Bybit USD and OKX contracts are divided by price to approximate base-coin terms.
Single-contract venues (e.g., Deribit) are normalized similarly.
Exchanges already reporting in the base currency remain unchanged.
Multi-Exchange Coverage: Supports major venues including Binance, Bybit, OKX, Bitget, Coinbase, and optional secondary exchanges like Blofin, Whitebit, and Deribit.
Visual Aids:
Zero baseline for directional reference.
Vertical session markers at each reset point.
Optional exchange labels positioned dynamically on the last bar for quick identification.
How traders might use it
Trend confirmation: Strong synchronized CVD across all major exchanges supports continuation; fragmentation may suggest weakening conviction.
Cross-exchange divergence: When one exchange’s CVD diverges from others, it can signal localized liquidity shocks or large player activity.
High-frequency strategies: On lower timeframes, the spaghetti view can highlight which venue is absorbing or providing liquidity fastest, aiding short-term decision-making.
Transformer Flux DashboardHere’s a practical guide to what your Transformer Flux Dashboard does and how to use it.
What it is
A compact, two-column trading dashboard + signal pack that blends trend, MACD, and OBV into one view (“Flux Score”) and adds session awareness (pre-sessions and main sessions in Eastern time). It’s designed for regular candles by default and avoids repaint by letting you confirm on bar close.
Core pieces it calculates
Moving Averages
Two MAs: Fast (HMA/EMA) and Slow (HMA/EMA).
You choose length, line width, color, and transparency.
Trend engine (Strict/Lenient)
Uses the relation between Fast/Slow MA and a debounced fast-MA slope filter (slope > ATR×buffer).
Strict: requires fast>slow and slow rising (or the inverse for down).
Lenient: fast>slow or slow rising (or the inverse).
A confirmation window (bars) must hold true before trend flips. That window can be auto-tuned by session (Asia/London/NY) or set globally.
OBV confirmation (optional)
OBV smoothed by SMA; needs to be rising/falling for N bars (also session-aware if you enable presets).
MACD
Standard MACD Fast/Slow/Signal; the dashboard shows Bull ▲, Bear ▼ or Flat based on line vs signal.
Flux Score (top row)
A composite, smoothed gauge from 0–100:
40% Trend, 30% MACD, 30% OBV → EMA(3) smoothed.
Labels: Bullish ≥ 70, Bearish ≤ 30, otherwise Neutral.
Summary line explains why (e.g., “MACD↑, OBV↑, Trend up”).
Sessions & zones (Eastern/NY time)
Recognizes Asia / London / New York main sessions and pre-sessions using your chart’s Eastern time.
Session label (top of chart): text is white; background auto-matches the current session color (or your manual color).
Zone backgrounds (optional): off by default; when on, default transparency ≈ 95% (very light), with separate colors for each session and pre-session. A toggle lets you draw pre-session on top or beneath main sessions.
Signals & markers
Two strength tiers: Strong (Trend + OBV + MACD aligned) and Weak (2 of the 3 agree).
To reduce clutter, markers only appear on direction shifts (from last visible direction to a new one), and you can enforce a minimum bar gap.
Marker style:
Default Icons with LabelUp/LabelDown (tiny).
Colors: strong long = bright white by default; others configurable.
Weak markers are slightly offset from price using ATR so they don’t overlap wicks.
Dashboard (2-column)
Left column = label, right column = value:
Flux Score: numeric + Bullish/Neutral/Bearish tag.
Summary: short reason of the score.
Trend: UP / DOWN / FLAT (cell tinted green/red/gray).
MACD: Bull ▲ / Bear ▼ / Flat (tinted).
Signal: last printed signal + bar age (fresh signals get a lighter tint).
MA: slow MA type/length and up/down arrow.
Sess: current session label (e.g., “Pre-London”, “New York”).
VIX / VXN (optional): shows current value.
Auto tint: based on calm/watch/elevated thresholds (you control levels and colors).
Manual tint: fixed BG color if you prefer consistency.
Params: “P”=trend bars, “O”=OBV bars, mode (Strict/Lenient), and “Candles”.
You can set a global Default Transparency for the dashboard cells.
Key settings to know
Confirm On Close: when on (default), trend/OBV/MACD states use the last confirmed bar; this avoids mid-bar flicker and reduces repaint risk.
Session presets: when enabled, the number of bars required for confirmations tightens/loosens per session (e.g., Asia uses more bars than NY).
Colors & Opacity:
MA lines have their own transparency (default 0 = fully opaque).
Dashboard cells use a single global transparency (default 40%).
Session zones default to very light (95%) and are off by default.
VIX/VXN cells can auto-color by regime or use a manual background.
Markers:
“Icons” vs “Ticks.” Default is Icons with tiny labels up/down.
“Shift only” display reduces noise; you can also set min bar spacing.
How to read it (quick workflow)
Flux Score row: a fast “risk-on/off” gauge.
≥70 with green Trend/MACD cells → higher-conviction long context.
≤30 with red Trend/MACD cells → higher-conviction short context.
Summary explains why the score is what it is.
Signal row: tells you the last official signal and how many bars ago it fired. Fresh signals tint lighter.
MA row: aligns your slow baseline; arrow helps spot slow-turns early.
Sess row + label: know which market is active; behavior and your confirmation bars adapt by session if presets are on.
VIX/VXN (if enabled): extra context for risk regime (values and color band).
Good practices & caveats
It’s confirmation-based to reduce false flips; you’ll get signals slightly later, by design.
All signals are informational; there’s no position management or stops in this build (we removed the stop visuals by request).
If you switch to exotic chart types or extreme resolutions, re-tune lengths and confirmation bars (and potentially disable session presets).
For scalping, consider reducing confirmation bars and OBV smoothing; for higher timeframes, increase them.
Quick customization ideas
Want faster flips? Lower confirmBars and obvBars, increase slope buffer a bit to retain quality.
Want fewer weak signals? Show only strong markers (toggle off weak via colors/visibility or increase min bar gap).
Prefer EMA stacking? Set both Fast/Slow to EMA.
Don’t care about OBV? Turn OBV confirm off; Trend + MACD will drive

Technical Summary VWAP | RSI | VolatilityTechnical Summary VWAP | RSI | Volatility
The Quantum Trading Matrix is a multi-dimensional market-analysis dashboard designed as an educational and idea-generation tool to help traders read price structure, participation, momentum and volatility in one compact view. It is not an automated execution system; rather, it aggregates lightweight “quantum” signals — VWAP position, momentum oscillator behaviour, multi-EMA trend scoring, volume flow and institutional activity heuristics, market microstructure pivots and volatility measures — and synthesizes them into a single, transparent score and signal recommendation. The primary goal is to make explicit why a given market looks favourable or unfavourable by showing the individual ingredients and how they combine, enabling traders to learn, test and form rules based on observable market mechanics.
Each module of the matrix answers a distinct market question. VWAP and its percentage distance indicate whether the current price is trading above or below the intraday volume-weighted average — a proxy for intraday institutional control and value. The quantum momentum oscillator (fast and slow EMA difference scaled to percent) captures short-to-intermediate momentum shifts, providing a quickly responsive view of directional pressure. Multi-EMA trend scoring (8/21/50) produces a simple, transparent trend score by counting conditions such as price above EMAs and cross-EMAs ordering; this score is used to categorize market trend into descriptive buckets (e.g., STRONG UP, WEAK UP, NEUTRAL, DOWN). Volume analysis compares current volume to a recent moving average and computes a Z-score to detect spikes and unusual participation; additional buy/sell pressure heuristics (buyingPressure, sellingPressure, flowRatio) estimate whether upside or downside participation dominates the bar. Institutional activity is approximated by flagging large orders relative to volume baseline (e.g., volume > 2.5× MA) and estimating a dark pool proxy; this is a heuristic to highlight bars that likely had large players involved.
The dashboard also performs market-structure detection with small pivot windows to identify recent local support/resistance areas and computes price position relative to the daily high/low (dailyMid, pricePosition). Volatility is measured via ATR divided by price and bucketed into LOW/NORMAL/HIGH/EXTREME categories to help you adapt stop sizing and expectational horizons. Finally, all these pieces feed an interpretable scoring function that rewards alignment: VWAP above, strong flow ratio, bullish trend score, bullish momentum, and favorable RSI zone add to the overall score which is presented as a 0–100 metric and a colored emoji indicator for at-a-glance assessment.
The mashup is purposeful: each indicator covers a failure mode of the other. For example, momentum readings can be misleading during volatility spikes; VWAP informs whether institutions are on the bid or offer; volume Z-score detects abnormal participation that can validate a breakout; multi-EMA score mitigates single-EMA whipsaws by requiring a combination of price/EMA conditions. Combining these signals increases information content while keeping each component explainable — a key compliance requirement. The script intentionally emphasizes transparency: when it shows a BUY/SELL/HOLD recommendation, the dashboard shows the underlying sub-components so a trader can see whether VWAP, momentum, volume, trend or structure primarily drove the score.
For practical use, adopt a clear workflow: (1) check the matrix score and read the component tiles (VWAP position, momentum, trend and volume) to understand the drivers; (2) confirm market-structure support/resistance and pricePosition relative to the daily range; (3) require at least two corroborating components (for example, VWAP ABOVE + Momentum BULLISH or Volume spike + Trend STRONG UP) before considering entries; (4) use ATR-based stops or daily pivot distance for stop placement and size positions such that the trade risks a small, pre-defined percent of capital; (5) for intraday scalps shorten holding time and tighten stops, for swing trades increase lookback lengths and require multi-timeframe (higher TF) agreement. Treat the matrix as an idea filter and replay lab: when an alert triggers, replay the bars and observe which components anticipated the move and which lagged.
Parameter tuning matters. Shortening the momentum length makes the oscillator more sensitive (useful for scalping), while lengthening it reduces noise for swing contexts. Volume profile bars and MA length should match the instrument’s liquidity — increase the MA for low-liquidity stocks to reduce false institutional flags. The trend multiplier and signal sensitivity parameters let you calibrate how aggressively the matrix counts micro evidence into the score. Always backtest parameter sets across multiple periods and instruments; run walk-forward tests and keep a simple out-of-sample validation window to reduce overfitting risk.
Limitations and failure modes are explicit: institutional flags and dark-pool estimates are heuristics and cannot substitute for true tape or broker-level order flow; volume split by price range is an approximation and will not perfectly reflect signed volume; pivot detection with small windows may miss larger structural swings; VWAP is typically intraday-centric and less meaningful across multi-day swing contexts; the score is additive and may not capture non-linear relationships between features in extreme market regimes (e.g., flash crashes, circuit breaker events, or overnight gaps). The matrix is also susceptible to false signals during major news releases when price and volume behavior dislocate from typical patterns. Users should explicitly test behavior around earnings, macro data and low-liquidity periods.
To learn with the matrix, perform these experiments: (A) collect all BUY/SELL alerts over a 6-month period and measure median outcome at 5, 20 and 60 bars; (B) require additional gating conditions (e.g., only accept BUY when flowRatio>60 and trendScore≥4) and compare expectancy; (C) vary the institutional threshold (2×, 2.5×, 3× volumeMA) to see how many true positive spikes remain; (D) perform multi-instrument tests to ensure parameters are not tuned to a single ticker. Document every test and prefer robust, slightly lower returns with clearer logic rather than tuned “optimal” results that fail out of sample.
Originality statement: This script’s originality lies in the curated combination of intraday value (VWAP), multi-EMA trend scoring, momentum percent oscillator, volume Z-score plus buy/sell flow heuristics and a compact, interpretable scoring system. The script is not a simple indicator mashup; it is a didactic ensemble specifically designed to make internal rationale visible so traders can learn how each market characteristic contributes to actionable probability. The tool’s novelty is its emphasis on interpretability — showing the exact contributing signals behind a composite score — enabling reproducible testing and educational value.
Finally, for TradingView publication, include a clear description listing the modules, a short non-technical summary of how they interact, the tunable inputs, limitations and a risk disclaimer. Remove any promotional content or external contact links. If you used trademark symbols, either provide registration details or remove them. This transparent documentation satisfies TradingView’s requirement that mashups justify their composition and teach users how to use them.
Quantum Trading Matrix — multi-factor intraday dashboard (educational use only).
Purpose: Combines intraday VWAP position, a fast/slow EMA momentum percent oscillator, multi-EMA trend scoring (8/21/50), volume Z-score and buy/sell flow heuristics, pivot-based microstructure detection, and ATR-based volatility buckets to produce a transparent, componentized market score and trade-idea indicator. The mashup is intentional: VWAP identifies intraday value, momentum detects short bursts, EMAs provide structural trend bias, and volume/flow confirm participation. Signals require alignment of at least two components (for example, VWAP ABOVE + Momentum BULLISH + positive flow) for higher confidence.
Inputs: momentum period, volume MA/profile length, EMA configuration (8/21/50), trend multiplier, signal sensitivity, color and display options. Use shorter momentum lengths for scalps and longer for swing analysis. Increase volume MA for thinly traded instruments.
Limitations: Institutional/dark-pool estimates and flow heuristics are approximations, not actual exchange tape. VWAP is intraday-focused. Expect false signals during major news or low-liquidity sessions. Backtest and paper-trade before applying real capital.
Risk Disclaimer: For education and analysis only. Not financial advice. Use proper risk management. The author is not responsible for trading losses.
________________________________________
Risk & Misuse Disclaimer
This indicator is provided for education, analysis and idea generation only. It is not investment or financial advice and does not guarantee profits. Institutional activity flags, dark-pool estimates and flow heuristics are approximations and should not be treated as exchange tape. Backtest thoroughly and use demo/paper accounts before trading real capital. Always apply appropriate position sizing and stop-loss rules. The author is not responsible for any trading losses resulting from the use or misuse of this tool.
________________________________________
Risk Disclaimer: This tool is provided for education and analysis only. It is not financial advice and does not guarantee returns. Users assume all risk for trades made based on this script. Back test thoroughly and use proper risk management.

FNGAdataOpenOpen prices for FNGA ETF (Dec 2018–May 2025)
The FNGA ETF (originally launched under the FNGU ticker before being renamed in March 2025) tracked the MicroSectors FANG+™ Index with 3x daily leverage and was designed to give traders magnified exposure to a concentrated basket of large-cap technology and tech-enabled companies. The fund’s price history contains multiple phases due to ticker changes, corporate actions, and its eventual redemption in mid-2025.
When looking specifically at Open prices from December 2018 through May 2025, this dataset provides the daily opening values for FNGA across its entire lifecycle. The opening price is the first traded price at the start of each regular U.S. market session (9:30 a.m. Eastern Time). It is an important measure for traders and analysts because it reflects overnight sentiment, pre-market positioning, and often sets the tone for intraday volatility.

POC Migration Velocity (POC-MV) [PhenLabs]📊POC Migration Velocity (POC-MV)
Version: PineScript™v6
📌Description
The POC Migration Velocity indicator revolutionizes market structure analysis by tracking the movement, speed, and acceleration of Point of Control (POC) levels in real-time. This tool combines sophisticated volume distribution estimation with velocity calculations to reveal hidden market dynamics that conventional indicators miss.
POC-MV provides traders with unprecedented insight into volume-based price movement patterns, enabling the early identification of continuation and exhaustion signals before they become apparent to the broader market. By measuring how quickly and consistently the POC migrates across price levels, traders gain early warning signals for significant market shifts and can position themselves advantageously.
The indicator employs advanced algorithms to estimate intra-bar volume distribution without requiring lower timeframe data, making it accessible across all chart timeframes while maintaining sophisticated analytical capabilities.
🚀Points of Innovation
Micro-POC calculation using advanced OHLC-based volume distribution estimation
Real-time velocity and acceleration tracking normalized by ATR for cross-market consistency
Persistence scoring system that quantifies directional consistency over multiple periods
Multi-signal detection combining continuation patterns, exhaustion signals, and gap alerts
Dynamic color-coded visualization system with intensity-based feedback
Comprehensive customization options for resolution, periods, and thresholds
🔧Core Components
POC Calculation Engine: Estimates volume distribution within each bar using configurable price bands and sophisticated weighting algorithms
Velocity Measurement System: Tracks the rate of POC movement over customizable lookback periods with ATR normalization
Acceleration Calculator: Measures the rate of change of velocity to identify momentum shifts in POC migration
Persistence Analyzer: Quantifies how consistently POC moves in the same direction using exponential weighting
Signal Detection Framework: Combines trend analysis, velocity thresholds, and persistence requirements for signal generation
Visual Rendering System: Provides dynamic color-coded lines and heat ribbons based on velocity and price-POC relationships
🔥Key Features
Real-time POC calculation with 10-100 configurable price bands for optimal precision
Velocity tracking with customizable lookback periods from 5 to 50 bars
Acceleration measurement for detecting momentum changes in POC movement
Persistence scoring to validate signal strength and filter false signals
Dynamic visual feedback with blue/orange color scheme indicating bullish/bearish conditions
Comprehensive alert system for continuation patterns, exhaustion signals, and POC gaps
Adjustable information table displaying real-time metrics and current signals
Heat ribbon visualization showing price-POC relationship intensity
Multiple threshold settings for customizing signal sensitivity
Export capability for use with separate panel indicators
🎨Visualization
POC Connecting Lines: Color-coded lines showing POC levels with intensity based on velocity magnitude
Heat Ribbon: Dynamic colored ribbon around price showing POC-price basis intensity
Signal Markers: Clear exhaustion top/bottom signals with labeled shapes
Information Table: Real-time display of POC value, velocity, acceleration, basis, persistence, and current signal status
Color Gradients: Blue gradients for bullish conditions, orange gradients for bearish conditions
📖Usage Guidelines
POC Calculation Settings
POC Resolution (Price Bands): Default 20, Range 10-100. Controls the number of price bands used to estimate volume distribution within each bar
Volume Weight Factor: Default 0.7, Range 0.1-1.0. Adjusts the influence of volume in POC calculation
POC Smoothing: Default 3, Range 1-10. EMA smoothing period applied to the calculated POC to reduce noise
Velocity Settings
Velocity Lookback Period: Default 14, Range 5-50. Number of bars used to calculate POC velocity
Acceleration Period: Default 7, Range 3-20. Period for calculating POC acceleration
Velocity Significance Threshold: Default 0.5, Range 0.1-2.0. Minimum normalized velocity for continuation signals
Persistence Settings
Persistence Lookback: Default 5, Range 3-20. Number of bars examined for persistence score calculation
Persistence Threshold: Default 0.7, Range 0.5-1.0. Minimum persistence score required for continuation signals
Visual Settings
Show POC Connecting Lines: Toggle display of colored lines connecting POC levels
Show Heat Ribbon: Toggle display of colored ribbon showing POC-price relationship
Ribbon Transparency: Default 70, Range 0-100. Controls transparency level of heat ribbon
Alert Settings
Enable Continuation Alerts: Toggle alerts for continuation pattern detection
Enable Exhaustion Alerts: Toggle alerts for exhaustion pattern detection
Enable POC Gap Alerts: Toggle alerts for significant POC gaps
Gap Threshold: Default 2.0 ATR, Range 0.5-5.0. Minimum gap size to trigger alerts
✅Best Use Cases
Identifying trend continuation opportunities when POC velocity aligns with price direction
Spotting potential reversal points through exhaustion pattern detection
Confirming breakout validity by monitoring POC gap behavior
Adding volume-based context to traditional technical analysis
Managing position sizing based on POC-price basis strength
⚠️Limitations
POC calculations are estimations based on OHLC data, not true tick-by-tick volume distribution
Effectiveness may vary in low-volume or highly volatile market conditions
Requires complementary analysis tools for complete trading decisions
Signal frequency may be lower in ranging markets compared to trending conditions
Performance optimization needed for very short timeframes below 1-minute
💡What Makes This Unique
Advanced Estimation Algorithm: Sophisticated method for calculating POC without requiring lower timeframe data
Velocity-Based Analysis: Focus on POC movement dynamics rather than static levels
Comprehensive Signal Framework: Integration of continuation, exhaustion, and gap detection in one indicator
Dynamic Visual Feedback: Intensity-based color coding that adapts to market conditions
Persistence Validation: Unique scoring system to filter signals based on directional consistency
🔬How It Works
Volume Distribution Estimation:
Divides each bar into configurable price bands for volume analysis
Applies sophisticated weighting based on OHLC relationships and proximity to close
Identifies the price level with maximum estimated volume as the POC
Velocity and Acceleration Calculation:
Measures POC rate of change over specified lookback periods
Normalizes values using ATR for consistent cross-market performance
Calculates acceleration as the rate of change of velocity
Signal Generation Process:
Combines trend direction analysis using EMA crossovers
Applies velocity and persistence thresholds to filter signals
Generates continuation, exhaustion, and gap alerts based on specific criteria
💡Note:
This indicator provides estimated POC calculations based on available OHLC data and should be used in conjunction with other analysis methods. The velocity-based approach offers unique insights into market structure dynamics but requires proper risk management and complementary analysis for optimal trading decisions.

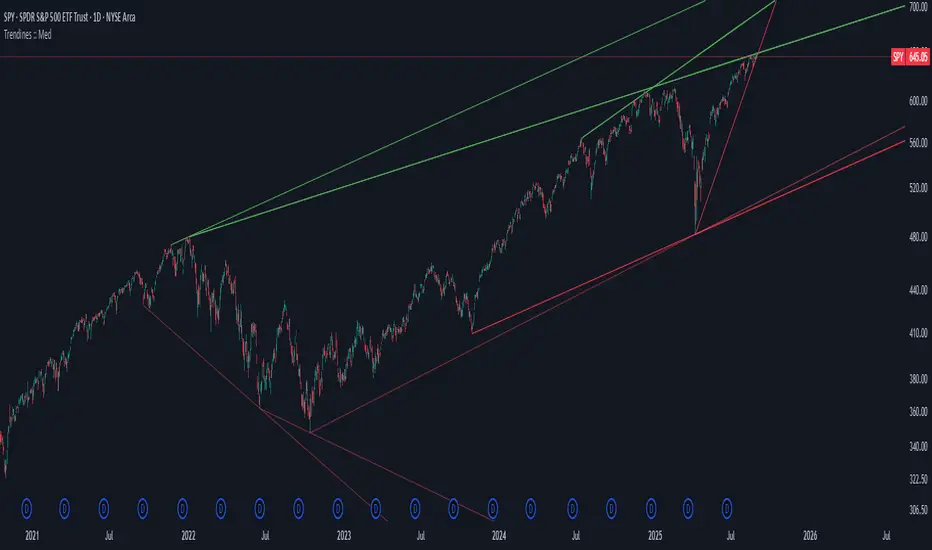
Algo + Trendlines :: Medium PeriodThis indicator helps me to avoid overlooking Trendlines / Algolines. So far it doesn't search explicitly for Algolines (I don't consider volume at all), but it's definitely now already not horribly bad.
These are meant to be used on logarithmic charts btw! The lines would be displayed wrong on linear charts.
The biggest challenge is that there are some technical restrictions in TradingView, f. e. a script stops executing if a for-loop would take longer than 0.5 sec.
So in order to circumvent this and still be able to consider as many candles from the past as possible, I've created multiple versions for different purposes that I use like this:
Algo + Trendlines :: Medium Period : This script looks for "temporary highs / lows" (meaning the bar before and after has lower highs / lows) on the daily chart, connects them and shows the 5 ones that are the closest to the current price (=most relevant). This one is good to find trendlines more thoroughly, but only up to 4 years ago.
Algo + Trendlines :: Long Period : This version looks instead at the weekly charts for "temporary highs / lows" and finds out which days caused these highs / lows and connects them, Taking data from the weekly chart means fewer data points to check whether a trendline is broken, which allows to detect trendlines from up to 12 years ago! Therefore it misses some trendlines. Personally I prefer this one with "Only Confirmed" set to true to really show only the most relevant lines. This means at least 3 candle highs / lows touched the line. These are more likely stronger resistance / support lines compared to those that have been touched only twice.
Very important: sometimes you might see dotted lines that suddenly stop after a few months (after 100 bars to be precise). This indicates you need to zoom further out for TradingView to be able to load the full line. Unfortunately TradingView doesn't render lines if the starting point was too long ago, so this is my workaround. This is also the script's biggest advantage: showing you lines that you might have missed otherwise since the starting bars were outside of the screen, and required you to scroll f. e back to 2015..
One more thing to know:
Weak colored line = only 2 "collision" points with candle highs/lows (= not confirmed)
Usual colored line = 3+ "collision" points (= confirmed)
Make sure to move this indicator above the ticker in the Object Tree, so that it is drawn on top of the ticker's candles!
More infos: www.reddit.com
Algo + Trendlines :: Long PeriodThis indicator helps me to avoid overlooking Trendlines / Algolines. So far it doesn't search explicitly for Algolines (I don't consider volume at all), but it's definitely now already not horribly bad.
These are meant to be used on logarithmic charts btw! The lines would be displayed wrong on linear charts.
The biggest challenge is that there are some technical restrictions in TradingView, f. e. a script stops executing if a for-loop would take longer than 0.5 sec.
So in order to circumvent this and still be able to consider as many candles from the past as possible, I've created multiple versions for different purposes that I use like this:
Algo + Trendlines :: Medium Period : This script looks for "temporary highs / lows" (meaning the bar before and after has lower highs / lows) on the daily chart, connects them and shows the 5 ones that are the closest to the current price (=most relevant). This one is good to find trendlines more thoroughly, but only up to 4 years ago.
Algo + Trendlines :: Long Period : This version looks instead at the weekly charts for "temporary highs / lows" and finds out which days caused these highs / lows and connects them, Taking data from the weekly chart means fewer data points to check whether a trendline is broken, which allows to detect trendlines from up to 12 years ago! Therefore it misses some trendlines. Personally I prefer this one with "Only Confirmed" set to true to really show only the most relevant lines. This means at least 3 candle highs / lows touched the line. These are more likely stronger resistance / support lines compared to those that have been touched only twice.
Very important: sometimes you might see dotted lines that suddenly stop after a few months (after 100 bars to be precise). This indicates you need to zoom further out for TradingView to be able to load the full line. Unfortunately TradingView doesn't render lines if the starting point was too long ago, so this is my workaround. This is also the script's biggest advantage: showing you lines that you might have missed otherwise since the starting bars were outside of the screen, and required you to scroll f. e back to 2015..
One more thing to know:
Weak colored line = only 2 "collision" points with candle highs/lows (= not confirmed)
Usual colored line = 3+ "collision" points (= confirmed)
Make sure to move this indicator above the ticker in the Object Tree, so that it is drawn on top of the ticker's candles!
More infos: www.reddit.com

High Volume Candles - RVolInspired by Key bars from Option Stalker Pro.
This one is meant to be used on charts where the interval is >=1D.
Highlights candles where RVol is > 1.2.
Helps to not accidentally miss that a candle move happened on high volume (or that it did not happen on high volume...), like potential reversals or resistance/support breaks.
Make sure to move this indicator above the ticker in the Object Tree, so that it is drawn on top of the ticker's candles.
More infos: www.reddit.com

High Volume CandlesInspired by Key bars from Option Stalker Pro.
This one is meant to be used on charts where the interval is <1D.
Highlights candles in chart with Volume > 1.4 * last 30 candles average volume.
Helps to not accidentally miss that a candle move happened on high volume (or that it did not happen on high volume...), like potential reversals or resistance/support breaks.
Make sure to move this indicator above the ticker in the Object Tree, so that it is drawn on top of the ticker's candles.
More infos: www.reddit.com

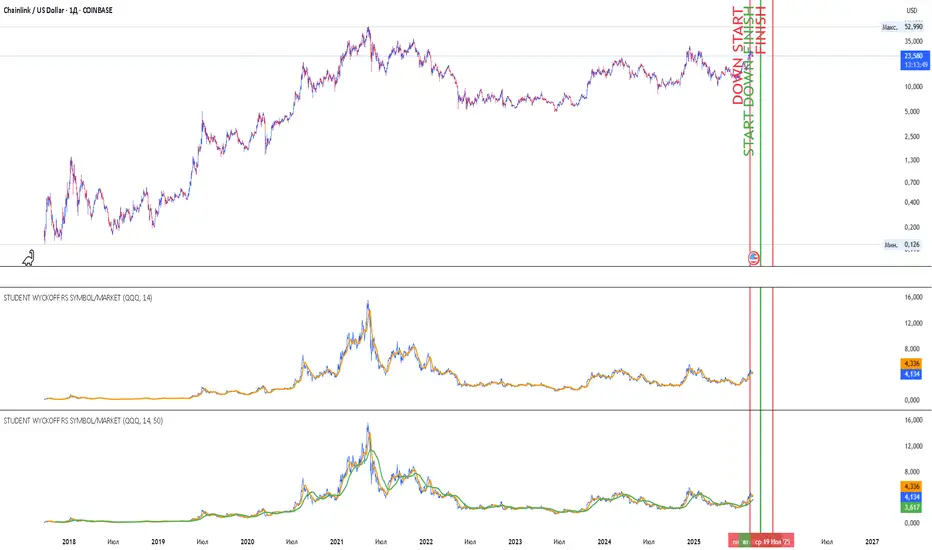
Student Wyckoff RS Symbol/MarketRelative Strength Indicator STUDENT WYCKOFF RS SYMBOL/MARKET
Description
The Relative Strength (RS) Indicator compares the price performance of the current financial instrument (e.g., a stock) against another instrument (e.g., an index or another stock). It is calculated by dividing the closing price of the first instrument by the closing price of the second, then multiplying by 100. This provides a percentage ratio that shows how one instrument outperforms or underperforms another. The indicator helps traders identify strong or weak assets, spot market leaders, or evaluate an asset’s performance relative to a benchmark.
Key Features
Relative Strength Calculation: Divides the closing price of the current instrument by the closing price of the second instrument and multiplies by 100 to express the ratio as a percentage.
Simple Moving Average (SMA): Applies a customizable Simple Moving Average (default period: 14) to smooth the data and highlight trends.
Visualization: Displays the Relative Strength as a blue line, the SMA as an orange line, and colors bars (blue for rising, red for falling) to indicate changes in relative strength.
Flexibility: Allows users to select the second instrument via an input field and adjust the SMA period.
Applications
Market Comparison: Assess whether a stock is outperforming an index (e.g., S&P 500 or MOEX) to identify strong assets for investment.
Sector Analysis: Compare stocks within a sector or against a sector ETF to pinpoint leaders.
Trend Analysis: Use the rise or fall of the RS line and its SMA to gauge the strength of an asset’s trend relative to another instrument.
Trade Timing: Bar coloring helps quickly identify changes in relative strength, aiding short-term trading decisions.
Interpretation
Rising RS: Indicates the first instrument is outperforming the second (e.g., a stock growing faster than an index).
Falling RS: Suggests the first instrument is underperforming.
SMA as a Trend Filter: If the RS line is above the SMA, it may signal strengthening performance; if below, weakening performance.
Settings
Instrument 2: Ticker of the second instrument (default: QQQ).
SMA Period: Period for the Simple Moving Average (default: 14).
Notes
The indicator works on any timeframe but requires accurate ticker input for the second instrument.
Ensure data for both instruments is available on the selected timeframe for precise analysis.
Future Value ProjectionFuture Value Projection with Actual CAGR
This indicator calculates the future value (FV) of the current ticker’s price using its historical Compound Annual Growth Rate (CAGR). It measures how much the price has grown over a chosen lookback period, derives the average annual growth rate, and then projects the current price forward into the future.
Formulae:
CAGR:
CAGR = ( PV_now / PV_past )^(1 / t) - 1
Future Value:
FV = PV_now × ( 1 + CAGR / n )^( n × T )
Where:
PV_now = Current price
PV_past = Price t years ago
t = Lookback period (years)
CAGR = Compound Annual Growth Rate
n = Compounding periods per year (1=annual, 12=monthly, 252=daily, etc.)
T = Projection horizon (years forward)
How it works:
Select a lookback period (e.g., 3 years).
The script finds the price from that time and computes the CAGR.
It then projects the current price forward by T years using the CAGR.
The chart shows:
Current price (blue)
Projected FV target (green)
A table with CAGR and projection details
Use case:
Helps investors and traders visualize long-term growth projections if the ticker continues growing at its historical pace.

FlowFusion Money Flow — FP + VWAP Drift + PVT (−100..+100)Title (ASCII only)
FlowFusion Money Flow — Flow Pressure + Rolling VWAP Drift + PVT (Normalized −100..+100)
Short Description
Original money-flow oscillator combining Flow Pressure, Rolling VWAP Drift, and PVT Momentum into one normalized score (−100..+100) with a signal line, thresholds, optional component plots, and ready-made alerts.
Full Description (meets “originality & usefulness”)
What’s original
FlowFusion Money Flow is not a generic mashup. It builds a single score from three complementary, volume-aware components that target different facets of order flow:
Flow Pressure (FP) — In-bar directional drive scaled by relative volume.
Drive
=
close
−
open
max
(
high
−
low
,
tick
)
∈
=
max(high−low, tick)
close−open
∈ .
Relative Volume
=
volume
average volume over
𝑓
𝑝
𝐿
𝑒
𝑛
=
average volume over fpLen
volume
.
𝐹
𝑃
𝑟
𝑎
𝑤
=
Drive
×
RelVol
FP
raw
=Drive×RelVol then squashed (softsign) to
.
Why it belongs: distinguishes real pushes (big body and big volume) from noise.
Rolling VWAP Drift — Direction of VWAP itself over a rolling window, normalized by ATR.
𝑉
𝑊
𝐴
𝑃
𝑡
=
∑
(
𝑇
𝑃
×
𝑉
𝑜
𝑙
)
∑
𝑉
𝑜
𝑙
VWAP
t
=
∑Vol
∑(TP×Vol)
over vwapLen.
Drift
=
𝑉
𝑊
𝐴
𝑃
𝑡
−
𝑉
𝑊
𝐴
𝑃
𝑡
−
1
𝐴
𝑇
𝑅
=
ATR
VWAP
t
−VWAP
t−1
→ squashed to
.
Why it belongs: persistent VWAP movement signals sustained accumulation/distribution.
PVT Momentum — Price-Volume Trend standardized (z-score) and squashed.
𝑃
𝑉
𝑇
𝑡
=
𝑃
𝑉
𝑇
𝑡
−
1
+
𝑉
𝑜
𝑙
×
Δ
𝐶
𝑙
𝑜
𝑠
𝑒
𝐶
𝑙
𝑜
𝑠
𝑒
𝑡
−
1
PVT
t
=PVT
t−1
+Vol×
Close
t−1
ΔClose
.
𝑧
=
𝑃
𝑉
𝑇
−
SMA
(
𝑃
𝑉
𝑇
)
StDev
(
𝑃
𝑉
𝑇
)
z=
StDev(PVT)
PVT−SMA(PVT)
→ squashed to
.
Why it belongs: captures volume-weighted trend pressure without relying on price alone.
Composite score:
Score
=
𝑤
𝐹
𝑃
⋅
𝐹
𝑃
+
𝑤
𝑉
𝑊
𝐴
𝑃
⋅
𝑉
𝑊
𝐴
𝑃
_
𝐷
𝑟
𝑖
𝑓
𝑡
+
𝑤
𝑃
𝑉
𝑇
⋅
𝑃
𝑉
𝑇
_
𝑀
𝑜
𝑚
𝑤
𝐹
𝑃
+
𝑤
𝑉
𝑊
𝐴
𝑃
+
𝑤
𝑃
𝑉
𝑇
Score=
w
FP
+w
VWAP
+w
PVT
w
FP
⋅FP+w
VWAP
⋅VWAP_Drift+w
PVT
⋅PVT_Mom
with a Signal = SMA(Score, sigLen). Thresholds mark strong accumulation/distribution zones.
How it works (step-by-step)
Compute FP, VWAP Drift, PVT Momentum.
Normalize each to the same
scale.
Weighted average → FlowFusion Score.
Smooth with a Signal line to reduce whipsaw.
Optional background shading when Score exceeds thresholds.
How to use
Direction filter:
Score > 0 favors longs; Score < 0 favors shorts.
Momentum turns:
Score crosses above Signal → setup for long; below → setup for short.
Strength zones:
Above Upper Threshold (default +40) = strong buy pressure; below Lower (−40) = strong sell pressure.
Confluence:
Best near S/R, trendlines, or HTF bias. For scalping on 1–5m, consider sigLen 9–13 and thresholds ±40 to ±50.
Alerts included: zero cross, zone entries, and Score/Signal crossovers.
Inputs (key)
fpLen (20): relative-volume lookback for Flow Pressure.
vwapLen (34): rolling VWAP window.
pvtLen (50): PVT z-score window.
sigLen (9): Signal smoothing.
Weights: wFP, wVWAP, wPVT to bias the blend.
Thresholds: upperBand / lowerBand (defaults +40/−40).
Display: toggle component plots and background shading.
Best practices
Trending markets: increase wVWAP (VWAP Drift) or widen thresholds.
Ranging markets: increase wFP and wPVT; take quicker profits.
News: wait for bar close confirmation or reduce size.
Data quality: use consistent volume feeds (especially in crypto).
Limitations
Oscillators can stay extreme in strong trends; use structure/trend filters.
Volume anomalies (illiquid pairs, API glitches) can distort signals—sanity-check with another venue when possible.
Disclaimer
This indicator is for educational purposes only and is not financial advice. Trading involves risk; past performance does not guarantee future results. Always paper-trade first and use appropriate risk controls.

ForecastForecast (FC), indicator documentation
Type: Study, not a strategy
Primary timeframe: 1D chart, most plots and the on-chart table only render on daily bars
Inspiration: Robert Carver’s “forecast” concept from Advanced Futures Trading Strategies, using normalized, capped signals for comparability across markets
⸻
What the indicator does
FC builds a volatility-normalized momentum forecast for a chosen symbol, optionally versus a benchmark. It combines an EWMAC composite with a channel breakout composite, then caps the result to a common scale. You can run it in three data modes:
• Absolute: Forecast of the selected symbol
• Relative: Forecast of the ratio symbol / benchmark
• Combined: Average of Absolute and Relative
A compact table can summarize the current forecast, short-term direction on the forecast EMAs, correlation versus the benchmark, and ATR-scaled distances to common price EMAs.
⸻
PineScreener, relative-strength screening
This indicator is excellent for screening on relative strength in PineScreener, since the forecast is volatility-normalized and capped on a common scale.
Available PineScreener columns
PineScreener reads the plotted series. You will see at least these columns:
• FC, the capped forecast
• from EMA20, (price − EMA20) / ATR in ATR multiples
• from EMA50, (price − EMA50) / ATR in ATR multiples
• ATR, ATR as a percent of price
• Corr, weekly correlation with the chosen benchmark
Relative mode and Combined mode are recommended for cross-sectional screens. In Relative mode the calculation uses symbol / benchmark, so ensure the ratio ticker exists for your data source.
⸻
How it works, step by step
1. Volatility model
Compute exponentially weighted mean and variance of daily percent returns on D, annualize, optionally blend with a long lookback using 10y %, then convert to a price-scaled sigma.
2. EWMAC momentum, three legs
Daily legs: EMA(8) − EMA(32), EMA(16) − EMA(64), EMA(32) − EMA(128).
Divide by price-scaled sigma, multiply by leg scalars, cap to Cap = 20, average, then apply a small FDM factor.
3. Breakout momentum, three channels
Smoothed position inside 40, 80, and 160 day channels, each scaled, then averaged.
4. Composite forecast
Average the EWMAC composite and the breakout composite, then cap to ±20.
Relative mode runs the same logic on symbol / benchmark.
Combined mode averages Absolute and Relative composites.
5. Weekly correlation
Pearson correlation between weekly closes of the asset and the benchmark over a user-set length.
6. Direction overlay
Two EMAs on the forecast series plus optional green or red background by sign, and optional horizontal level shading around 0, ±5, ±10, ±15, ±20.
⸻
Plots
• FC, capped forecast on the daily chart
• 8-32 Abs, 8-32 Rel, single-leg EWMAC plus breakout view
• 8-32-128 Abs, 8-32-128 Rel, three-leg composite views
• from EMA20, from EMA50, (price − EMA) / ATR
• ATR, ATR as a percent of price
• Corr, weekly correlation with the benchmark
• Forecast EMA1 and EMA2, EMAs of the forecast with an optional fill
• Backgrounds and guide lines, optional sign-based background, optional 0, ±5, ±10, ±15, ±20 guides
Most plots and the table are gated by timeframe.isdaily. Set the chart to 1D to see them.
⸻
Inputs
Symbol selection
• Absolute, Relative, Combined
• Vs. benchmark for Relative mode and correlation, choices: SPY, QQQ, XLE, GLD
• Ticker or Freeform, for Freeform use full TradingView notation, for example NASDAQ:AAPL
Engine selection
• Include:
• 8-32-128, three EWMAC legs plus three breakouts
• 8-32, simplified view based on the 8-32 leg plus a 40-day breakout
EMA, applied to the forecast
• EMA1, EMA2, with line-width controls, plus color and opacity
Volatility
• Span, EW volatility span for daily returns
• 10y %, blend of long-run volatility
• Thresh, Too volatile, placeholders in this version
Background
• Horizontal bg, level shading, enabled by default
• Long BG, Hedge BG, colors and opacities
Show
• Table, Header, Direction, Gain, Extension
• Corr, Length for correlation row
Table settings
• Position, background, opacity, text size, text color
Lines
• 0-lines, 10-lines, 5-lines, level guides
⸻
Reading the outputs
• Forecast > 0, bullish tilt; Forecast < 0, bearish or hedge tilt
• ±10 and ±20 indicate strength on a uniform scale
• EMA1 vs EMA2 on the forecast, EMA1 above EMA2 suggests improving momentum
• Table rows, label colored by sign, current forecast value plus a green or red dot for the forecast EMA cross, optional daily return percent, weekly correlation, and ATR-scaled EMA9, EMA20, EMA50 distances
⸻
Data handling, repainting, and performance
• Daily and weekly series are fetched with request.security().
• Calculations use closed bars, values can update until the bar closes.
• No lookahead, historical values do not repaint.
• Weekly correlation updates during the week, it finalizes on weekly close.
• On intraday charts most visuals are hidden by design.
⸻
Good practice and limitations
• This is a research indicator, not a trading system.
• The fixed Cap = 20 keeps a common scale, extreme moves will be clipped.
• Relative mode depends on the ratio symbol / benchmark, ensure both legs have data for your feed.
⸻
Credits
Concept inspired by Robert Carver’s forecast methodology in Advanced Futures Trading Strategies. Implementation details, parameters, and visuals are specific to this script.
⸻
Changelog
• First version
⸻
Disclaimer
For education and research only, not financial advice. Always test on your market and data feed, consider costs and slippage before using any indicator in live decisions.

Index Position Size Calculator for [US30 / US100 / SP500]What it does
This tool helps you size positions consistently for index trades on US30 (Dow Jones), NAS100 (Nasdaq-100), and SP500 (S&P 500). Enter your account balance, risk %, and your planned Entry / Stop-Loss / Target and the script calculates:
• Position Size (rounded to your lot/contract step)
• Risk-to-Reward (R/R)
• Potential P/L in USD based on your inputs
• Visual Entry / SL / TP lines with green/red zones and concise labels
Supported contract styles
Choose a preset for common products (e.g., CFD $1/pt, YM/NQ/ES futures, MYM/MNQ/MES micros) or override the economics yourself. You remain in control of the two key levers:
• $/point — how many dollars you gain/lose per 1 index point per contract/lot
• Point size — how many price units equal 1 index point on your chart (often 1.0, but some brokers use 0.1 or 0.5)
Inputs
• Account Balance ($) and Risk % per trade
• Index: US30 / NAS100 / SP500
• Contract: CFD / Futures (YM, NQ, ES) / Micros (MYM, MNQ, MES)
• $/point: auto from Contract or manual override
• Point size: auto from Index or manual override
• Position size step: rounding (e.g., 1 for futures, 0.01 for CFDs)
• Entry / SL / TP: typed values (snapped to tick), with on-chart zones and labels
• Display toggles for lines and labels
How the math works
• StopPoints = |Entry − SL| ÷ PointSize
• ProfitPoints = |TP − Entry| ÷ PointSize
• Position Size = (AccountBalance × Risk%) ÷ (StopPoints × $/point)
• R/R = ProfitPoints ÷ StopPoints
• Potential P/L = PositionSize × Points × $/point
How to use (quick start)
1. Select Index and Contract.
2. Confirm $/point and Point size match your broker’s specs.
3. Enter Entry / SL / TP for the trade idea.
4. Read the Position Size, R/R, and Potential P/L in the info box.
5. Adjust for fees, spreads, and slippage as needed.
Notes & limitations
• Broker symbols can vary. Always verify $/point and Point size for your instrument before risking capital.
• The script does not place orders and does not generate trade signals; it’s a sizing/visualization tool.
• Results can differ across brokers due to pricing, spreads, minimum lot sizes, and execution rules.
• Use on the intended indices; you’ll see a reminder if you load it elsewhere.
Changelog highlights
• Pine v6, constant-safe inputs, tick-snapping, global fills (no local-scope errors).
• Robust label handling and optional minimal chart markers.
Disclaimer
This script is provided for educational purposes only and does not constitute financial advice or a recommendation to buy or sell any security or derivative. Trading involves risk, including the possible loss of principal. Always do your own research, verify contract specifications with your broker, and consider testing in a demo environment before trading live.

1H Cross into Daily Bollinger UpperIndicator to spot volatility in a ticker.
The price moving above indicates a potential breakout and can be observed in such manner.
FibonacciRetracementHi all!
This library will help you draw Fibonacci retracement levels (zones). The code is from my indicator "Fibonacci retracement" (). You can see that description for more information about the behaviour and example of how to use this library. The code is almost the same with the addition of alerts. If the alert frequency is 'alert.freq_once_per_bar_close' alert messages will be concatenated and have a header saying how many messages it contains (if it's more than 1).
Hope this is of help!
Library "FibonacciRetracement"
ConcateAlerts(context)
Concatenates all alerts from the bar to one string (separated by new lines) and clears alert messages on the current bar.
Parameters:
context (Context)
AddAlert(context, message, unshiftInsteadOfPush)
Parameters:
context (Context)
message (string)
unshiftInsteadOfPush (bool)
Range(context, structure, settings)
Will return values if new levels/zones should be drawn.
Parameters:
context (Context) : The 'Context' for the Fibonacci retracement.
structure (Structure type from mickes/PriceAction/1) : The current 'Structure' from the 'MarketStructure' library.
settings (Settings) : The 'Settings' object for the 'Context'.
Returns: A tuple with the start and end pivot if new zones should be drawn, ' ' otherwise.
DrawAll(context, settings, start, end)
Draws lines and labels for the zone. It will also set the 'Price' value that will be used for absolute positions.
Parameters:
context (Context) : The 'Context' for the Fibonacci retracement.
settings (Settings) : The 'Settings' object for the 'Context'.
start (Pivot type from mickes/PriceAction/1)
end (Pivot type from mickes/PriceAction/1)
AlertActive(context, settings)
Will alert for all zones that are active. If multiple alert messages are added they will be concatenated (separated by a new line) with a header saying how many messages the alert contains.
Parameters:
context (Context) : The 'Context' for the Fibonacci retracement. This contains the zones that will be alerted if price (wick or close according to the settings) enters it.
settings (Settings) : The 'Settings' object for the 'Context'.
TrendlineSettings
Holds all the values for 'TrendlineSettings'.
Fields:
Enabled (series bool) : If the trendline should be visible or not.
Color (series color) : The color of the trendline.
Style (series string) : The style of the trendline (as a string).
GenericZonesSettings
Holds all the values for 'GenericZonesSettings', that will be applicable to all drawn objects.
Fields:
ExtendRight (series bool) : If all lines should extend to the right or not.
Style (series string) : The style of all drawn lines
Reverse (series bool) : If true, all lines will be reversed.
Prices (series bool) : If price levels should be shown or not.
Levels (series bool) : If levels should be shown or not.
LevelsValue (series string) : Either 'Value' or 'Percent'. Defined if value or percentage should be shown.
FontSize (series int) : The for size of the text in labels drawn.
LabelsPosition (series string) : Coul be 'Left', 'Rigth' or 'Adapt'. 'Adapt' will try to adapt the labels position to the prices.
ZoneSettings
Holds all the values for 'ZoneSettings'.
Fields:
Enabled (series bool) : If this zone is enabled or not.
Level (series float) : The level of the zone.
Color (series color) : The color that will be displayed.
Price (series float) : The price of the level. Will be set internally.
Settings
Holds all the values for 'Settings'.
Fields:
PivotLeftLength (series int) : The left length used to find pivots through the 'MarketStructure' library.
PivotRightLength (series int) : The right length used to find pivots through the 'MarketStructure' library.
Trendline (TrendlineSettings) : The settings for the 'Trendline' object.
GenericZonesSettings (GenericZonesSettings) : The setting applicable to all zones.
AlertFrequency (series string) : The frequency for the alerts. If 'alert.freq_once_per_bar_close', alert messages will be concatenated and have a header saying how many messages it contains (if it's more than 1).
AlertPrice (series string) : The price that has to enter a zone. Can be 'Close' (the closing price) or 'Wick' (the whole candle needs to be in the zone).
Zone1 (ZoneSettings) : The 'ZoneSettings' that represents this zone.
Zone2 (ZoneSettings) : The 'ZoneSettings' that represents this zone.
Zone3 (ZoneSettings) : The 'ZoneSettings' that represents this zone.
Zone4 (ZoneSettings) : The 'ZoneSettings' that represents this zone.
Zone5 (ZoneSettings) : The 'ZoneSettings' that represents this zone.
Zone6 (ZoneSettings) : The 'ZoneSettings' that represents this zone.
Zone7 (ZoneSettings) : The 'ZoneSettings' that represents this zone.
Zone8 (ZoneSettings) : The 'ZoneSettings' that represents this zone.
Zone9 (ZoneSettings) : The 'ZoneSettings' that represents this zone.
Zone10 (ZoneSettings) : The 'ZoneSettings' that represents this zone.
Zone11 (ZoneSettings) : The 'ZoneSettings' that represents this zone.
Zone12 (ZoneSettings) : The 'ZoneSettings' that represents this zone.
Zone13 (ZoneSettings) : The 'ZoneSettings' that represents this zone.
Zone14 (ZoneSettings) : The 'ZoneSettings' that represents this zone.
Zone15 (ZoneSettings) : The 'ZoneSettings' that represents this zone.
Zone16 (ZoneSettings) : The 'ZoneSettings' that represents this zone.
Zone17 (ZoneSettings) : The 'ZoneSettings' that represents this zone.
Zone18 (ZoneSettings) : The 'ZoneSettings' that represents this zone.
Zone19 (ZoneSettings) : The 'ZoneSettings' that represents this zone.
Zone20 (ZoneSettings) : The 'ZoneSettings' that represents this zone.
Zone21 (ZoneSettings) : The 'ZoneSettings' that represents this zone.
Zone22 (ZoneSettings) : The 'ZoneSettings' that represents this zone.
Zone23 (ZoneSettings) : The 'ZoneSettings' that represents this zone.
Zone24 (ZoneSettings) : The 'ZoneSettings' that represents this zone.
Context
Holds all the values for 'Context'.
Fields:
Lines (array) : All the drawn lines for the current 'Context'.
Labels (array) : All the drawn labels for the current 'Context'.
Boxes (array) : All the drawn boxes for the current 'Context'.
Alerts (array) : All the alert messages on the current tick.
Start (series int) : The start bar index of the current 'Context'.

NQ FVG + MSS ChecklistThe NQ FVG + MSS Quick Checklist is a visual trading HUD for Nasdaq 100 (NQ) futures. It helps traders quickly track key setup elements: session & previous day levels, 5M FVG, retests, 1M MSS, and 1M FVG inside MSS.
Each step can be manually ticked, and a Trade Score shows setup strength at a glance. The checklist table sits on top of all chart elements for easy reference without interfering with your analysis.
Features:
Step-by-step NQ trading checklist
Manual inputs with visual ✅/❌
Trade Score for quick setup confirmation
Table overlay always on top of the chart
Multi-TF Trend Table (Configurable)1) What this tool does (in one minute)
A compact, multi‑timeframe dashboard that stacks eight timeframes and tells you:
Trend (fast MA vs slow MA)
Where price sits relative to those MAs
How far price is from the fast MA in ATR terms
MA slope (rising, falling, flat)
Stochastic %K (with overbought/oversold heat)
MACD momentum (up or down)
A single score (0%–100%) per timeframe
Alignment tick when trend, structure, slope and momentum all agree
Use it to:
Frame bias top‑down (M→W→D→…→15m)
Time entries on your execution timeframe when the higher‑TF stack is aligned
Avoid counter‑trend traps when the table is mixed
2) Table anatomy (each column explained)
The table renders 9 columns × 8 rows (one row per timeframe label you define).
TF — The label you chose for that row (e.g., Month, Week, 4H). Cosmetic; helps you read the stack.
Trend — Arrow from fast MA vs slow MA: ↑ if fastMA > slowMA (up‑trend), ↓ otherwise (down‑trend). Cell is green for up, red for down.
Price Pos — One‑character structure cue:
🔼 if price is above both fast and slow MAs (bullish structure)
🔽 if price is below both (bearish structure)
– otherwise (between MAs / mixed)
MA Dist — Distance of price from the fast MA measured in ATR multiples:
XS < S < M < L < XL according to your thresholds (see §3.3). Useful for judging stretch/mean‑reversion risk and stop sizing.
MA Slope — The fast MA one‑bar slope:
↑ if fastMA - fastMA > 0
↓ if < 0
→ if = 0
Stoch %K — Rounded %K value (default 14‑1‑3). Background highlights when it aligns with the trend:
Green heat when trend up and %K ≤ oversold
Red heat when trend down and %K ≥ overbought Tooltip shows K and D values precisely.
Trend % — Composite score (0–100%), the dashboard’s confidence for that timeframe:
+20 if trendUp (fast>slow)
+20 if fast MA slope > 0
+20 if MACD up (signal definition in §2.8)
+20 if price above fast MA
+20 if price above slow MA
Background colours:
≥80 lime (strong alignment)
≥60 green (good)
≥40 orange (mixed)
<40 grey (weak/contrary)
MACD — 🟢 if EMA(12)−EMA(26) > its EMA(9), else 🔴. It’s a simple “momentum up/down” proxy.
Align — ✔ when everything is in gear for that trend direction:
For up: trendUp and price above both MAs and slope>0 and MACD up
For down: trendDown and price below both MAs and slope<0 and MACD down Tooltip spells this out.
3) Settings & how to tune them
3.1 Timeframes (TF1–TF8)
Inputs: TF1..TF8 hold the resolution strings used by request.security().
Defaults: M, W, D, 720, 480, 240, 60, 15 with display labels Month, Week, Day, 12H, 8H, 4H, 1H, 15m.
Tips
Keep a top‑down funnel (e.g., Month→Week→Day→H4→H1→M15) so you can cascade bias into entries.
If you scalp, consider D, 240, 120, 60, 30, 15, 5, 1.
Crypto weekends: consider 2D in place of W to reflect continuous trading.
3.2 Moving Average (MA) group
Type: EMA, SMA, WMA, RMA, HMA. Changes both fast & slow MA computations everywhere.
Fast Length: default 20. Shorten for snappier trend/slope & tighter “price above fast” signals.
Slow Length: default 200. Controls the structural trend and part of the score.
When to change
Swing FX/equities: EMA 20/200 is a solid baseline.
Mean‑reversion style: consider SMA 20/100 so trend flips slower.
Crypto/indices momentum: HMA 21 / EMA 200 will read slope more responsively.
3.3 ATR / Distance group
ATR Length: default 14; longer makes distance less jumpy.
XS/S/M/L thresholds: define the labels in column MA Dist. They are compared to |close − fastMA| / ATR.
Defaults: XS 0.25×, S 0.75×, M 1.5×, L 2.5×; anything ≥L is XL.
Usage
Entries late in a move often occur at L/XL; consider waiting for a pullback unless you are trading breakouts.
For stops, an initial SL around 0.75–1.5 ATR from fast MA often sits behind nearby noise; use your plan.
3.4 Stochastic group
%K Length / Smoothing / %D Smoothing: defaults 14 / 1 / 3.
Overbought / Oversold: defaults 70 / 30 (adjust to 80/20 for trendier assets).
Heat logic (column Stoch %K): highlights when a pullback aligns with the dominant trend (oversold in an uptrend, overbought in a downtrend).
3.5 View
Full Screen Table Mode: centers and enlarges the table (position.middle_center). Great for clean screenshots or multi‑monitor setups.
4) Signal logic (how each datapoint is computed)
Per‑TF data (via a single request.security()):
fastMA, slowMA → based on your MA Type and lengths
%K, %D → Stoch(High,Low,Close,kLen) smoothed by kSmooth, then %D smoothed by dSmooth
close, ATR(atrLen) → for structure and distance
MACD up → (EMA12−EMA26) > EMA9(EMA12−EMA26)
fastMA_prev → yesterday/previous‑bar fast MA for slope
TrendUp → fastMA > slowMA
Price Position → compares close to both MAs
MA Distance Label → thresholds on abs(close − fastMA)/ATR
Slope → fastMA − fastMA
Score (0–100) → sum of the five 20‑point checks listed in §2.7
Align tick → conjunction of trend, price vs both MAs, slope and MACD (see §2.9)
Important behaviour
HTF values are sampled at the execution chart’s bar close using Pine v6 defaults (no lookahead). So the daily row updates only when a daily bar actually closes.
5) How to trade with it (playbooks)
The table is a framework. Entries/exits still follow your plan (e.g., S/D zones, price action, risk rules). Use the table to know when to be aggressive vs patient.
Playbook A — Trend continuation (pullback entry)
Look for Align ✔ on your anchor TFs (e.g., Week+Day both ≥80 and green, Trend ↑, MACD 🟢).
On your execution TF (e.g., H1/H4), wait for Stoch heat with the trend (oversold in uptrend or overbought in downtrend), and MA Dist not at XL.
Enter on your trigger (break of pullback high/low, engulfing, retest of fast MA, or S/D first touch per your plan).
Risk: consider ATR‑based SL beyond structure; size so 0.25–0.5% account risk fits your rules.
Trail or scale at M/L distances or when score deteriorates (<60).
Playbook B — Breakout with confirmation
Mixed stack turns into broad green: Trend % jumps to ≥80 on Day and H4; MACD flips 🟢.
Price Pos shows 🔼 across H4/H1 (above both MAs). Slope arrows ↑.
Enter on the first clean base‑break with volume/impulse; avoid if MA Dist already XL.
Playbook C — Mean‑reversion fade (advanced)
Use only when higher TFs are not aligned and the row you trade shows XL distance against the higher‑TF context. Take quick targets back to fast MA. Lower win‑rate, faster management.
Playbook D — Top‑down filter for Supply/Demand strategy
Trade first retests only in the direction where anchor TFs (Week/Day) have Align ✔ and Trend % ≥60. Skip counter‑trend zones when the stack is red/green against you.
6) Reading examples
Strong bullish stack
Week: ↑, 🔼, S/M, slope ↑, %K=32 (green heat), Trend 100%, MACD 🟢, Align ✔
Day: ↑, 🔼, XS/S, slope ↑, %K=45, Trend 80%, MACD 🟢, Align ✔
Action: Look for H4/H1 pullback into demand or fast MA; buy continuation.
Late‑stage thrust
H1: ↑, 🔼, XL, slope ↑, %K=88
Day/H4: only 60–80%
Action: Likely overextended on H1; wait for mean reversion or multi‑TF alignment before chasing.
Bearish transition
Day flips from 60%→40%, Trend ↓, MACD turns 🔴, Price Pos “–” (between MAs)
Action: Stand aside for longs; watch for lower‑high + Align ✔ on H4/H1 to join shorts.
7) Practical tips & pitfalls
HTF closure: Don’t assume a daily row changed mid‑day; it won’t settle until the daily bar closes. For intraday anticipation, watch H4/H1 rows.
MA Type consistency: Changing MA Type changes slope/structure everywhere. If you compare screenshots, keep the same type.
ATR thresholds: Calibrate per asset class. FX may suit defaults; indices/crypto might need wider S/M/L.
Score ≠ signal: 100% does not mean “must buy now.” It means the environment is favourable. Still execute your trigger.
Mixed stacks: When rows disagree, reduce size or skip. The tool is telling you the market lacks consensus.
8) Customisation ideas
Timeframe presets: Save layouts (e.g., Swing, Intraday, Scalper) as indicator templates in TradingView.
Alternative momentum: Replace the MACD condition with RSI(>50/<50) if desired (would require code edit).
Alerts: You can add alert conditions for (a) Align ✔ changes, (b) Trend % crossing 60/80, (c) Stoch heat events. (Not shipped in this script, but easy to add.)
9) FAQ
Q: Why do I sometimes see a dash in Price Pos? A: Price is between fast and slow MAs. Structure is mixed; seek clarity before acting.
Q: Does it repaint? A: No, higher‑TF values update on the close of their own bars (standard request.security behaviour without lookahead). Intra‑bar they can fluctuate; decisions should be made at your bar close per your plan.
Q: Which columns matter most? A: For trend‑following: Trend, Price Pos, Slope, MACD, then Stoch heat for entries. The Score summarises, and Align enforces discipline.
Q: How do I integrate with ATR‑based risk? A: Use the MA Dist label to avoid chasing at extremes and to size stops in ATR terms (e.g., SL behind structure at ~1–1.5 ATR).

Order Blocks + Order-Flow ProxiesOrder Blocks + Order-Flow Proxies
This indicator combines structural analysis of order blocks with lightweight order-flow style proxies, providing a tool for chart annotation and contextual study. It is designed to help users visualize where significant structural shifts occur and how simple volume-based signals behave around those areas. The script does not guarantee profitable outcomes, nor does it issue financial advice. It is intended purely for research, learning, and discretionary use.
Conceptual Background
Order Blocks
An “order block” is a term often used to describe a zone on the chart where price left behind a significant reversal or imbalance before continuing strongly in the opposite direction. In practice, this can mean the last bullish or bearish candle before a strong breakout. Traders sometimes study these regions because they believe that unfilled resting orders may exist there, or simply because they mark important pivots in price structure. This indicator detects such moments by scanning for breaks of structure (BOS). When price pushes above or below recent swing levels with sufficient displacement, the script identifies the prior opposite candle as the potential order block.
Break of Structure
A break of structure in this context is defined when the closing price moves beyond the highest high or lowest low of a short lookback window. The script compares the magnitude of this break to an ATR-based displacement filter. This helps ensure that only meaningful moves are marked rather than small, random fluctuations.
Order-Flow Proxies
Traditional order flow analysis may use bid/ask data, footprint charts, or volume profiles. Because TradingView scripts cannot access true order-book data, this indicator instead uses proxy signals derived from standard chart data:
Delta (proxy): Estimated imbalance of buying vs. selling pressure, approximated using bar direction and volume.
Imbalance ratio: Normalizes delta by total volume, ranging between -1 and +1 in theory.
Cumulative Delta (CVD): Running sum of delta over time.
Effort vs. Result (EvR): A comparison between volume and actual bar movement, highlighting cases where large effort produced little result (or vice versa).
These are not real order-flow measurements, but rather simple mathematical constructs that mimic some of its logic.
How the Script Works
Detecting Break of Structure
The user specifies a swing length. When price closes above the recent high (for bullish BOS) or below the recent low (for bearish BOS), a potential shift is recorded.
To qualify, the breakout must exceed a displacement filter proportional to the ATR. This helps filter out weak moves.
Locating the Order Block Candle
Once a BOS is confirmed, the script looks back within a short window to find the last opposite-colored candle.
The high/low or open/close of that candle (depending on user settings) is marked as the potential order block zone.
Drawing and Maintaining Zones
Each order block is represented as a colored rectangle extending forward in time.
Bullish zones are teal by default, bearish zones are red.
Zones extend until invalidated (price closing or wicking beyond them, depending on user preference) or until a user-defined lifespan expires.
A pruning mechanism ensures that only the most recent set number of zones remain, preventing chart overload.
Monitoring Touches
The script checks whether the current bar’s range overlaps any existing order block.
If so, the “closest” zone is considered touched, and a label may appear on the chart.
Confirmation Filters
Touches can optionally be confirmed by order-flow proxies.
For a bullish confirmation, the following must align:
Imbalance ratio above threshold,
Delta EMA positive,
Effort vs. Result positive.
For a bearish confirmation, the opposite holds true.
Optionally, a higher-timeframe EMA slope filter can gate these confirmations. For example, a bullish confirmation may only be accepted if the higher-timeframe EMA is sloping upward.
Alerts
Users may create alerts based on conditions such as “bullish touch confirmed” or “bearish touch confirmed.”
Alerts can be gated to only fire after bar close, reducing intrabar noise.
Standard alertcondition calls are provided, and optional inline alert() calls can be enabled.
Inputs and Customization
Structure & OB
Swing length: Defines how many bars back to check for BOS.
ATR length & displacement factor: Adjust sensitivity for structural breaks.
Body vs. wick reference: Choose whether zones are based on candle bodies or full ranges.
Invalidation rule: Pick between wick breach or close beyond the level.
Lifespan (bars): Limit how long a zone remains active.
Max keep: Cap the number of zones stored to reduce clutter.
Order-Flow Proxies
Delta mode: Choose between “Close vs Previous Close” or “Body” for delta calculation.
EMA length: Smooths the delta/imbalance series.
Z-score lookback: Defines the averaging window for EvR.
Confirmation thresholds: Adjust the imbalance levels required for long/short confirmation.
Higher Timeframe Filter
Enable HTF gate: Optional filter requiring higher-timeframe EMA slope alignment.
HTF timeframe & EMA length: Configurable for context alignment.
Style
Colors and transparency for bullish and bearish zones.
Border color customization.
Alerts
Enable inline alerts: Optional direct calls to alert().
Alerts on bar close only: Helps avoid multiple firings during bar formation.
Practical Use
This tool is best seen as a way to annotate charts and to study how simple volume-derived signals behave near important structural levels. Some users may:
Observe whether order blocks line up with later price reactions.
Study how imbalance or cumulative delta conditions align with these zones.
Use it in a discretionary workflow to highlight areas of interest for deeper analysis.
Because the proxies are based only on candle OHLCV data, they are approximations. They cannot replace true depth-of-market analysis. Similarly, order block detection here is one specific algorithmic interpretation; other traders may define order blocks differently.
Limitations and Disclaimers
This indicator does not predict future price movement.
It does not access real order book or tick-by-tick data. All signals are derived from bar OHLCV.
Past performance of signals or zones does not guarantee future results.
The script is for educational and informational purposes only. It is not financial advice.
Users should test thoroughly, adjust parameters to their own instruments and timeframes, and use it in combination with broader analysis.
Summary
The Order Blocks + Order-Flow Proxies script is an experimental study tool that:
Detects potential order blocks using a displacement-filtered break of structure.
Marks these zones as boxes that persist until invalidation or expiry.
Provides lightweight order-flow-style proxies such as delta, imbalance, CVD, and effort vs. result.
Allows confirmation of zone touches through these proxies and optional higher-timeframe context.
Offers flexible customization, alerting, and chart-style options.
It is not a trading system by itself but rather a framework for studying price/volume behavior around structurally significant areas. With careful exploration, it can give users new ways to visualize market structure and to understand how simple flow-like measures behave in those contexts.
