KillZones + ACD Fisher [TradingFinder] Sessions + Reversal Level🔵 Introduction
🟣 ACD Method
"The Logical Trader" opens with a thorough exploration of the ACD Methodology, which focuses on pinpointing particular price levels associated with the opening range.
This approach enables traders to establish reference points for their trades, using "A" and "C" points as entry markers. Additionally, the book covers the concept of the "Pivot Range" and how integrating it with the ACD method can help maximize position size while minimizing risk.
🟣 Session
The forex market is operational 24 hours a day, five days a week, closing only on Saturdays and Sundays. Typically, traders prefer to concentrate on one specific forex trading session rather than attempting to trade around the clock.
Trading sessions are defined time periods when a particular financial market is active, allowing for the execution of trades.
The most crucial trading sessions within the 24-hour cycle are the Asia, London, and New York sessions, as these are when substantial money flows and liquidity enter the market.
🟣 Kill Zone
Traders in financial markets earn profits by capitalizing on the difference between their buy/sell prices and the prevailing market prices.
Traders vary in their trading timelines.Some traders engage in daily or even hourly trading, necessitating activity during periods with optimal trading volumes and notable price movements.
Kill zones refer to parts of a session characterized by higher trading volumes and increased price volatility compared to the rest of the session.
🔵 How to Use
🟣 Session Times
The "Asia Session" comprises two parts: "Sydney" and "Tokyo." This session begins at 23:00 and ends at 06:00 UTC. The "Asia KillZone" starts at 23:00 and ends at 03:55 UTC.
The "London Session" includes "Frankfurt" and "London," starting at 07:00 and ending at 14:25 UTC. The "London KillZone" runs from 07:00 to 09:55 UTC.
The "New York" session starts at 14:30 and ends at 19:25 UTC, with the "New York am KillZone" beginning at 14:30 and ending at 22:55 UTC.
🟣 ACD Methodology
The ACD strategy is versatile, applicable to various markets such as stocks, commodities, and forex, providing clear buy and sell signals to set price targets and stop losses.
This strategy operates on the premise that the opening range of trades holds statistical significance daily, suggesting that initial market movements impact the market's behavior throughout the day.
Known as a breakout strategy, the ACD method thrives in volatile or strongly trending markets like crude oil and stocks.
Some key rules for employing the ACD strategy include :
Utilize points A and C as critical reference points, continually monitoring these during trades as they act as entry and exit markers.
Analyze daily and multi-day pivot ranges to understand market trends. Prices above the pivots indicate an upward trend, while prices below signal a downward trend.
In forex trading, the ACD strategy can be implemented using the ACD indicator, a technical tool that gauges the market's supply and demand balance. By evaluating trading volume and price, this indicator assists traders in identifying trend strength and optimal entry and exit points.
To effectively use the ACD indicator, consider the following :
Identifying robust trends: The ACD indicator can help pinpoint strong, consistent market trends.
Determining entry and exit points: ACD generates buy and sell signals to optimize trade timing.
Bullish Setup :
When the "A up" line is breached, it’s wise to wait briefly to confirm it’s not a "Fake Breakout" and that the price stabilizes above this line.
Upon entering the trade, the most effective stop loss is positioned below the "A down" line. It's advisable to backtest this to ensure the best outcomes. The recommended reward-to-risk ratio for this strategy is 1, which should also be verified through backtesting.
Bearish Setup :
When the "A down" line is breached, it’s prudent to wait briefly to ensure it’s not a "Fake Breakout" and that the price stabilizes below this line.
Upon entering the trade, the most effective stop loss is positioned above the "A up" line. Backtesting is recommended to confirm the best results. The recommended reward-to-risk ratio for this strategy is 1, which should also be validated through backtesting.
Advantages of Combining Kill Zone and ACD Method in Market Analysis :
Precise Trade Timing : Integrating the Kill Zone strategy with the ACD Method enhances precision in trade entries and exits. The ACD Method identifies key points for trading, while the Kill Zone focuses on high-activity periods, together ensuring optimal timing for trades.
Better Trend Identification : The ACD Method’s pivot ranges help spot market trends, and when combined with the Kill Zone’s emphasis on periods of significant price movement, traders can more effectively identify and follow strong market trends.
Maximized Profits and Minimized Risks : The ACD Method's structured approach to setting price targets and stop losses, coupled with the Kill Zone's high-volume trading periods, helps maximize profit potential while reducing risk.
Robust Risk Management : Combining these methods provides a comprehensive risk management strategy, strategically placing stop losses and protecting capital during volatile periods.
Versatility Across Markets : Both methods are applicable to various markets, including stocks, commodities, and forex, offering flexibility and adaptability in different trading environments.
Enhanced Confidence : Using the combined insights of the Kill Zone and ACD Method, traders gain confidence in their decision-making process, reducing emotional trading and improving consistency.
By merging the Kill Zone’s focus on trading volumes and the ACD Method’s structured breakout strategy, traders benefit from a synergistic approach that enhances precision, trend identification, and risk management across multiple markets.
In den Scripts nach "收集一只股票30个交易日的成交量、开盘价、最高价和最低价和收盘价" suchen

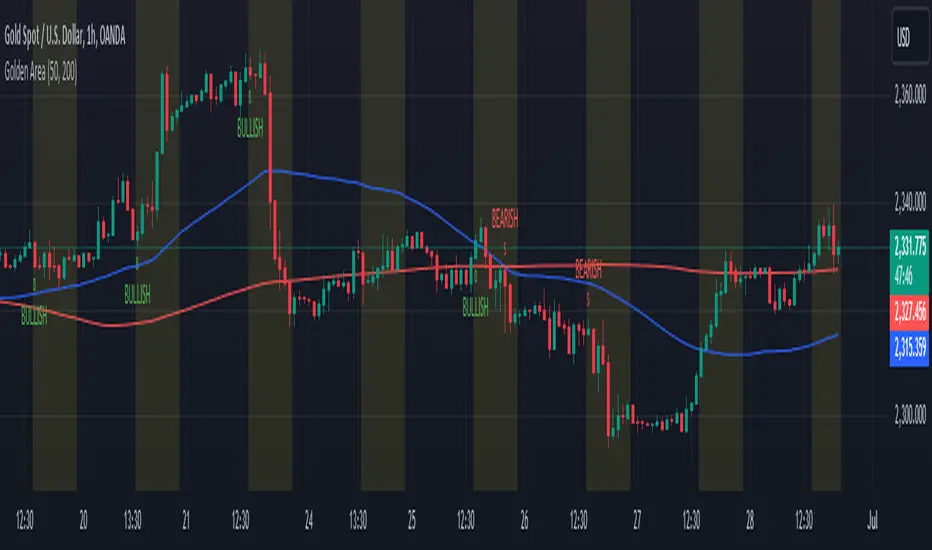
Golden Area### Golden Area Indicator Description
The "Golden Area" indicator is a technical analysis tool designed to assist traders by identifying potential buy and sell signals based on moving averages and support/resistance levels within a specific time frame. This indicator can be applied directly to price charts.
#### How It Works
1. **Inputs:**
- **MA50 Length:** The period length for the 50-period Simple Moving Average (SMA).
- **MA200 Length:** The period length for the 200-period Simple Moving Average (SMA).
2. **Calculations:**
- **MA50 (50-period SMA):** Calculated by averaging the closing prices over the past 50 periods.
- **MA200 (200-period SMA):** Calculated by averaging the closing prices over the past 200 periods.
- **Support Level:** The lowest price over the last 50 periods.
- **Resistance Level:** The highest price over the last 50 periods.
3. **Time Filter:**
- **Start Time:** The indicator becomes active at 12:30 IST (07:00 UTC).
- **End Time:** The indicator deactivates at 10:30 IST the next day (05:00 UTC).
- A background color change (yellow) highlights the active time range on the chart.
4. **Signals:**
- **Buy Signal:** Triggered when the current time matches the start time and the closing price is below the support level.
- **Sell Signal:** Triggered when the current time matches the start time and the closing price is above the resistance level.
5. **Plots:**
- **MA50:** Plotted as a blue line on the chart.
- **MA200:** Plotted as a red line on the chart.
- **Buy Signals:** Indicated by a green 'B' below the bars.
- **Sell Signals:** Indicated by a red 'S' above the bars.
This indicator provides visual cues for potential trading opportunities within the specified time frame, aiding traders in making informed decisions.
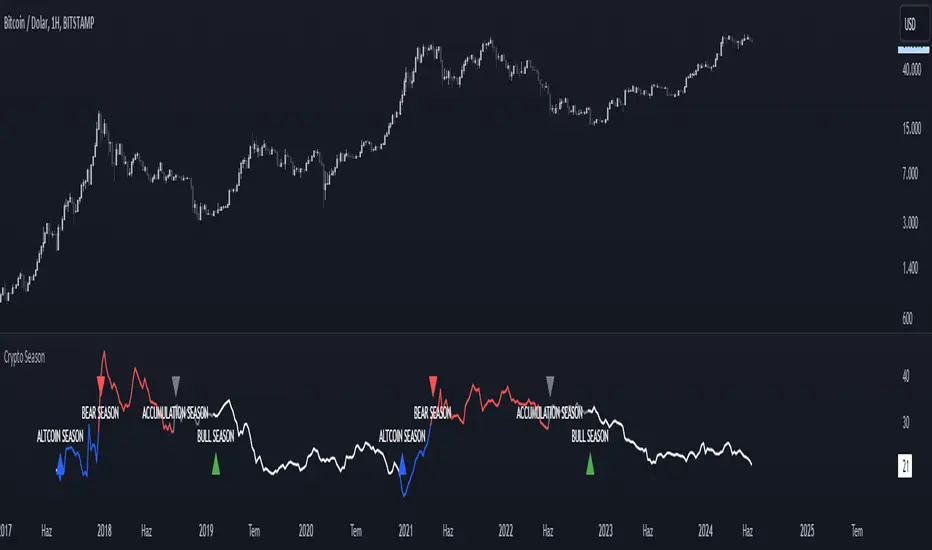
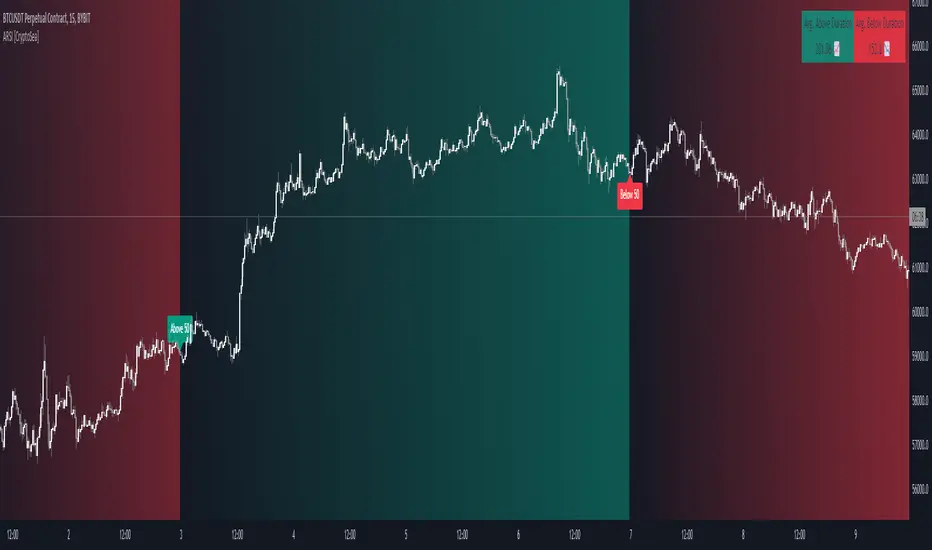
Crypto SeasonDefinition
This indicator is an informative indicator aiming to predict when the Altcoin season will start and when Bitcoin will enter the month season.
The average of the graph shows the dominance of altcoins other than BTC, ETH and USDT. If this value is over 30, the BTC says that the bull season is over. This value indicates that 20 to 30 BTC is in the bull season or accumulation. If this value is less than 20, it means that the subcoin season has begun.
Disclaimer
This indicator is for informational purposes only and should be used for educational purposes only. You may lose money if you rely on this to trade without additional information. Use at your own risk.
Version
v1.0
Support and Resistance [CryptoSea]The Support and Resistance Indicator is a powerful tool developed by CryptoSea for traders seeking to identify key market levels with precision. This script leverages advanced pivot and volume analysis to highlight support and resistance zones on the price chart.
Key Features
Multi-Source Pivot Analysis: Choose between wicks or body prices for calculating pivot points, providing flexibility in market analysis.
Volume Spike Detection: Automatically identifies volume spikes using a customizable threshold multiplier, enhancing the accuracy of support and resistance levels.
Dynamic Box Display: Configurable options for extending and graying out boxes based on price interaction, ensuring a clear visual representation of active and invalidated zones.
In the example below, we see a resistance box formed based on wick highs and a volume spike. The box extends to where we see price rejecting from it. In the settings you can change this so the box will stop if price touches it if you prefer.
How it Works
Pivot Point Calculation: The script determines pivot highs and lows using either wicks or body prices over a specified term (Short, Medium, Long), corresponding to 5, 15, or 30 bars.
Volume Analysis: Calculates average volume over twice the pivot length and identifies volume spikes exceeding the user-defined threshold, crucial for confirming support and resistance levels.
Box Management: Maintains arrays of support and resistance boxes, limiting the number based on user settings (All, Recent Few, Recent Several).
Settings Explained
Source: Choose between 'Wicks' or 'Bodies' to determine whether pivot points are calculated using candle wicks or body prices.
Pivot Term: Select 'Short' (5 bars), 'Medium' (15 bars), or 'Long' (30 bars) to adjust the distance for pivot calculation. Longer terms take more bars to confirm support/resistance.
Volume Threshold (multiplier): Set a multiplier of average volume to detect volume spikes, essential for validating support/resistance levels.
Extend Until Price Hits: Enable this to extend support/resistance boxes until the price touches them, providing dynamic levels.
Gray Out Boxes Once Hit: Enable this to gray out the boxes once the price interacts with them, indicating that they are no longer active.
Max Boxes Displayed: Choose 'All', 'Recent Few' (up to 3 boxes each for bull and bear), or 'Recent Several' (up to 10 boxes each for bull and bear) to control the number of visible boxes.
Invalidate Condition: Select 'Touch' to invalidate a box when the price touches it or 'Through' to invalidate when the price passes entirely through the box.
Candle Colors: Option to color candles based on neutral, bullish, or bearish conditions for easier visual analysis.
Application
Strategic Planning: Assists traders in pinpointing potential entry and exit points by marking significant support and resistance zones.
Trend Confirmation: Validates trend strength and potential reversals with volume-based analysis of support and resistance levels.
Customizable Settings: Tailors analysis to various trading strategies with extensive input settings for pivot source, term, volume threshold, and display preferences.
The Support and Resistance Indicator by is an essential addition to any trader’s toolkit, offering robust and customizable market level analysis for improved trading decisions.

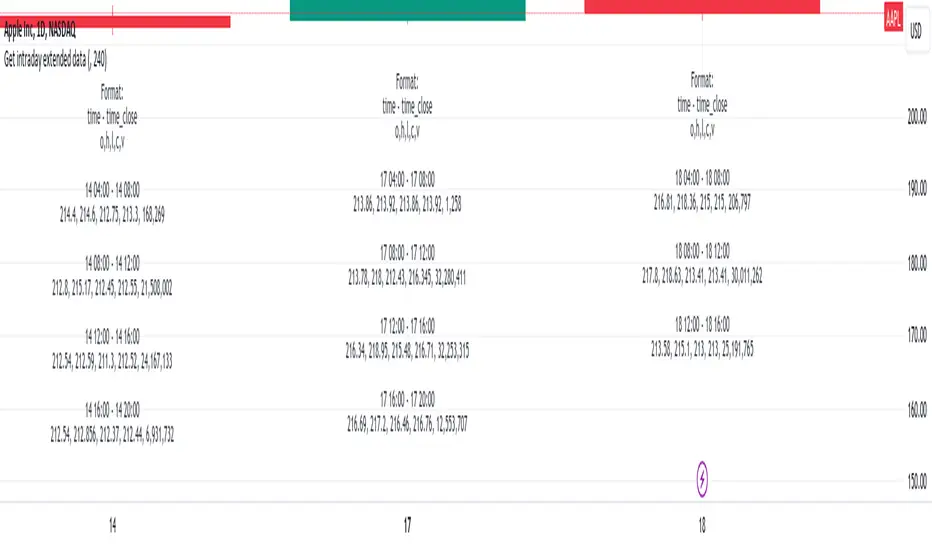
Get intraday extended dataIf you have interacted with Pine for some time, you probably noticed that if you are using DWM resolutions, you will not be able to obtain complete data from the extended intraday ticker using the usual functions request.security() and request.security_lower_tf(). This is quite logical if you understand the principle of mapping data from the secure context to the main one. The main reason is the different opening and closing times of the intraday data with extended clocks and DWM.
This script visualizes one of the approaches to solving this problem. I will briefly describe the principle of operation:
For example, take the symbol NASDAQ:AAPL.
Our main resolution is 1D, but we want to receive extended data from a 4-hour interval. The daytime bar opens at 09:30 and closes at 16:00. The same period at a resolution of 4 hours covers 4 bars:
04:00 - 08:00
08:00 - 12:00
12:00 - 16:00
16:00 - 20:00
So, if we use the request.security_lower_tf() function, we will not get the bars 04:00 - 08:00 and 16:00 - 20:00 because their closing times are not within the range of the main context (09:30 - 16:00).
If we use the request.security() function, we will get the bar 04:00 - 08:00, but we will not get the bar 16:00 - 20:00 because its closing time will be in the future, and it is impossible to get values from the future.
So, what I propose is to use the upgraded request.security() function, inside which another function will be executed, storing all the bars in a var array and putting the post-market bars in the array of the next day. Next, all we have to do is isolate these bars, place them in the previous array, and remove them from the current one.
I visualized the received data simply as text, but you can do it differently using the proposed mechanism.
In order for everything to work, you need to fill in the inputs correctly:
"Symbol for calculate" - This is the symbol from which we will receive extended data.
"Intraday data period" - The period from which we will receive extended data.
"Specify your chart timeframe here" - This is an input that allows you to operate with data from the main context while being inside the secure one. Enter your current chart timeframe here. If there are problems, a warning will appear informing you about this.
If you want to use these developments, take the get_data() function, it will return:
1. the number of past items - it is useful for outputting values in real time, because it is not possible to simply delete them there, because they will always arrive and it is easier to make a slice with an indentation for this number
2. cleared object of type Inner_data containing arrays of open, high, low, close, volume, time, time_close intraday data
3. its same value from the previous bar
Ratio Chart with GMMA■About this indicator
This indicator divides the selected stocks by any stocks you specify and plots the result in a new pane.
At the same time, it plots the GMMA against the result of the division.
This allows you to see the relative chart and trend of the selected stock and the arbitrary stock.
Quote Symbol: Specify the denominator of the division. The default is TOPIX. Feel free to change it.
EMA Days: 5 to 30 days are indicated in green, and 75 to 200 days in red. Change the number of days and color freely.
Explanation of Effective Usage
It is recommended to enter an index for stocks specified in the Quote Symbol.
By entering the index, you can check the superiority of the selected issue and the index at a glance.
Example: By dividing AAPL by SP500, you can see on the chart whether AAPL is stronger or weaker relative to SP500.
(Similar concept to the Relative Strength Comparison RSC.)
At the same time, by plotting GMMA, you can confirm the trend of strength or weakness of the selected issue divided by the index. This is useful for swing trading and mid- to long-term trading.
The greater the distance between the short-term and long-term EMAs of the GMMA, the more the selected stocks outperform the index, and when the short-term and long-term EMAs cross, the trend ends and the stock underperforms the index.
■About the Chart
The screen below shows a chart plotted using this indicator.
For comparison with the regular chart, the upper screen shows only the GMMA plotted for the selected stocks.
From the red circle in the lower screen, a trend begins where the selected stocks outperform the index, and the trend ends at the blue circle.
When the trend ends, the selected stocks will underperform the index and it can be determined that it is more efficient to invest in another stock.
■このインジケーターについて
このインジケーターは選択している銘柄を、指定した任意の銘柄で割り算し、その結果を新規ペインにプロットします。
同時に、割り算の結果に対してGMMAをプロットします。
これにより選択した銘柄と、任意の銘柄の相対チャートとトレンドを把握することが出来ます。
Quote Symbol:割り算の分母を指定します。デフォルトはTOPIXです。自由に変更して下さい。
EMA日数:5~30日が緑、75~200日を赤で表記しています。日数と色は自由に変更して下さい。
■有効な使い方の説明
Quote Symbolで指定する銘柄は、指数を入力することを推奨します。
指数を入力することによって、選択した銘柄と指数の優位性を一目で確認出来ます。
例)AAPLをSP500で割ることで、SP500に比べてAAPLが相対的に強いのか、弱いのかをチャートで把握できます。
(相対力比較RSCと似たような考え方です。)
同時にGMMAをプロットすることで、選択した銘柄÷指数の強弱のトレンドを確認できます。これはスイングトレードや中長期トレードに役立ちます。
GMMAの短期EMAと長期EMAの距離が開いていくほど、指数より選択した銘柄がアウトパフォームしていると考えられ、短期EMAと長期EMAが交わるとトレンドは終了し、指数をアンダーパフォームします。
■チャートについて
下の画面がこのインジケーターを使用してプロットしたチャートです。
通常のチャートとの比較のため、上画面には選択した銘柄にGMMAだけをプロットしたものを表示しています。
下の画面の赤い丸から、選択した銘柄が指数をアウトパフォームするトレンドが始まり、青い〇でトレンドは終了します。
トレンドが終了した場合、選択した銘柄は指数をアンダーパフォームするので、別の銘柄に投資する方が効率的と判断できます。

Intellect_city - Halvings Bitcoin CycleWhat is halving?
The halving timer shows when the next Bitcoin halving will occur, as well as the dates of past halvings. This event occurs every 210,000 blocks, which is approximately every 4 years. Halving reduces the emission reward by half. The original Bitcoin reward was 50 BTC per block found.
Why is halving necessary?
Halving allows you to maintain an algorithmically specified emission level. Anyone can verify that no more than 21 million bitcoins can be issued using this algorithm. Moreover, everyone can see how much was issued earlier, at what speed the emission is happening now, and how many bitcoins remain to be mined in the future. Even a sharp increase or decrease in mining capacity will not significantly affect this process. In this case, during the next difficulty recalculation, which occurs every 2014 blocks, the mining difficulty will be recalculated so that blocks are still found approximately once every ten minutes.
How does halving work in Bitcoin blocks?
The miner who collects the block adds a so-called coinbase transaction. This transaction has no entry, only exit with the receipt of emission coins to your address. If the miner's block wins, then the entire network will consider these coins to have been obtained through legitimate means. The maximum reward size is determined by the algorithm; the miner can specify the maximum reward size for the current period or less. If he puts the reward higher than possible, the network will reject such a block and the miner will not receive anything. After each halving, miners have to halve the reward they assign to themselves, otherwise their blocks will be rejected and will not make it to the main branch of the blockchain.
The impact of halving on the price of Bitcoin
It is believed that with constant demand, a halving of supply should double the value of the asset. In practice, the market knows when the halving will occur and prepares for this event in advance. Typically, the Bitcoin rate begins to rise about six months before the halving, and during the halving itself it does not change much. On average for past periods, the upper peak of the rate can be observed more than a year after the halving. It is almost impossible to predict future periods because, in addition to the reduction in emissions, many other factors influence the exchange rate. For example, major hacks or bankruptcies of crypto companies, the situation on the stock market, manipulation of “whales,” or changes in legislative regulation.
---------------------------------------------
Table - Past and future Bitcoin halvings:
---------------------------------------------
Date: Number of blocks: Award:
0 - 03-01-2009 - 0 block - 50 BTC
1 - 28-11-2012 - 210000 block - 25 BTC
2 - 09-07-2016 - 420000 block - 12.5 BTC
3 - 11-05-2020 - 630000 block - 6.25 BTC
4 - 20-04-2024 - 840000 block - 3.125 BTC
5 - 24-03-2028 - 1050000 block - 1.5625 BTC
6 - 26-02-2032 - 1260000 block - 0.78125 BTC
7 - 30-01-2036 - 1470000 block - 0.390625 BTC
8 - 03-01-2040 - 1680000 block - 0.1953125 BTC
9 - 07-12-2043 - 1890000 block - 0.09765625 BTC
10 - 10-11-2047 - 2100000 block - 0.04882813 BTC
11 - 14-10-2051 - 2310000 block - 0.02441406 BTC
12 - 17-09-2055 - 2520000 block - 0.01220703 BTC
13 - 21-08-2059 - 2730000 block - 0.00610352 BTC
14 - 25-07-2063 - 2940000 block - 0.00305176 BTC
15 - 28-06-2067 - 3150000 block - 0.00152588 BTC
16 - 01-06-2071 - 3360000 block - 0.00076294 BTC
17 - 05-05-2075 - 3570000 block - 0.00038147 BTC
18 - 08-04-2079 - 3780000 block - 0.00019073 BTC
19 - 12-03-2083 - 3990000 block - 0.00009537 BTC
20 - 13-02-2087 - 4200000 block - 0.00004768 BTC
21 - 17-01-2091 - 4410000 block - 0.00002384 BTC
22 - 21-12-2094 - 4620000 block - 0.00001192 BTC
23 - 24-11-2098 - 4830000 block - 0.00000596 BTC
24 - 29-10-2102 - 5040000 block - 0.00000298 BTC
25 - 02-10-2106 - 5250000 block - 0.00000149 BTC
26 - 05-09-2110 - 5460000 block - 0.00000075 BTC
27 - 09-08-2114 - 5670000 block - 0.00000037 BTC
28 - 13-07-2118 - 5880000 block - 0.00000019 BTC
29 - 16-06-2122 - 6090000 block - 0.00000009 BTC
30 - 20-05-2126 - 6300000 block - 0.00000005 BTC
31 - 23-04-2130 - 6510000 block - 0.00000002 BTC
32 - 27-03-2134 - 6720000 block - 0.00000001 BTC

Relative Momentum Index with Laguerre FilterThe Relative Momentum Index
The Relative Momentum Index (RMI) is an oscillator that is a variation of the Relative Strength Index (RSI), but incorporates momentum over a variable lookback period rather than just consecutive price changes, which can help identify reversals and filter out noise.
It measures the momentum of price changes over a specified period, rather than just the magnitude of price changes like the RSI does.
It counts up and down days from the current closing price relative to the closing price a certain number of days ago (e.g. 5 days ago), instead of just comparing consecutive daily closes like the RSI
It is calculated by taking the ratio of the average upward price changes to the average downward price changes over a given period, where each change is measured from the close X days ago (X is the “momentum” period)
Like the RSI, the RMI oscillates between 0 and 100, with readings above 70 considered overbought and below 30 oversold.
In trending markets, the RMI tends to remain in overbought or oversold territory for extended periods. In trading ranges, it oscillates more predictably between the overbought and oversold levels.
The RMI is generally considered better than the RSI at identifying potential reversal points, as it incorporates a momentum factor rather than just strength.
It can be used in a similar way to the RSI for trade signals, such as buying when it rises above 30 from below, or selling when it falls below 70 from above
The Laguerre filter
A Laguerre filter is a type of infinite impulse response (IIR) filter used for smoothing signals or data. The Laguerre filter provides a way to apply variable smoothing to a signal by adjusting its pole position, allowing you to control the balance between smoothness and lag based on your preferences. It is an alternative to simple moving averages that can better preserve the shape of the original signal.

Super Trend and RSI Strategy### Super Trend and RSI Strategy: A Brief Overview
The Super Trend and RSI (Relative Strength Index) strategy is a popular trading approach that combines the trend-following capabilities of the Super Trend indicator with the momentum analysis of the RSI. This hybrid strategy aims to provide traders with reliable entry and exit signals by confirming trends and identifying potential reversals.
#### Super Trend Indicator
The Super Trend indicator is a trend-following tool that signals the current market direction. It is calculated using the Average True Range (ATR) to identify volatility and price movement. The indicator plots lines above or below the price, signaling bullish (green) or bearish (red) trends:
- **Buy Signal**: When the price crosses above the Super Trend line and the line turns green.
- **Sell Signal**: When the price crosses below the Super Trend line and the line turns red.
#### Relative Strength Index (RSI)
The RSI is a momentum oscillator that measures the speed and change of price movements on a scale from 0 to 100. It helps identify overbought or oversold conditions:
- **Overbought Condition**: RSI value above 70, suggesting the asset may be overvalued and a correction could be imminent.
- **Oversold Condition**: RSI value below 30, suggesting the asset may be undervalued and a rebound could be imminent.
#### Strategy Implementation
1. **Trend Confirmation with Super Trend**:
- Enter a long position (buy) when the Super Trend turns green and the price closes above it.
- Enter a short position (sell) when the Super Trend turns red and the price closes below it.
2. **Momentum Confirmation with RSI**:
- For long positions, ensure the RSI is not in the overbought zone (preferably below 70).
- For short positions, ensure the RSI is not in the oversold zone (preferably above 30).
3. **Entry Signals**:
- **Buy Signal**: Super Trend turns green, price closes above the Super Trend line, and RSI is below 70.
- **Sell Signal**: Super Trend turns red, price closes below the Super Trend line, and RSI is above 30.
4. **Exit Signals**:
- Close long positions when the Super Trend turns red or the RSI enters the overbought zone.
- Close short positions when the Super Trend turns green or the RSI enters the oversold zone.
#### Advantages and Considerations
- **Advantages**:
- Combines trend-following and momentum analysis for more robust signals.
- Helps filter out false signals by requiring confirmation from both indicators.
- **Considerations**:
- Like all trading strategies, it is not foolproof and can generate false signals.
- Best used in conjunction with other analysis techniques and proper risk management.
- Performance can vary across different market conditions and timeframes.
The Super Trend and RSI strategy is a versatile tool that can enhance trading decisions by providing clearer entry and exit points, helping traders capture significant market moves while avoiding potential pitfalls of relying on a single indicator.

Korneev Reverse RSIRethinking the Legendary Relative Strength Index by John Welles Wilder
The essence of the new approach lies in the reverse use of the so-called "overbought" and "oversold" zones. In his 1978 book, "New Concepts in Technical Trading Systems," where the RSI mechanism was thoroughly described, Wilder writes that one way to use the oscillator is to open a long position when the RSI drops into oversold territory (below 30) and to open a short position when the RSI rises to overbought levels (above 70). However, backtesting this strategy with such inputs yields rather mediocre results.
Based on the calculation formula, the RSI calculates the rate of price change over a certain period. Therefore, overbought and oversold zones will have relative significance (relative to the set calculation period). It is no coincidence that the word "relative" was added to the name of the oscillator. It is worth accepting as an axiom the assertion that the price of an asset is fair at every moment in time.
Essentially, the RSI calculates the strength of a trend. If the oscillator value is above 70, it is highly likely that an upward movement is occurring in the market. Therefore, in the current strategy, a long position is opened precisely at the moment of greatest buyer strength (when RSI > 80), i.e., in the direction of the trend, since counter-trend trading with the RSI has proven to be ineffective. The position is closed after the buyers lose their advantage and the RSI drops to 40.
The strategy is recommended to be used only with long positions, as short positions show negative results. The strategy uses a moving average for the RSI with a period of 14 to smooth the oscillator data.
--------------------------------------------------------------------------------------------
Переосмысление легендарного осциллятора Relative strength index Джона Уэллса Уайлдера
Суть нового подхода заключается в реверсивном использовании так называемых зон "перекупленности" и "перепроданности". В своей книге от 1978 года "New concepts in tecnical trading systems", в которой был подробно описан механизм работы RSI, Уайлдер пишет, что один из способов использования осциллятора - открытие длинной позиции при снижении RSI в перепроданность (ниже 30) и открытие короткой позиции при повышении RSI до перекупленности (выше 70). Однако бэктест стратегии с такими вводными дает весьма посредственные результаты.
Исходя из формулы расчета, RSI рассчитывает скорость изменения цены за определенный период. Поэтому зоны перекупленности и перепроданности будут иметь относительное значение (относительно установленного периода расчета). Не зря ведь в названии осциллятора было добавлено слово "относительной". Стоит принять за аксиому утверждение, что цена актива справедлива в каждый момент времени.
По сути, RSI рассчитывает силу тренда. Если значение осциллятора выше 70, то на рынке с высокой долей вероятности происходит восходящее движение. Поэтому в текущей стратегии открытие лонга происходит именно в момент наибольшей силы покупателей (когда RSI > 80), то есть в сторону тренда, поскольку контртрендовая торговля по RSI показала свою несостоятельность. Закрытие позиции происходит после того, как покупатели теряют преимущество и RSI снижается до 40.
Стратегию рекомендуется использовать только с длинными позициями, поскольку короткие позиции показывают отрицательный результат. В стратегии используется скользящая средняя для RSI с периодом 14 для сглаживания данных осциллятора.

Forex SessionThis Trading View script highlights the trading sessions for New York, European, and Asian markets on the chart and adds labels at the start of each session. The script uses Pine Script version 5 and converts local session times to UTC to accurately display the session times regardless of your local Time zone.
Features :
Session Times:
New York: 8:30 AM to 3:00 PM (Eastern Time, GMT-4)
European: 8:00 AM to 4:30 PM (London Time, GMT+1)
Asian: 9:00 AM to 6:00 PM (Tokyo Time, GMT+9)
Background Highlighting: The script shades the background for each session.
New York Session: Blue
European Session: Green
Asian Session: Red
Today's sessions are shaded with 90% opacity.
Tomorrow's sessions are shaded with 70% opacity.
How It Works :
Session Times Conversion: The script converts the session times from local timezones to UTC
using the timestamp function.
Background Coloring: The bgcolor function is used to shade the background for each session.
VAMSI ADVANCE Entry HelperThe "VAMSI Entry Helper" indicator is designed to assist traders in identifying potential entry points in the market by analyzing price equilibrium and liquidity equilibrium using a combination of Relative Strength Index (RSI) and moving averages. Here’s a detailed description of its components and functionality:
Components of the Indicator:
RSI (Relative Strength Index):
RSI Length: This parameter (rsiLengthInput) controls the period over which the RSI is calculated. It is set to 50 by default, but you can adjust it as needed.
RSI Source: The source of the price data for calculating the RSI, which is the closing price by default.
Moving Average (MA):
MA Type: You can choose between Simple Moving Average (SMA) and Exponential Moving Average (EMA) for smoothing the RSI values.
MA Length: This parameter (maLengthInput) controls the period over which the moving average of the RSI is calculated. It is set to 60 by default.
Functionality:
RSI Calculation:
The script calculates the RSI based on the selected source and length. RSI is a momentum oscillator that measures the speed and change of price movements and oscillates between 0 and 100.
The RSI calculation involves computing the average gains and losses over the specified period (rsiLengthInput), and then applying the RSI formula.
Moving Average of RSI:
After calculating the RSI, the indicator computes a moving average of the RSI values using the specified type (SMA or EMA) and length (maLengthInput). This smoothed RSI helps in identifying the equilibrium of liquidity.
Plots:
RSI Plot: The RSI values are plotted on the chart with a purple line (#4B0082), providing a visual representation of price equilibrium.
MA Plot: The moving average of the RSI is plotted with a black line, showing the smoothed trend of the RSI.
Middle Band: A horizontal line at the 50 level is plotted as a reference point, indicating the midpoint of the RSI scale. This can help in identifying overbought and oversold conditions.
Use Case:
Price Equilibrium: The RSI plot helps traders identify when the price is relatively strong or weak. RSI values above 70 may indicate an overbought condition, while values below 30 may indicate an oversold condition.
Liquidity Equilibrium: The moving average of the RSI provides a smoothed view of the RSI, helping traders see the overall trend of liquidity equilibrium.
Example Usage:
Entry Points: Traders might look for entry points when the RSI crosses above or below its moving average, indicating potential changes in momentum.
Overbought/Oversold Conditions: Traders can use the RSI values along with the middle band (50) to identify overbought (RSI > 70) and oversold (RSI < 30) conditions.
Customization:
RSI Length: Adjustable to fit different trading strategies and timeframes.
Source: You can change the source data for the RSI calculation (e.g., close, open, high, low).
MA Type and Length: You can choose between SMA and EMA and adjust the period to better fit your trading style.
This indicator provides a comprehensive tool for traders to analyze price and liquidity equilibrium, helping them make informed decisions about entry points in the market.

Multi-Timeframe Trend Following with 200 EMA Filter - Longs OnlyOverview
This strategy is designed to trade long positions based on multiple timeframe Exponential Moving Averages (EMAs) and a 200 EMA filter. The strategy ensures that trades are only entered in strong uptrends and aims to capitalize on sustained upward movements while minimizing risk with a defined stop-loss and take-profit mechanism.
Key Components
Initial Capital and Position Sizing
Initial Capital: $1000.
Lot Size: 1 unit per trade.
Inputs
Fast EMA Length (fast_length): The period for the fast EMA.
Slow EMA Length (slow_length): The period for the slow EMA.
200 EMA Length (filter_length_200): Set to 200 periods for the primary trend filter.
Stop Loss Percentage (stop_loss_perc): Set to 1% of the entry price.
Take Profit Percentage (take_profit_perc): Set to 3% of the entry price.
Timeframes and EMAs
EMAs are calculated for the following timeframes using the request.security function:
5-minute: Short-term trend detection.
15-minute: Intermediate-term trend detection.
30-minute: Long-term trend detection.
The strategy also calculates a 200-period EMA on the 5-minute timeframe to serve as a primary trend filter.
Trend Calculation
The strategy determines the trend for each timeframe by comparing the fast and slow EMAs:
If the fast EMA is above the slow EMA, the trend is considered positive (1).
If the fast EMA is below the slow EMA, the trend is considered negative (-1).
Combined Trend Signal
The combined trend signal is derived by summing the individual trends from the 5-minute, 15-minute, and 30-minute timeframes.
A combined trend value of 3 indicates a strong uptrend across all timeframes.
Any combined trend value less than 3 indicates a weakening or negative trend.
Entry and Exit Conditions
Entry Condition:
A long position is entered if:
The combined trend signal is 3 (indicating a strong uptrend across all timeframes).
The current close price is above the 200 EMA on the 5-minute timeframe.
Exit Condition:
The long position is exited if:
The combined trend signal is less than 3 (indicating a weakening trend).
The current close price falls below the 200 EMA on the 5-minute timeframe.
Stop Loss and Take Profit
Stop Loss: Set at 1% below the entry price.
Take Profit: Set at 3% above the entry price.
These levels are automatically set when entering a trade using the strategy.entry function with stop and limit parameters.
Plotting
The strategy plots the fast and slow EMAs for the 5-minute timeframe and the 200 EMA for visual reference on the chart:
Fast EMA (5-min): Plotted in blue.
Slow EMA (5-min): Plotted in red.
200 EMA (5-min): Plotted in green.

TMB LevelsDescription:
Improved "Hourly Midline" indicator. It displays high, middle and low levels of every candle with specified timeframe (can be hourly, daily, or any other timeframe). You can change the source for the levels (either high and low of candle, or open and close of candle). Additionally, you can turn on the "Line chart", which essentially connects every midline, making a line chart of middle prices.
Parameters:
- Timeframe -> use data from this timeframe ("30" would mean 30 minutes, "60" would mean 1 hour, etc.)
- Source -> source for calculating the middle level
- Top -> parameters of the top level lines
- Middle -> parameters of the middle level lines
- Bottom -> parameters of the bottom level lines
- Line chart -> connect every midline, making a line chart

Advanced RSI [CryptoSea]The Advanced RSI Duration (ARSI) is a unique tool crafted to deepen your market insights by focusing on the duration the Relative Strength Index (RSI) spends above or below key thresholds. This innovative approach is designed to help traders anticipate potential market reversals by observing sustained overbought and oversold conditions.
Core Feature
Duration Monitoring ARSI's standout feature is its ability to track how long the RSI remains in overbought (>70) or oversold (<30) conditions. By quantifying these durations, traders can gauge the strength of current market trends and the likelihood of reversals.
Enhanced Functionality
Multi-Timeframe Flexibility : Analyze the RSI duration from any selected timeframe on your current chart, offering a layered view of market dynamics.
Customizable Alerts : Receive notifications when the RSI maintains its position above or below set levels for an extended period, signaling sustained market pressure.
Visual Customization : Adjust the visual elements, including colors for overbought and oversold durations, to match your analytical style and preferences.
Label Management : Control the frequency of labels marking RSI threshold crossings, ensuring clarity and focus on significant market events.
Settings Overview
RSI Timeframe & Length : Tailor the RSI calculation to fit your analysis, choosing from various timeframes and period lengths.
Threshold Levels : Define what you consider overbought and oversold conditions with customizable upper and lower RSI levels.
Duration Alert Threshold : Set a specific bar count for how long the RSI should remain beyond these thresholds to trigger an alert.
Visualization Options : Choose distinct colors for durations above and below thresholds, and adjust label visibility to suit your charting approach.
Application & Strategy
Use ARSI to identify potential turning points in the market
Trend Exhaustion : Extended periods in overbought or oversold territories may indicate a strong trend but also warn of possible exhaustion and impending reversals.
Comparative Analysis : By evaluating the current duration against historical averages, traders can assess the relative strength of ongoing market conditions.
Strategic Entries/Exits : Utilize duration insights to refine entry and exit points, capitalizing on the predictive nature of prolonged RSI levels.
Alert Conditions
The Advanced RSI (ARSI) offers critical alert mechanisms to aid traders in identifying prolonged market conditions that could lead to actionable trading opportunities. These conditions are designed to alert traders when the RSI remains at extremes longer than typical durations, signaling sustained market behaviors.
Above Upper Level Alert: This alert is triggered when the RSI sustains above the upper threshold (usually 70) for more than the configured duration, indicating strong bullish momentum or potential overbought conditions.
Below Lower Level Alert: Similarly, this alert is activated when the RSI stays below the lower threshold (commonly 30) for an extended period, suggesting significant bearish momentum or potential oversold conditions.
These alerts enable traders to respond swiftly to extend market conditions, enhancing their strategy by providing timely insights into potential trend reversals or continuations.
The Advanced RSI Duration Analysis empowers traders with a nuanced understanding of market states, beyond mere RSI values. It highlights the significance of how long markets remain in extreme conditions, offering a predictive edge in anticipating reversals. Whether you're strategizing entries or preparing for shifts in market momentum, ARSI is your companion for informed trading decisions.
RSI, STOCHASTIC RSI AND MFI COMBOCombining the Relative Strength Index (RSI), Stochastic RSI (StochRSI), and Money Flow Index (MFI) can provide traders with a comprehensive approach to analyze market momentum, overbought/oversold conditions, and money flow. Each indicator offers unique insights, and their combination can help confirm trading signals and filter out false signals. Let's delve into each indicator and then discuss how they can be used together:
Relative Strength Index (RSI) 14: DA BLUE LINE
The RSI is a momentum oscillator that measures the speed and change of price movements. It oscillates between 0 and 100 and is typically used to identify overbought (>70) and oversold (<30) conditions. A reading above 70 may indicate that an asset is overbought and could be due for a pullback, while a reading below 30 may suggest that an asset is oversold and could be due for a bounce.
Stochastic RSI (StochRSI) 14: DA RED LINE
The StochRSI is an oscillator that combines the features of both the Stochastic Oscillator and RSI. It measures the relative position of the RSI within its range over a specific period (e.g., 14 periods). Like the RSI, the StochRSI oscillates between 0 and 100 and is used to identify overbought and oversold conditions. Typically:
A StochRSI above 0.8 may suggest overbought conditions.
A StochRSI below 0.2 may indicate oversold conditions.
Money Flow Index (MFI) 14: DA PURPLE LINE
The MFI is a momentum oscillator that measures the inflow and outflow of money into an asset over a specific period (e.g., 14 periods). It oscillates between 0 and 100 and is used to identify overbought and oversold conditions based on both price and volume. Generally:
An MFI above 80 may indicate overbought conditions.
An MFI below 20 may suggest oversold conditions.
Combining RSI, StochRSI, and MFI:
When combining RSI, StochRSI, and MFI, traders can use the following approach to analyze the market:
Identify Overbought/Oversold Conditions:
Look for confluence between RSI, StochRSI, and MFI readings to identify overbought and oversold conditions.
For example, if RSI > 70, StochRSI > 0.8, and MFI > 80, it may suggest a strong overbought condition, potentially indicating a reversal or pullback.
Confirm Trend Strength:
Use the RSI, StochRSI, and MFI to confirm the strength of a trend.
A rising trend with RSI, StochRSI, and MFI above 50 may suggest strong bullish momentum, while a falling trend with readings below 50 may indicate strong bearish momentum.
Divergence Analysis:
Look for divergences between price and RSI, StochRSI, or MFI to identify potential trend reversals.
For example, if the price makes a higher high, but RSI, StochRSI, or MFI makes a lower high (bearish divergence), it may suggest weakening bullish momentum and potential downside.
Combining RSI, StochRSI, and MFI can offer traders a more holistic view of market momentum, overbought/oversold conditions, and money flow. Backtest it let me know your success.

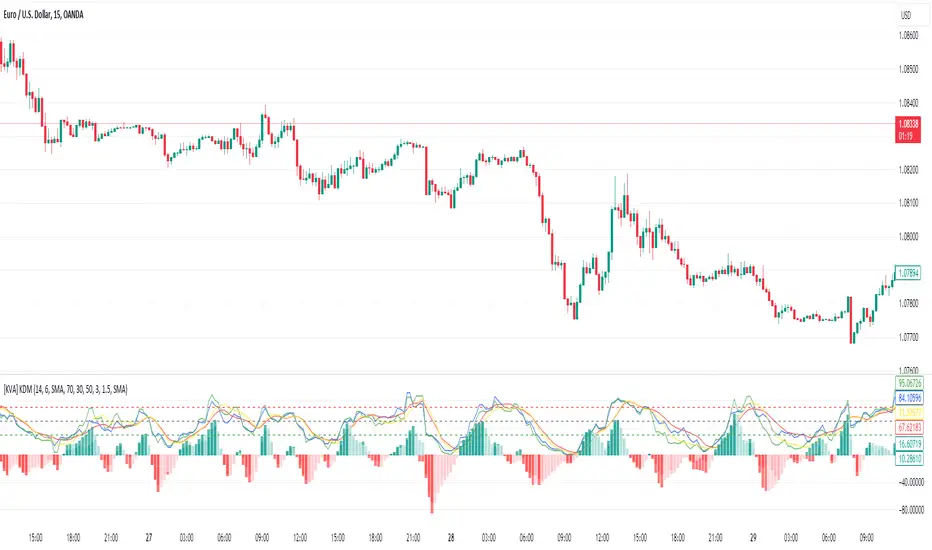
[KVA] Kamvia Directional MovementKamvia Directional Movement (KDM) Indicator is an analytical tool designed to identify potential buying and selling opportunities in the market. It highlights the phases of price depletion which typically align with price highs and lows, offering a nuanced understanding of market dynamics.
Efficient at pinpointing trend breakdowns and excelling in the identification of intra-day entry and exit points, the Kamvia Directional Movement Indicator is a valuable asset for traders aiming to optimize their market strategies.
The KDM not only takes into account the traditional high and low price points within its analysis but also introduces an innovative approach by incorporating the concepts of body high and body low. This nuanced analysis offers a deeper insight into market momentum and potential shifts in market dynamics.
High and Low Analysis : The indicator examines the price highs and lows to gauge the overall market volatility and potential turning points. By analyzing these extremities, traders can get a sense of market strength and possible shifts in trend direction. The high points indicate periods of maximum buying interest, potentially signaling overbought conditions, while the low points reflect selling interest, hinting at oversold conditions.
Body High and Body Low Analysis : Unique to the KDM Indicator is the emphasis on the body of the candlestick, which is the range between the open and close prices. This analysis offers a more refined view of market sentiment by focusing on the actual trading range experienced within the period. The body high (the upper end of the candlestick body) and body low (the lower end of the candlestick body) provide insights into the buying and selling pressure during the trading session, beyond mere price extremities.
The indicator is calibrated on a scale from 0 to 100, making interpretation intuitive and straightforward. A reading above 70 is considered to be in the overbought region, suggesting that the market might be experiencing a heightened level of buying activity that could lead to a potential pullback or reversal. Conversely, a reading below 30 falls into the oversold region, indicating a possible exhaustion in selling pressure and a potential for market reversal or bounce back.
This scale and the detailed analysis of both price and body dynamics equip traders with a comprehensive tool for assessing market conditions. The distinction between high/low and body high/body low analysis enriches the indicator's capability to provide more targeted insights into market behavior, enabling traders to make more nuanced decisions based on a broader spectrum of information. By identifying the duration and extent to which these conditions persist, traders can better interpret the market's momentum and align their strategies with the prevailing trend or prepare for an impending reversal.
KDM Strategy
The strategy focuses on spotting price reversals within a confirmed trend. While the indicator features regions indicating overbought and oversold conditions, these signals alone are not sufficient predictors of a market reversal.
The terms "overbought" and "oversold" describe scenarios where prices reach levels that are unusually high or low within a specified look-back period. Entering these zones often indicates a continuation of the trend rather than a reversal.
A "strongly overbought" condition signals buying pressure, whereas a "strongly oversold" condition indicates selling pressure. The key to leveraging these conditions lies in analyzing the duration for which the market remains in either state. This duration can provide critical insights into whether the market is trending or ranging.
Extended periods in extreme overbought territories confirm an uptrend, while prolonged presence in slight overbought zones (above 50 but below 70, for example) suggests a more moderate uptrend. Conventionally, levels above 70 signal extreme overbought conditions, and those below 30 indicate extreme oversold conditions.
Traders are advised to exercise caution when the oscillator stays within these extreme areas. Ideally, the strategy involves capitalizing on temporary price drops within an overall uptrend or on temporary price spikes within an overall downtrend.
Identifying trading opportunities with the KDM Indicator involves looking for the indicator to exit these extreme overbought or oversold regions, signaling potential reversals or continuations in the market's direction. This approach helps traders make informed decisions by considering the broader market trend alongside short-term price movements.
Danger Signals from The Trading MindwheelThe " Danger Signals " indicator, a collaborative creation from the minds at Amphibian Trading and MARA Wealth, serves as your vigilant lookout in the volatile world of stock trading. Drawing from the wisdom encapsulated in "The Trading Mindwheel" and the successful methodologies of legends like William O'Neil and Mark Minervini, this tool is engineered to safeguard your trading journey.
Core Features:
Real-Time Alerts: Identify critical danger signals as they emerge in the market. Whether it's a single day of heightened risk or a pattern forming, stay informed with specific danger signals and a tally of signals for comprehensive decision-making support. The indicator looks for over 30 different signals ranging from simple closing ranges to more complex signals like blow off action.
Tailored Insights with Portfolio Heat Integration: Pair with the "Portfolio Heat" indicator to customize danger signals based on your current positions, entry points, and stops. This personalized approach ensures that the insights are directly relevant to your trading strategy. Certain signals can have different meanings based on where your trade is at in its lifecycle. Blow off action at the beginning of a trend can be viewed as strength, while after an extended run could signal an opportunity to lock in profits.
Forward-Looking Analysis: Leverage the 'Potential Danger Signals' feature to assess future risks. Enter hypothetical price levels to understand potential market reactions before they unfold, enabling proactive trade management.
The indicator offers two different modes of 'Potential Danger Signals', Worst Case or Immediate. Worst Case allows the user to input any price and see what signals would fire based on price reaching that level, while the Immediate mode looks for potential Danger Signals that could happen on the next bar.
This is achieved by adding and subtracting the average daily range to the current bars close while also forecasting the next values of moving averages, vwaps, risk multiples and the relative strength line to see if a Danger Signal would trigger.
User Customization: Flexibility is at your fingertips with toggle options for each danger signal. Tailor the indicator to match your unique trading style and risk tolerance. No two traders are the same, that is why each signal is able to be turned on or off to match your trading personality.
Versatile Application: Ideal for growth stock traders, momentum swing traders, and adherents of the CANSLIM methodology. Whether you're a novice or a seasoned investor, this tool aligns with strategies influenced by trading giants.
Validation and Utility:
Inspired by the trade management principles of Michael Lamothe, the " Danger Signals " indicator is more than just a tool; it's a reflection of tested strategies that highlight the importance of risk management. Through rigorous validation, including the insights from "The Trading Mindwheel," this indicator helps traders navigate the complexities of the market with an informed, strategic approach.
Whether you're contemplating a new position or evaluating an existing one, the " Danger Signals " indicator is designed to provide the clarity needed to avoid potential pitfalls and capitalize on opportunities with confidence. Embrace a smarter way to trade, where awareness and preparation open the door to success.
Let's dive into each of the components of this indicator.
Volume: Volume refers to the number of shares or contracts traded in a security or an entire market during a given period. It is a measure of the total trading activity and liquidity, indicating the overall interest in a stock or market.
Price Action: the analysis of historical prices to inform trading decisions, without the use of technical indicators. It focuses on the movement of prices to identify patterns, trends, and potential reversal points in the market.
Relative Strength Line: The RS line is a popular tool used to compare the performance of a stock, typically calculated as the ratio of the stock's price to a benchmark index's price. It helps identify outperformers and underperformers relative to the market or a specific sector. The RS value is calculated by dividing the close price of the chosen stock by the close price of the comparative symbol (SPX by default).
Average True Range (ATR): ATR is a market volatility indicator used to show the average range prices swing over a specified period. It is calculated by taking the moving average of the true ranges of a stock for a specific period. The true range for a period is the greatest of the following three values:
The difference between the current high and the current low.
The absolute value of the current high minus the previous close.
The absolute value of the current low minus the previous close.
Average Daily Range (ADR): ADR is a measure used in trading to capture the average range between the high and low prices of an asset over a specified number of past trading days. Unlike the Average True Range (ATR), which accounts for gaps in the price from one day to the next, the Average Daily Range focuses solely on the trading range within each day and averages it out.
Anchored VWAP: AVWAP gives the average price of an asset, weighted by volume, starting from a specific anchor point. This provides traders with a dynamic average price considering both price and volume from a specific start point, offering insights into the market's direction and potential support or resistance levels.
Moving Averages: Moving Averages smooth out price data by creating a constantly updated average price over a specific period of time. It helps traders identify trends by flattening out the fluctuations in price data.
Stochastic: A stochastic oscillator is a momentum indicator used in technical analysis that compares a particular closing price of an asset to a range of its prices over a certain period of time. The theory behind the stochastic oscillator is that in a market trending upwards, prices will tend to close near their high, and in a market trending downwards, prices close near their low.
While each of these components offer unique insights into market behavior, providing sell signals under specific conditions, the power of combining these different signals lies in their ability to confirm each other's signals. This in turn reduces false positives and provides a more reliable basis for trading decisions
These signals can be recognized at any time, however the indicators power is in it's ability to take into account where a trade is in terms of your entry price and stop.
If a trade just started, it hasn’t earned much leeway. Kind of like a new employee that shows up late on the first day of work. It’s less forgivable than say the person who has been there for a while, has done well, is on time, and then one day comes in late.
Contextual Sensitivity:
For instance, a high volume sell-off coupled with a bearish price action pattern significantly strengthens the sell signal. When the price closes below an Anchored VWAP or a critical moving average in this context, it reaffirms the bearish sentiment, suggesting that the momentum is likely to continue downwards.
By considering the relative strength line (RS) alongside volume and price action, the indicator can differentiate between a normal retracement in a strong uptrend and a when a stock starts to become a laggard.
The integration of ATR and ADR provides a dynamic framework that adjusts to the market's volatility. A sudden increase in ATR or a character change detected through comparing short-term and long-term ADR can alert traders to emerging trends or reversals.
The "Danger Signals" indicator exemplifies the power of integrating diverse technical indicators to create a more sophisticated, responsive, and adaptable trading tool. This approach not only amplifies the individual strengths of each indicator but also mitigates their weaknesses.
Portfolio Heat Indicator can be found by clicking on the image below
Danger Signals Included
Price Closes Near Low - Daily Closing Range of 30% or Less
Price Closes Near Weekly Low - Weekly Closing Range of 30% or Less
Price Closes Near Daily Low on Heavy Volume - Daily Closing Range of 30% or Less on Heaviest Volume of the Last 5 Days
Price Closes Near Weekly Low on Heavy Volume - Weekly Closing Range of 30% or Less on Heaviest Volume of the Last 5 Weeks
Price Closes Below Moving Average - Price Closes Below One of 5 Selected Moving Averages
Price Closes Below Swing Low - Price Closes Below Most Recent Swing Low
Price Closes Below 1.5 ATR - Price Closes Below Trailing ATR Stop Based on Highest High of Last 10 Days
Price Closes Below AVWAP - Price Closes Below Selected Anchored VWAP (Anchors include: High of base, Low of base, Highest volume of base, Custom date)
Price Shows Aggressive Selling - Current Bars High is Greater Than Previous Day's High and Closes Near the Lows on Heaviest Volume of the Last 5 Days
Outside Reversal Bar - Price Makes a New High and Closes Near the Lows, Lower Than the Previous Bar's Low
Price Shows Signs of Stalling - Heavy Volume with a Close of Less than 1%
3 Consecutive Days of Lower Lows - 3 Days of Lower Lows
Close Lower than 3 Previous Lows - Close is Less than 3 Previous Lows
Character Change - ADR of Last Shorter Length is Larger than ADR of Longer Length
Fast Stochastic Crosses Below Slow Stochastic - Fast Stochastic Crosses Below Slow Stochastic
Fast & Slow Stochastic Curved Down - Both Stochastic Lines Close Lower than Previous Day for 2 Consecutive Days
Lower Lows & Lower Highs Intraday - Lower High and Lower Low on 30 Minute Timeframe
Moving Average Crossunder - Selected MA Crosses Below Other Selected MA
RS Starts Curving Down - Relative Strength Line Closes Lower than Previous Day for 2 Consecutive Days
RS Turns Negative Short Term - RS Closes Below RS of 7 Days Ago
RS Underperforms Price - Relative Strength Line Not at Highs, While Price Is
Moving Average Begins to Flatten Out - First Day MA Doesn't Close Higher
Price Moves Higher on Lighter Volume - Price Makes a New High on Light Volume and 15 Day Average Volume is Less than 50 Day Average
Price Hits % Target - Price Moves Set % Higher from Entry Price
Price Hits R Multiple - Price hits (Entry - Stop Multiplied by Setting) and Added to Entry
Price Hits Overhead Resistance - Price Crosses a Swing High from a Monthly Timeframe Chart from at Least 1 Year Ago
Price Hits Fib Level - Price Crosses a Fib Extension Drawn From Base High to Low
Price Hits a Psychological Level - Price Crosses a Multiple of 0 or 5
Heavy Volume After Significant Move - Above Average and Heaviest Volume of the Last 5 Days 35 Bars or More from Breakout
Moving Averages Begin to Slope Downward - Moving Averages Fall for 2 Consecutive Days
Blow Off Action - Highest Volume, Largest Spread, Multiple Gaps in a Row 35 Bars or More Post Breakout
Late Buying Frenzy - ANTS 35 Bars or More Post Breakout
Exhaustion Gap - Gap Up 5% or Higher with Price 125% or More Above 200sma

Heikin Ashi RSI + OTT [Erebor]Relative Strength Index (RSI)
The Relative Strength Index (RSI) is a popular momentum oscillator used in technical analysis to measure the speed and change of price movements. Developed by J. Welles Wilder, the RSI is calculated using the average gains and losses over a specified period, typically 14 days. Here's how it works:
Description and Calculation:
1. Average Gain and Average Loss Calculation:
- Calculate the average gain and average loss over the chosen period (e.g., 14 days).
- The average gain is the sum of gains divided by the period, and the average loss is the sum of losses divided by the period.
2. Relative Strength (RS) Calculation:
- The relative strength is the ratio of average gain to average loss.
The RSI oscillates between 0 and 100. Traditionally, an RSI above 70 indicates overbought conditions, suggesting a potential sell signal, while an RSI below 30 suggests oversold conditions, indicating a potential buy signal.
Pros of RSI:
- Identifying Overbought and Oversold Conditions: RSI helps traders identify potential reversal points in the market due to overbought or oversold conditions.
- Confirmation Tool: RSI can be used in conjunction with other technical indicators or chart patterns to confirm signals, enhancing the reliability of trading decisions.
- Versatility: RSI can be applied to various timeframes, from intraday to long-term charts, making it adaptable to different trading styles.
Cons of RSI:
- Whipsaws: In ranging markets, RSI can generate false signals, leading to whipsaws (rapid price movements followed by a reversal).
- Not Always Accurate: RSI may give false signals, especially in strongly trending markets where overbought or oversold conditions persist for extended periods.
- Subjectivity: Interpretation of RSI levels (e.g., 70 for overbought, 30 for oversold) is somewhat subjective and can vary depending on market conditions and individual preferences.
Checking RSIs in Different Periods:
Traders often use multiple timeframes to analyze RSI for a more comprehensive view:
- Fast RSI (e.g., 8-period): Provides more sensitive signals, suitable for short-term trading and quick decision-making.
- Slow RSI (e.g., 32-period): Offers a smoother representation of price movements, useful for identifying longer-term trends and reducing noise.
By comparing RSI readings across different periods, traders can gain insights into the momentum and strength of price movements over various timeframes, helping them make more informed trading decisions. Additionally, divergence between fast and slow RSI readings may signal potential trend reversals or continuation patterns.
Heikin Ashi Candles
Let's consider a modification to the traditional “Heikin Ashi Candles” where we introduce a new parameter: the period of calculation. The traditional HA candles are derived from the open 01, high 00 low 00, and close 00 prices of the underlying asset.
Now, let's introduce a new parameter, period, which will determine how many periods are considered in the calculation of the HA candles. This period parameter will affect the smoothing and responsiveness of the resulting candles.
In this modification, instead of considering just the current period, we're averaging or aggregating the prices over a specified number of periods . This will result in candles that reflect a longer-term trend or sentiment, depending on the chosen period value.
For example, if period is set to 1, it would essentially be the same as traditional Heikin Ashi candles. However, if period is set to a higher value, say 5, each candle will represent the average price movement over the last 5 periods, providing a smoother representation of the trend but potentially with delayed signals compared to lower period values.
Traders can adjust the period parameter based on their trading style, the timeframe they're analyzing, and the level of smoothing or responsiveness they prefer in their candlestick patterns.
Optimized Trend Tracker
The "Optimized Trend Tracker" is a proprietary trading indicator developed by TradingView user ANIL ÖZEKŞİ. It is designed to identify and track trends in financial markets efficiently. The indicator attempts to smooth out price fluctuations and provide clear signals for trend direction.
The Optimized Trend Tracker uses a combination of moving averages and adaptive filters to detect trends. It aims to reduce lag and noise typically associated with traditional moving averages, thereby providing more timely and accurate signals.
Some of the key features and applications of the OTT include:
• Trend Identification: The indicator helps traders identify the direction of the prevailing trend in a market. It distinguishes between uptrends, downtrends, and sideways consolidations.
• Entry and Exit Signals: The OTT generates buy and sell signals based on crossovers and direction changes of the trend. Traders can use these signals to time their entries and exits in the market.
• Trend Strength: It also provides insights into the strength of the trend by analyzing the slope and momentum of price movements. This information can help traders assess the conviction behind the trend and adjust their trading strategies accordingly.
• Filter Noise: By employing adaptive filters, the indicator aims to filter out market noise and false signals, thereby enhancing the reliability of trend identification.
• Customization: Traders can customize the parameters of the OTT to suit their specific trading preferences and market conditions. This flexibility allows for adaptation to different timeframes and asset classes.
Overall, the OTT can be a valuable tool for traders seeking to capitalize on trending market conditions while minimizing false signals and noise. However, like any trading indicator, it is essential to combine its signals with other forms of analysis and risk management strategies for optimal results. Additionally, traders should thoroughly back-test the indicator and practice using it in a demo environment before applying it to live trading.
The following types of moving average have been included: "SMA", "EMA", "SMMA (RMA)", "WMA", "VWMA", "HMA", "KAMA", "LSMA", "TRAMA", "VAR", "DEMA", "ZLEMA", "TSF", "WWMA". Thanks to the authors.
Thank you for your indicator “Optimized Trend Tracker”. © kivancozbilgic
Thank you for your programming language, indicators and strategies. © TradingView
Kind regards.
© Erebor_GIT

RSI Strategy with Manual TP and SL 19/03/2024This TradingView script implements a simple RSI (Relative Strength Index) strategy with manual take profit (TP) and stop-loss (SL) levels. Let's break down the script and analyze its components:
RSI Calculation: The script calculates the RSI using the specified length parameter. RSI is a momentum oscillator that measures the speed and change of price movements. It ranges from 0 to 100 and typically values above 70 indicate overbought conditions while values below 30 indicate oversold conditions.
Strategy Parameters:
length: Length of the RSI period.
overSold: Threshold for oversold condition.
overBought: Threshold for overbought condition.
trail_profit_pct: Percentage for trailing profit.
Entry Conditions:
For a long position: RSI crosses above 30 and the daily close is above 70% of the highest close in the last 50 bars.
For a short position: RSI crosses below 70 and the daily close is below 130% of the lowest close in the last 50 bars.
Entry Signals:
Long entry is signaled when both conditions for a long position are met.
Short entry is signaled when both conditions for a short position are met.
Manual TP and SL:
Take profit and stop-loss levels are calculated based on the entry price and the specified percentage.
For long positions, the take profit level is set above the entry price and the stop-loss level is set below the entry price.
For short positions, the take profit level is set below the entry price and the stop-loss level is set above the entry price.
Strategy Exits:
Exit conditions are defined for both long and short positions using the calculated take profit and stop-loss levels.
Chart Analysis:
This strategy aims to capitalize on short-term momentum shifts indicated by RSI crossings combined with daily price movements.
It utilizes manual TP and SL levels, providing traders with flexibility in managing their positions.
The strategy may perform well in ranging or oscillating markets where RSI signals are more reliable.
However, it may encounter challenges in trending markets where RSI can remain overbought or oversold for extended periods.
Traders should backtest this strategy thoroughly on historical data and consider optimizing parameters to suit different market conditions.
Risk management is crucial, so traders should carefully adjust TP and SL percentages based on their risk tolerance and market volatility.
Overall, this strategy provides a structured approach to trading based on RSI signals while allowing traders to customize their risk management. However, like any trading strategy, it should be used judiciously and in conjunction with other forms of analysis and risk management techniques.

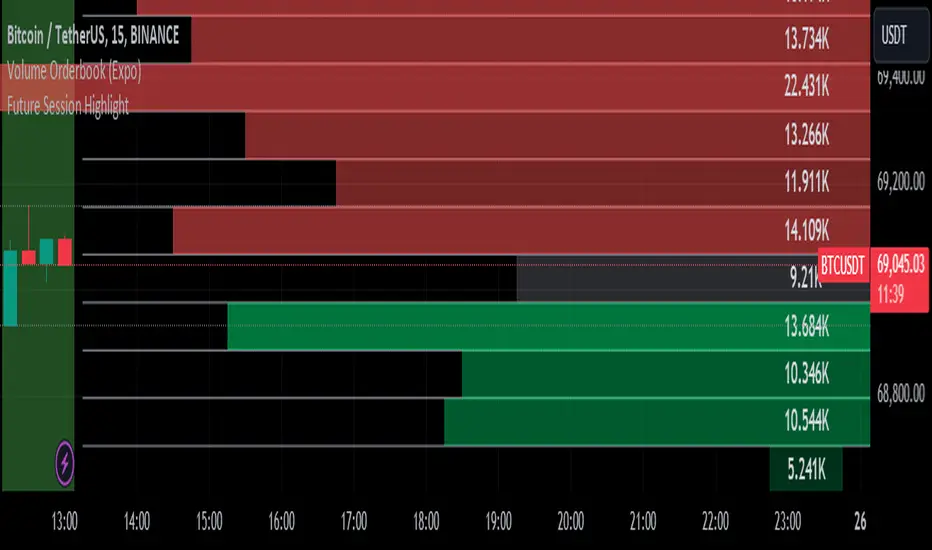
Market Internals & InfoThis script provides various information on Market Internals and other related info. It was a part of the Daily Levels script but that script was getting very large so I decided to separate this piece of it into its own indicator. I plan on adding some additional features in the near future so stay tuned for those!
The script provides customizability to show certain market internals, tickers, and even Market Profile TPO periods.
Here is a summary of each setting:
NASDAQ and NYSE Breadth Ratio
- Ratio between Up Volume and Down Volume for NASDAQ and NYSE markets. This can help inform about the type of volume flowing in and out of these exchanges.
Advance/Decline Line (ADL)
The ADL focuses specifically on the number of advancing and declining stocks within an index, without considering their trading volume.
Here's how the ADL works:
It tracks the daily difference between the number of stocks that are up in price (advancing) and the number of stocks that are down in price (declining) within a particular index.
The ADL is a cumulative measure, meaning each day's difference is added to the previous day's total.
If there are more advancing stocks, the ADL goes up.
If there are more declining stocks, the ADL goes down.
By analyzing the ADL, investors can get a sense of how many stocks are participating in a market move.
Here's what the ADL can tell you:
Confirmation of Trends: When the ADL moves in the same direction as the underlying index (e.g., ADL rising with a rising index), it suggests broad participation in the trend and potentially stronger momentum.
Divergence: If the ADL diverges from the index (e.g., ADL falling while the index is rising), it can be a warning sign. This suggests that fewer stocks are participating in the rally, which could indicate a weakening trend.
Keep in mind:
The ADL is a backward-looking indicator, reflecting past market activity.
It's often used in conjunction with other technical indicators for a more complete picture.
TRIN Arms Index
The TRIN index, also called the Arms Index or Short-Term Trading Index, is a technical analysis tool used in the stock market to gauge market breadth and sentiment. It essentially compares the number of advancing stocks (gaining in price) to declining stocks (losing price) along with their trading volume.
Here's how to interpret the TRIN:
High TRIN (above 1.0): This indicates a weak market where declining stocks and their volume are dominating the market. It can be a sign of a potential downward trend.
Low TRIN (below 1.0): This suggests a strong market where advancing stocks and their volume are in control. It can be a sign of a potential upward trend.
TRIN around 1.0: This represents a more balanced market, where it's difficult to say which direction the market might be headed.
Important points to remember about TRIN:
It's a short-term indicator, primarily used for intraday trading decisions.
It should be used in conjunction with other technical indicators for a more comprehensive market analysis. High or low TRIN readings don't guarantee future price movements.
VIX/VXN
VIX and VXN are both indexes created by the Chicago Board Options Exchange (CBOE) to measure market volatility. They differ based on the underlying index they track:
VIX (Cboe Volatility Index): This is the more well-known index and is considered the "fear gauge" of the stock market. It reflects the market's expectation of volatility in the S&P 500 index over the next 30 days.
VXN (Cboe Nasdaq Volatility Index): This is a counterpart to the VIX, but instead gauges volatility expectations for the Nasdaq 100 index over the coming 30 days. The tech-heavy Nasdaq can sometimes diverge from the broader market represented by the S&P 500, hence the need for a separate volatility measure.
Both VIX and VXN are calculated based on the implied volatilities of options contracts listed on their respective indexes. Here's a general interpretation:
High VIX/VXN: Indicates a high level of fear or uncertainty in the market, suggesting investors expect significant price fluctuations in the near future.
Low VIX/VXN: Suggests a more complacent market with lower expectations of volatility.
Important points to remember about VIX and VXN:
They are forward-looking indicators, reflecting market sentiment about future volatility, not necessarily current market conditions.
High VIX/VXN readings don't guarantee a market crash, and low readings don't guarantee smooth sailing.
These indexes are often used by investors to make decisions about portfolio allocation and hedging strategies.
Inside/Outside Day
This provides a quick indication of it we are still trading inside or outside of yesterdays range and will show "Inside Day" or "Outside Day" based upon todays range vs. yesterday's range.
Custom Ticker Choices
Ability to add up to 5 other tickers that can be tracked within the table
Show Market Profile TPO
This only shows on timeframes less than 30m. It will show both the current TPO period and the remaining time within that period.
Table Customization
Provided drop downs to change the text size and also the location of the table.

AWR_WaveTrend Multitimeframe [adapted from LazyBear]I've adapted a script from Lazy Bear (WT trend oscillator)
WaveTrend Oscillator is a port of a famous TS/MT indicator.
When the oscillator (WT1 designed as a line) is above the overbought band (50 to 60) and crosses down the WT2 (dotted line), it is usually a good SELL signal. Similarly, when the oscillator crosses above the signal when below the Oversold band ( (-50 to -60)), it is a good BUY signal.
In this indicator, you can display at the same time, different time frames.
Choice possible are 1 mn, 15 mn, 30 mn, 60 mn, 120 mn, 240 mn, 1D, Week, Month.
Small time frames (1 to 30 mn) are represented by a blue lines (light to dark)
1H is in grey
2H & 4H are in purple (light to dark)
1D is in green
1W is in orange
1M is in black
You can choose which timeframes you want to display for the current period or for the last period closed.
In a few seconds, you perfectly see the selected timeframes trends.
There is also at the bottom right a table summing up all the different values of WT1, WT2 and difference between them.
Positive difference means an upside trend
Negative difference means a downside trend.
Another way of using this indicator is displaying only the difference between WT1 & WT2. It's giving the speed & the direction of all trends. Trends are our friends ...
You can observe the significent times frames and look if they are all positives or negatives or if the speed of lower timeframe cross a longer timeframe of if the speed is decreasing or increasing...
Difference values goes generaly from -20 to 20 (it can exceed a bit but really rare). 12 is already high level of speed.
Many uses possible.
In the exemple posted, I've selected WT1 and WT2 for timeframes 4H, Daily & Weekly.
Marker 1:
Orange lines (WT1) are far below - 50 (-67 here) and cross WT2 pointed lines : weekly buy signal
But this buy signal is balanced by 4H & Daily sell signal = it's marking start of hesitations of main trend !!!!
Marker 2 :
Next buy signal in 4H or daily would normaly confirm the start
Marker 3 :
Sell signal in 4H and daily but weekly has an upside trend ! Start of a counter trend in the trend. To find the perfect timing of that you have to look to lower time frames, because 4H and daily are giving many hesitations signals crossing down & crossing up many times in an overbought zone.
Marker 4 :
End of the counter trend. Most of the time, the countertrend don't go in the "over" zone. That's why if you trading in an counter trend, you have to keep it in mind.
Then a few days later you can see the sell signal. And what a sell signal ! 4H & daily are smashed down really fastly ! Trends change warning !
Marker 5
Long hesitation/change of the trend. Daily WT and 4H are below the weekly trends. Weekly start to go down.
Start of a counter trend inside the trend giving us the best selling signal at her end !
Marker 6 :
Long hesitation/change of the trend.
You have to look in lower time frames to identify the short trend. Difficult to find the best timing to get in. ....
I've add many alerts. When a time frame become positive or negative. When many time frames are positive or negative or above or below 47 level...
Please feel free to explore.
Hope it will help you.
Thanks to Lazybear ! Thousands thanks to Lazybear !
Exemple with difference

Forex Multi-Factor IndicatorMoving Averages (MA):
Two moving averages are plotted on the chart: a fast MA (blue line) and a slow MA (red line).
The fast MA is calculated using a shorter period (10 periods by default), while the slow MA is calculated using a longer period (30 periods by default).
Moving averages help identify trends by smoothing out price fluctuations. When the fast MA crosses above the slow MA, it suggests a bullish trend, and when the fast MA crosses below the slow MA, it suggests a bearish trend.
Relative Strength Index (RSI):
The RSI indicator (orange line) is plotted on a separate axis.
RSI measures the speed and change of price movements and oscillates between 0 and 100.
RSI values above 70 are considered overbought, indicating a potential reversal to the downside, while RSI values below 30 are considered oversold, indicating a potential reversal to the upside.
Volume Moving Average (Volume MA):
The volume moving average (purple line) is plotted on the same axis as the volume.
The volume moving average is calculated over a specified period (20 periods by default).
Volume analysis provides insights into the strength of price movements. When the volume increases along with price movements, it suggests strong conviction from traders.
Buy and Sell Signals:
Buy signals (green triangle) are generated when all of the following conditions are met:
The fast MA crosses above the slow MA (indicating a bullish trend).
The RSI is below the oversold level (indicating potential upward momentum).
The current price is above the fast MA, and the volume is higher than the volume MA (indicating positive volume trend).
Sell signals (red triangle) are generated when all of the following conditions are met:
The fast MA crosses below the slow MA (indicating a bearish trend).
The RSI is above the overbought level (indicating potential downward momentum).
The current price is below the fast MA, and the volume is lower than the volume MA (indicating negative volume trend).
Overall, this multi-factor indicator combines moving averages, RSI, and volume analysis to identify potential buying and selling opportunities in the Forex market. Traders can use the signals generated by this indicator as part of their trading strategy, but it's important to consider other factors such as risk management and market conditions before making trading decisions
