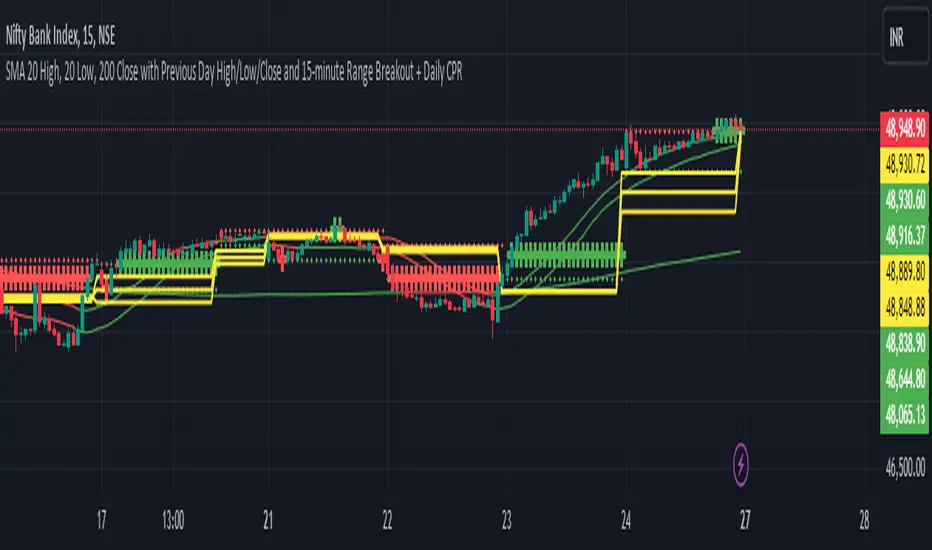
20,200SMA,PDHL,15 minute ORBSimple Moving Averages (SMAs):
The script calculates three SMAs: SMA 20 High, SMA 20 Low, and SMA 200 Close. These moving averages are widely used in technical analysis to smooth out price data and identify trends.
The SMA for the high price (SMA 20 High) is calculated based on the 20-period moving average of the high prices.
Similarly, the SMA for the low price (SMA 20 Low) is calculated based on the 20-period moving average of the low prices.
The SMA for the close price (SMA 200 Close) is calculated based on the 200-period moving average of the closing prices.
Each SMA is plotted on the chart, and their colors are determined based on whether the current close price is above or below each respective SMA.
Conditional Coloring:
The script employs conditional coloring to visually highlight whether the close price is above or below each SMA.
If the close price is below the SMA 20 High, it's plotted in red; otherwise, it's plotted in green.
Similarly, the SMA 20 Low and SMA 200 Close are plotted with conditional colors based on the relationship between the close price and each respective SMA.
Previous Day's Data:
The script retrieves and plots the high, low, and close prices of the previous trading day.
This provides traders with valuable information about the previous day's market behavior, which can influence trading decisions.
Opening 15-minute Range Breakout:
The script calculates the high and low prices during the first 15 minutes of each trading day.
These prices represent the opening range for the day.
It then determines whether the current close price is above or below this opening range and plots it accordingly.
This breakout strategy helps traders identify potential trading opportunities based on early price movements.
By integrating these components, the script offers traders a comprehensive analysis of market trends, previous day's performance, and potential breakout opportunities. Its originality lies in the combination of these features into a single, easy-to-use indicator, providing valuable insights for trading decisions.
In den Scripts nach "情绪指数板块+约200只股票+选股规则" suchen
Range Average Retest Model [LuxAlgo]The Range Average Retest Model tool highlights setups from the range average retest entry model, a model using the retest of the average between two opposite swing points as an entry.
This tool uses long-term volatility coupled with user-defined multipliers to filter out swing areas and set take profit and stop loss levels for all trades.
Key features include:
Draw up to 165 swing areas and their associated trades
Filter out swing areas using Pivot Length , Selection Mode and Threshold parameters
Filter out trades with Maximum Distance and Minimum Distance parameters
Enable or disable swing areas and select default colors
Enable or disable overlapping trades and change the default colors for Take Profit and Stop Loss zones
🔶 USAGE
The "Range Average Retest Model" is an entry model that enters a position when the price retests the average made between two swing points. Users can determine the period of the detected swing points from the "Pivot Length" setting.
The conditions for long or short trades, regardless of whether the swing area is bullish or bearish, are as follows:
Long positions: the current bar close is below the swing area average and the last bar close was above it.
Short positions: the current bar close is above the swing area average price and the last bar close was below it.
Each trade is displayed on the chart with a line connecting it to its swing area highlighting the range average, a green area for the take profit, and a red area for the stop loss.
Both the Take Profit and Stop Loss levels are calculated by applying your own multiplier in the settings panel to the long-term volatility measure, in this case, the average true range over the last 200 bars.
Trades will remain open until they reach either the Stop Loss or Take Profit price levels.
🔹 Filtering Swing Areas
The daily chart of the Nasdaq-100 futures (NQ) with pivot length 2 and bullish selection mode: it only detects bullish swing areas, but they are smaller and more numerous.
Traders can manipulate the behavior of the swing areas from the settings panel.
The Selection mode will filter areas by bias: it will detect bullish areas, bearish areas, or both.
The Threshold parameter is applied to the long-term volatility to filter out areas where the average prices are too close together; the higher the value, the greater the difference between the average prices must be.
🔹 Trades
3-minute chart of the Nasdaq-100 futures (NQ) with pivot length 5, bearish selection mode maximum distance 4, and stop loss 2: many trades detected with very asymmetric risk/reward.
The behavior of the trades is also manipulated from the settings panel.
The maximum and minimum distance parameters specify the number of bars a trade must be away from a swing area.
The Take Profit and Stop Loss parameters are applied to the long-term volatility to obtain their respective price levels.
🔹 Overlapping Trades
Same chart as before, but with overlapping trades: messy, right?
By default the tool does not show overlapping trades, this allows for a cleaner chart.
In the settings panel traders can enable overlapping mode, in which case the tool will show all available trades.
Traders must be aware that the chart can be very crowded.
🔶 SETTINGS
🔹 Swings
Pivot Length: How many bars are used to confirm a swing point. The larger this parameter is, the larger and fewer swing areas will be detected.
Selection Mode: Swing area detection mode, detect only bullish swings, only bearish swings, or both.
Threshold: Swing area comparator. This threshold is multiplied by a measure of volatility (average true range over the last 200 bars), for a new swing area to be detected it must have an average level that is sufficiently distant from the average level of any untouched swing area, this parameter controls that distance.
🔹 Trades
Maximum distance: Maximum distance allowed between a swing area and a trade.
Minimum distance: Minimum distance allowed between a swing area and a trade.
Take profit: The size of the take profit - this threshold is multiplied by a measure of volatility (the average true range over the last 200 bars).
Stop loss: The size of the stop-loss: this threshold is multiplied by a measure of volatility (the average true range over the last 200 bars).

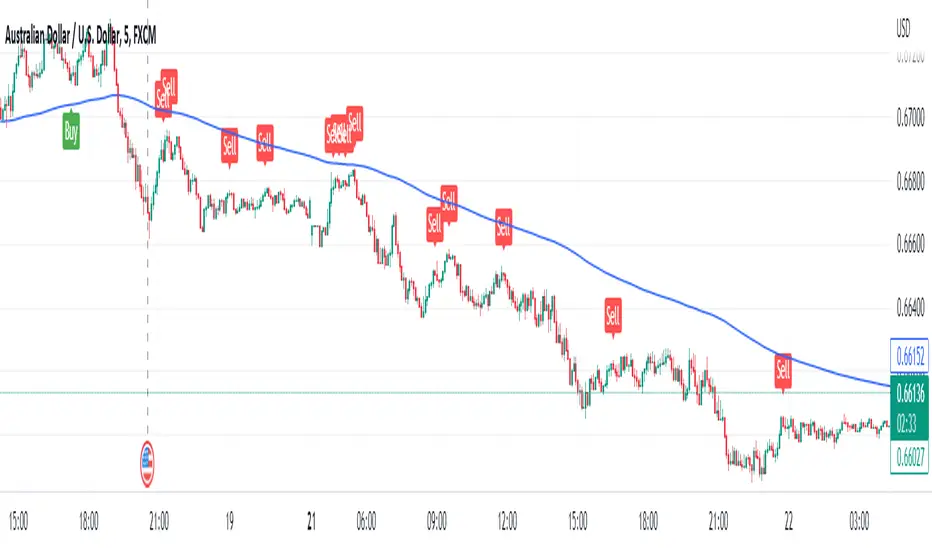
Momentum spotter(FogWalkerTrader) This a trend following indicator using simple moving averages and price close,high and low of recent candles to plot a buy or sell signal.
IMPORTANT - this indicator does not repaint.Traders need to wait untill the the closing of the candle though as the signal is dependant of the close of the period.
Buy Signal: Price closes above the 20, 50, and 200 simple moving averages (SMAs), with the 50 SMA above the 200 SMA, indicating a strong uptrend. The last 4 prices had their lows below the 5 SMA and highs above it.Plus, the current close is higher than the high from 4 periods ago, further suggesting a bullish move.
BUY = blue labelup plotted below candlestick
Sell Signal: Price closes below the 20, 50, and 200 SMAs, with the 50 SMA below the 200 SMA, signaling a strong downtrend. The last 4 prices had their highs above the 5 SMA and lows below it Plus, the current close is lower than the low from 4 periods ago, further suggesting a bearish move.
SELL = red labeldown plotted above candlestick.
IMPORTANT
It’s important to note that, like any trading tool, this isn't foolproof. The market can be unpredictable, leading to false signals. The logic behind these signals is sound, but due to the complexity and volatility of the market, there are times when the signals may not lead to the expected outcome. It's a useful tool, but it's wise to use it alongside other analyses to make more informed decisions.

SMA Custom Volume BandsThe "SMA Custom Volume Bands" indicator is a custom technical analysis tool designed for use on the TradingView platform. This indicator allows users to analyze and visualize key aspects of a stock's volume within the context of its 200-period Simple Moving Average (SMA). It features the following components:
Volume Bars: The indicator displays the volume of a selected financial instrument using colored bars. Green bars represent days when the trading volume is higher than the previous day, while red bars represent days when the trading volume is lower.
200 SMA of Volume: A blue line on the chart represents the 200-period Simple Moving Average of the trading volume, providing insight into the longer-term volume trend.
Customizable Percentage Line: Users have the flexibility to set a custom percentage value above or below the 200 SMA of trading volume. This line is plotted as a blue line on the chart, allowing traders to identify when volume meets their preferred percentage threshold.
The "SMA Custom Volume Bands" indicator is a simple tool for traders, aiding in the assessment of volume trends and potential price reversals in the context of moving averages. It offers customization options, enhancing its adaptability to individual trading strategies and preferences.

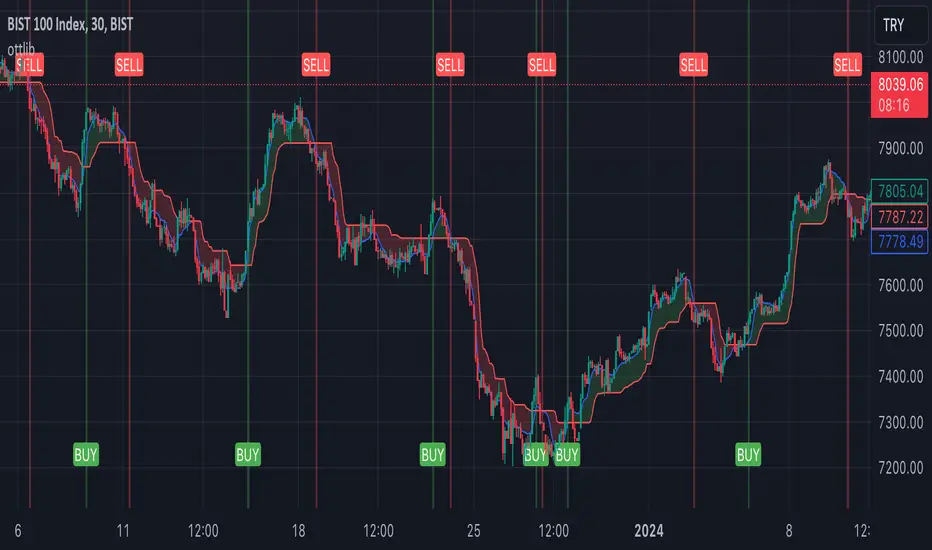
ottlibLibrary "ottlib"
█ OVERVIEW
This library contains functions for the calculation of the OTT (Optimized Trend Tracker) and its variants, originally created by Anıl Özekşi (Anil_Ozeksi). Special thanks to him for the concept and to Kıvanç Özbilgiç (KivancOzbilgic) and dg_factor (dg_factor) for adapting them to Pine Script.
█ WHAT IS "OTT"
The OTT (Optimized Trend Tracker) is a highly customizable and very effective trend-following indicator that relies on moving averages and a trailing stop at its core. Moving averages help reduce noise by smoothing out sudden price movements in the markets, while trailing stops assist in detecting trend reversals with precision. Initially developed as a noise-free trailing stop, the current variants of OTT range from rapid trend reversal detection to long-term trend confirmation, thanks to its extensive customizability.
It's well-known variants are:
OTT (Optimized Trend Tracker).
TOTT (Twin OTT).
OTT Channels.
RISOTTO (RSI OTT).
SOTT (Stochastic OTT).
HOTT & LOTT (Highest & Lowest OTT)
ROTT (Relative OTT)
FT (Original name is Fırsatçı Trend in Turkish which translates to Opportunist Trend)
█ LIBRARY FEATURES
This library has been prepared in accordance with the style, coding, and annotation standards of Pine Script version 5. As a result, explanations and examples will appear when users hover over functions or enter function parameters in the editor.
█ USAGE
Usage of this library is very simple. Just import it to your script with the code below and use its functions.
import ismailcarlik/ottlib/1 as ottlib
█ FUNCTIONS
• f_vidya(source, length, cmoLength)
Short Definition: Chande's Variable Index Dynamic Average (VIDYA).
Details: This function computes Chande's Variable Index Dynamic Average (VIDYA), which serves as the original moving average for OTT. The 'length' parameter determines the number of bars used to calculate the average of the given source. Lower values result in less smoothing of prices, while higher values lead to greater smoothing. While primarily used internally in this library, it has been made available for users who wish to utilize it as a moving average or use in custom OTT implementations.
Parameters:
source (float) : (series float) Series of values to process.
length (simple int) : (simple int) Number of bars to lookback.
cmoLength (simple int) : (simple int) Number of bars to lookback for calculating CMO. Default value is `9`.
Returns: (float) Calculated average of `source` for `length` bars back.
Example:
vidyaValue = ottlib.f_vidya(source = close, length = 20)
plot(vidyaValue, color = color.blue)
• f_mostTrail(source, multiplier)
Short Definition: Calculates trailing stop value.
Details: This function calculates the trailing stop value for a given source and the percentage. The 'multiplier' parameter defines the percentage of the trailing stop. Lower values are beneficial for catching short-term reversals, while higher values aid in identifying long-term trends. Although only used once internally in this library, it has been made available for users who wish to utilize it as a traditional trailing stop or use in custom OTT implementations.
Parameters:
source (float) : (series int/float) Series of values to process.
multiplier (simple float) : (simple float) Percent of trailing stop.
Returns: (float) Calculated value of trailing stop.
Example:
emaValue = ta.ema(source = close, length = 14)
mostValue = ottlib.f_mostTrail(source = emaValue, multiplier = 2.0)
plot(mostValue, color = emaValue >= mostValue ? color.green : color.red)
• f_ottTrail(source, multiplier)
Short Definition: Calculates OTT-specific trailing stop value.
Details: This function calculates the trailing stop value for a given source in the manner used in OTT. Unlike a traditional trailing stop, this function modifies the traditional trailing stop value from two bars prior by adjusting it further with half the specified percentage. The 'multiplier' parameter defines the percentage of the trailing stop. Lower values are beneficial for catching short-term reversals, while higher values aid in identifying long-term trends. Although primarily used internally in this library, it has been made available for users who wish to utilize it as a trailing stop or use in custom OTT implementations.
Parameters:
source (float) : (series int/float) Series of values to process.
multiplier (simple float) : (simple float) Percent of trailing stop.
Returns: (float) Calculated value of OTT-specific trailing stop.
Example:
vidyaValue = ottlib.f_vidya(source = close, length = 20)
ottValue = ottlib.f_ottTrail(source = vidyaValue, multiplier = 1.5)
plot(ottValue, color = vidyaValue >= ottValue ? color.green : color.red)
• ott(source, length, multiplier)
Short Definition: Calculates OTT (Optimized Trend Tracker).
Details: The OTT consists of two lines. The first, known as the "Support Line", is the VIDYA of the given source. The second, called the "OTT Line", is the trailing stop based on the Support Line. The market is considered to be in an uptrend when the Support Line is above the OTT Line, and in a downtrend when it is below.
Parameters:
source (float) : (series float) Series of values to process. Default value is `close`.
length (simple int) : (simple int) Number of bars to lookback. Default value is `2`.
multiplier (simple float) : (simple float) Percent of trailing stop. Default value is `1.4`.
Returns: ( [ float, float ]) Tuple of `supportLine` and `ottLine`.
Example:
= ottlib.ott(source = close, length = 2, multiplier = 1.4)
longCondition = ta.crossover(supportLine, ottLine)
shortCondition = ta.crossunder(supportLine, ottLine)
• tott(source, length, multiplier, bandsMultiplier)
Short Definition: Calculates TOTT (Twin OTT).
Details: TOTT consists of three lines: the "Support Line," which is the VIDYA of the given source; the "Upper Line," a trailing stop of the Support Line adjusted with an added multiplier; and the "Lower Line," another trailing stop of the Support Line, adjusted with a reduced multiplier. The market is considered in an uptrend if the Support Line is above the Upper Line and in a downtrend if it is below the Lower Line.
Parameters:
source (float) : (series float) Series of values to process. Default value is `close`.
length (simple int) : (simple int) Number of bars to lookback. Default value is `40`.
multiplier (simple float) : (simple float) Percent of trailing stop. Default value is `0.6`.
bandsMultiplier (simple float) : Multiplier for bands. Default value is `0.0006`.
Returns: ( [ float, float, float ]) Tuple of `supportLine`, `upperLine` and `lowerLine`.
Example:
= ottlib.tott(source = close, length = 40, multiplier = 0.6, bandsMultiplier = 0.0006)
longCondition = ta.crossover(supportLine, upperLine)
shortCondition = ta.crossunder(supportLine, lowerLine)
• ott_channel(source, length, multiplier, ulMultiplier, llMultiplier)
Short Definition: Calculates OTT Channels.
Details: OTT Channels comprise nine lines. The central line, known as the "Mid Line," is the OTT of the given source's VIDYA. The remaining lines are positioned above and below the Mid Line, shifted by specified multipliers.
Parameters:
source (float) : (series float) Series of values to process. Default value is `close`
length (simple int) : (simple int) Number of bars to lookback. Default value is `2`
multiplier (simple float) : (simple float) Percent of trailing stop. Default value is `1.4`
ulMultiplier (simple float) : (simple float) Multiplier for upper line. Default value is `0.01`
llMultiplier (simple float) : (simple float) Multiplier for lower line. Default value is `0.01`
Returns: ( [ float, float, float, float, float, float, float, float, float ]) Tuple of `ul4`, `ul3`, `ul2`, `ul1`, `midLine`, `ll1`, `ll2`, `ll3`, `ll4`.
Example:
= ottlib.ott_channel(source = close, length = 2, multiplier = 1.4, ulMultiplier = 0.01, llMultiplier = 0.01)
• risotto(source, length, rsiLength, multiplier)
Short Definition: Calculates RISOTTO (RSI OTT).
Details: RISOTTO comprised of two lines: the "Support Line," which is the VIDYA of the given source's RSI value, calculated based on the length parameter, and the "RISOTTO Line," a trailing stop of the Support Line. The market is considered in an uptrend when the Support Line is above the RISOTTO Line, and in a downtrend if it is below.
Parameters:
source (float) : (series float) Series of values to process. Default value is `close`.
length (simple int) : (simple int) Number of bars to lookback. Default value is `50`.
rsiLength (simple int) : (simple int) Number of bars used for RSI calculation. Default value is `100`.
multiplier (simple float) : (simple float) Percent of trailing stop. Default value is `0.2`.
Returns: ( [ float, float ]) Tuple of `supportLine` and `risottoLine`.
Example:
= ottlib.risotto(source = close, length = 50, rsiLength = 100, multiplier = 0.2)
longCondition = ta.crossover(supportLine, risottoLine)
shortCondition = ta.crossunder(supportLine, risottoLine)
• sott(source, kLength, dLength, multiplier)
Short Definition: Calculates SOTT (Stochastic OTT).
Details: SOTT is comprised of two lines: the "Support Line," which is the VIDYA of the given source's Stochastic value, based on the %K and %D lengths, and the "SOTT Line," serving as the trailing stop of the Support Line. The market is considered in an uptrend when the Support Line is above the SOTT Line, and in a downtrend when it is below.
Parameters:
source (float) : (series float) Series of values to process. Default value is `close`.
kLength (simple int) : (simple int) Stochastic %K length. Default value is `500`.
dLength (simple int) : (simple int) Stochastic %D length. Default value is `200`.
multiplier (simple float) : (simple float) Percent of trailing stop. Default value is `0.5`.
Returns: ( [ float, float ]) Tuple of `supportLine` and `sottLine`.
Example:
= ottlib.sott(source = close, kLength = 500, dLength = 200, multiplier = 0.5)
longCondition = ta.crossover(supportLine, sottLine)
shortCondition = ta.crossunder(supportLine, sottLine)
• hottlott(length, multiplier)
Short Definition: Calculates HOTT & LOTT (Highest & Lowest OTT).
Details: HOTT & LOTT are composed of two lines: the "HOTT Line", which is the OTT of the highest price's VIDYA, and the "LOTT Line", the OTT of the lowest price's VIDYA. A high price surpassing the HOTT Line can be considered a long signal, while a low price dropping below the LOTT Line may indicate a short signal.
Parameters:
length (simple int) : (simple int) Number of bars to lookback. Default value is `20`.
multiplier (simple float) : (simple float) Percent of trailing stop. Default value is `0.6`.
Returns: ( [ float, float ]) Tuple of `hottLine` and `lottLine`.
Example:
= ottlib.hottlott(length = 20, multiplier = 0.6)
longCondition = ta.crossover(high, hottLine)
shortCondition = ta.crossunder(low, lottLine)
• rott(source, length, multiplier)
Short Definition: Calculates ROTT (Relative OTT).
Details: ROTT comprises two lines: the "Support Line", which is the VIDYA of the given source, and the "ROTT Line", the OTT of the Support Line's VIDYA. The market is considered in an uptrend if the Support Line is above the ROTT Line, and in a downtrend if it is below. ROTT is similar to OTT, but the key difference is that the ROTT Line is derived from the VIDYA of two bars of Support Line, not directly from it.
Parameters:
source (float) : (series float) Series of values to process. Default value is `close`.
length (simple int) : (simple int) Number of bars to lookback. Default value is `200`.
multiplier (simple float) : (simple float) Percent of trailing stop. Default value is `0.1`.
Returns: ( [ float, float ]) Tuple of `supportLine` and `rottLine`.
Example:
= ottlib.rott(source = close, length = 200, multiplier = 0.1)
isUpTrend = supportLine > rottLine
isDownTrend = supportLine < rottLine
• ft(source, length, majorMultiplier, minorMultiplier)
Short Definition: Calculates Fırsatçı Trend (Opportunist Trend).
Details: FT is comprised of two lines: the "Support Line", which is the VIDYA of the given source, and the "FT Line", a trailing stop of the Support Line calculated using both minor and major trend values. The market is considered in an uptrend when the Support Line is above the FT Line, and in a downtrend when it is below.
Parameters:
source (float) : (series float) Series of values to process. Default value is `close`.
length (simple int) : (simple int) Number of bars to lookback. Default value is `30`.
majorMultiplier (simple float) : (simple float) Percent of major trend. Default value is `3.6`.
minorMultiplier (simple float) : (simple float) Percent of minor trend. Default value is `1.8`.
Returns: ( [ float, float ]) Tuple of `supportLine` and `ftLine`.
Example:
= ottlib.ft(source = close, length = 30, majorMultiplier = 3.6, minorMultiplier = 1.8)
longCondition = ta.crossover(supportLine, ftLine)
shortCondition = ta.crossunder(supportLine, ftLine)
█ CUSTOM OTT CREATION
Users can create custom OTT implementations using f_ottTrail function in this library. The example code which uses EMA of 7 period as moving average and calculates OTT based of it is below.
Source Code:
//@version=5
indicator("Custom OTT", shorttitle = "COTT", overlay = true)
import ismailcarlik/ottlib/1 as ottlib
src = input.source(close, title = "Source")
length = input.int(7, title = "Length", minval = 1)
multiplier = input.float(2.0, title = "Multiplier", minval = 0.1)
support = ta.ema(source = src, length = length)
ott = ottlib.f_ottTrail(source = support, multiplier = multiplier)
pSupport = plot(support, title = "Moving Average Line (Support)", color = color.blue)
pOtt = plot(ott, title = "Custom OTT Line", color = color.orange)
fillColor = support >= ott ? color.new(color.green, 60) : color.new(color.red, 60)
fill(pSupport, pOtt, color = fillColor, title = "Direction")
Result:
█ DISCLAIMER
Trading is risky and most of the day traders lose money eventually. This library and its functions are only for educational purposes and should not be construed as financial advice. Past performances does not guarantee future results.
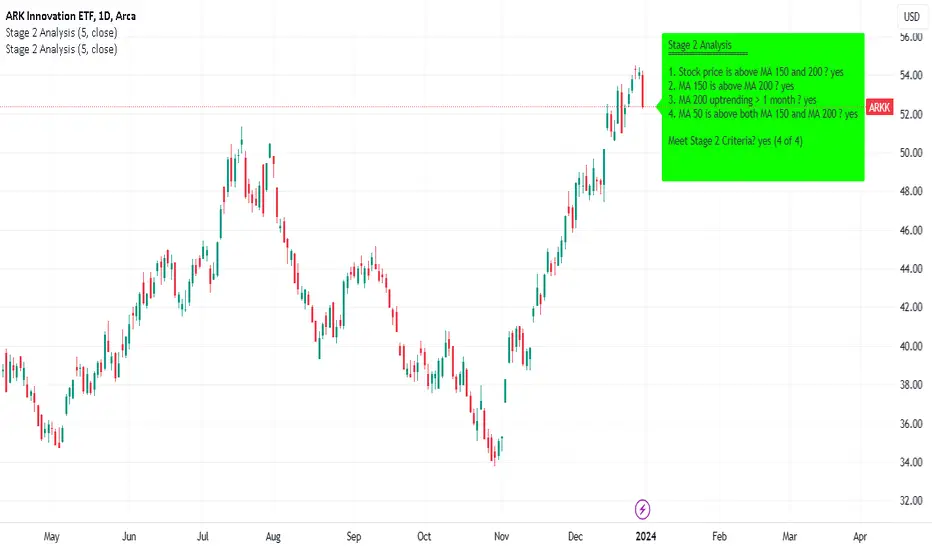
Minervini Stage 2 AnalysisHandbook for Minervini Stage 2 Analysis Indicator
Introduction
This handbook provides detailed instructions and guidelines for using the Minervini Stage 2 Analysis Indicator based on Mark Minervini's swing trading methodology. This indicator is designed for traders focusing on US stocks, aiming to capture gains in medium to short-term uptrends (swing trading).
Understanding Stage 2
Stage 2 represents a bullish uptrend in a stock's price. Mark Minervini emphasizes entering long positions during this phase. The stage is identified using four key criteria related to moving averages (MAs).
Indicator Criteria
Stock Price Above MA 150 and 200: Indicates an overall uptrend.
MA 150 Above MA 200: Signals a stronger medium-term trend compared to the long-term trend.
MA 200 Trending Up for At Least 1 Month (22 Days): Confirms a stable uptrend.
MA 50 Above Both MA 150 and 200: Shows short-term strength and momentum.
Using the Indicator
Entering Trades: Consider long positions when all four criteria are met. This signifies that the stock is in a Stage 2 uptrend.
Monitoring Trades: Regularly check if the stock continues to meet these criteria. The indicator provides a clear visual and textual representation for ease of monitoring.
Alarm Signals and Exit Strategy
One Criterion Not Met: This serves as an alarm signal. Increased vigilance is required, and traders should prepare for a potential exit.
Two Criteria Not Met: Strong indication to close the trade. This suggests the stock may be transitioning out of Stage 2, increasing the risk of holding the position.
Risk Management
Stop-Loss Orders: Consider setting a trailing stop-loss to protect profits and minimize losses.
Position Sizing: Adjust position sizes according to your risk tolerance and portfolio strategy.
Volume and Relative Strength Analysis
Volume Analysis: Look for increased trading volume as confirmation when the stock price moves above key MAs.
Relative Strength (RS) Rating: Compare the stock's performance to the broader market to gauge its strength.
Limitations and Considerations
Market Conditions: The indicator's effectiveness may vary with market conditions. It is more reliable in a bullish market environment.
Supplementary Analysis: Combine this indicator with other analysis methods (fundamental, technical) for a holistic approach.
Continuous Learning: Stay updated with market trends and adjust your strategy accordingly.
Conclusion
The Minervini Stage 2 Analysis Indicator is a powerful tool for identifying potential long positions in uptrending stocks. Its reliance on specific criteria aligns with Mark Minervini's proven swing trading strategy. However, always exercise due diligence and risk management in your trading decisions.
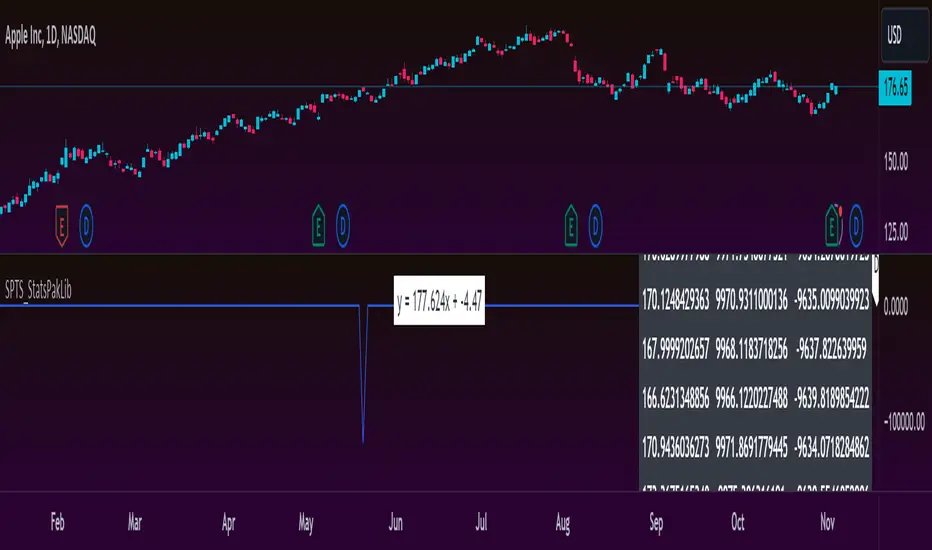
SPTS_StatsPakLibFinally getting around to releasing the library component to the SPTS indicator!
This library is packed with a ton of great statistics functions to supplement SPTS, these functions add to the capabilities of SPTS including a forecast function.
The library includes the following functions
1. Linear Regression (single independent and single dependent)
2. Multiple Regression (2 independent variables, 1 dependent)
3. Standard Error of Residual Assessment
4. Z-Score
5. Effect Size
6. Confidence Interval
7. Paired Sample Test
8. Two Tailed T-Test
9. Qualitative assessment of T-Test
10. T-test table and p value assigner
11. Correlation of two arrays
12. Quadratic correlation (curvlinear)
13. R Squared value of 2 arrays
14. R Squared value of 2 floats
15. Test of normality
16. Forecast function which will push the desired forecasted variables into an array.
One of the biggest added functionalities of this library is the forecasting function.
This function provides an autoregressive, trainable model that will export forecasted values to 3 arrays, one contains the autoregressed forecasted results, the other two contain the upper confidence forecast and the lower confidence forecast.
Hope you enjoy and find use for this!
Library "SPTS_StatsPakLib"
f_linear_regression(independent, dependent, len, variable)
TODO: creates a simple linear regression model between two variables.
Parameters:
independent (float)
dependent (float)
len (int)
variable (float)
Returns: TODO: returns 6 float variables
result: The result of the regression model
pear_cor: The pearson correlation of the regresion model
rsqrd: the R2 of the regression model
std_err: the error of residuals
slope: the slope of the model (coefficient)
intercept: the intercept of the model (y = mx + b is y = slope x + intercept)
f_multiple_regression(y, x1, x2, input1, input2, len)
TODO: creates a multiple regression model between two independent variables and 1 dependent variable.
Parameters:
y (float)
x1 (float)
x2 (float)
input1 (float)
input2 (float)
len (int)
Returns: TODO: returns 7 float variables
result: The result of the regression model
pear_cor: The pearson correlation of the regresion model
rsqrd: the R2 of the regression model
std_err: the error of residuals
b1 & b2: the slopes of the model (coefficients)
intercept: the intercept of the model (y = mx + b is y = b1 x + b2 x + intercept)
f_stanard_error(result, dependent, length)
x TODO: performs an assessment on the error of residuals, can be used with any variable in which there are residual values (such as moving averages or more comlpex models)
param x TODO: result is the output, for example, if you are calculating the residuals of a 200 EMA, the result would be the 200 EMA
dependent: is the dependent variable. In the above example with the 200 EMA, your dependent would be the source for your 200 EMA
Parameters:
result (float)
dependent (float)
length (int)
Returns: x TODO: the standard error of the residual, which can then be multiplied by standard deviations or used as is.
f_zscore(variable, length)
TODO: Calculates the z-score
Parameters:
variable (float)
length (int)
Returns: TODO: returns float z-score
f_effect_size(array1, array2)
TODO: Calculates the effect size between two arrays of equal scale.
Parameters:
array1 (float )
array2 (float )
Returns: TODO: returns the effect size (float)
f_confidence_interval(array1, array2, ci_input)
TODO: Calculates the confidence interval between two arrays
Parameters:
array1 (float )
array2 (float )
ci_input (float)
Returns: TODO: returns the upper_bound and lower_bound cofidence interval as float values
paired_sample_t(src1, src2, len)
TODO: Performs a paired sample t-test
Parameters:
src1 (float)
src2 (float)
len (int)
Returns: TODO: Returns the t-statistic and degrees of freedom of a paired sample t-test
two_tail_t_test(array1, array2)
TODO: Perofrms a two tailed t-test
Parameters:
array1 (float )
array2 (float )
Returns: TODO: Returns the t-statistic and degrees of freedom of a two_tail_t_test sample t-test
t_table_analysis(t_stat, df)
TODO: This is to make a qualitative assessment of your paired and single sample t-test
Parameters:
t_stat (float)
df (float)
Returns: TODO: the function will return 2 string variables and 1 colour variable. The 2 string variables indicate whether the results are significant or not and the colour will
output red for insigificant and green for significant
t_table_p_value(df, t_stat)
TODO: This performs a quantaitive assessment on your t-tests to determine the statistical significance p value
Parameters:
df (float)
t_stat (float)
Returns: TODO: The function will return 1 float variable, the p value of the t-test.
cor_of_array(array1, array2)
TODO: This performs a pearson correlation assessment of two arrays. They need to be of equal size!
Parameters:
array1 (float )
array2 (float )
Returns: TODO: The function will return the pearson correlation.
quadratic_correlation(src1, src2, len)
TODO: This performs a quadratic (curvlinear) pearson correlation between two values.
Parameters:
src1 (float)
src2 (float)
len (int)
Returns: TODO: The function will return the pearson correlation (quadratic based).
f_r2_array(array1, array2)
TODO: Calculates the r2 of two arrays
Parameters:
array1 (float )
array2 (float )
Returns: TODO: returns the R2 value
f_rsqrd(src1, src2, len)
TODO: Calculates the r2 of two float variables
Parameters:
src1 (float)
src2 (float)
len (int)
Returns: TODO: returns the R2 value
test_of_normality(array, src)
TODO: tests the normal distribution hypothesis
Parameters:
array (float )
src (float)
Returns: TODO: returns 4 variables, 2 float and 2 string
Skew: the skewness of the dataset
Kurt: the kurtosis of the dataset
dist = the distribution type (recognizes 7 different distribution types)
implication = a string assessment of the implication of the distribution (qualitative)
f_forecast(output, input, train_len, forecast_length, output_array, upper_array, lower_array)
TODO: This performs a simple forecast function on a single dependent variable. It will autoregress this based on the train time, to the desired length of output,
then it will push the forecasted values to 3 float arrays, one that contains the forecasted result, 1 that contains the Upper Confidence Result and one with the lower confidence
result.
Parameters:
output (float)
input (float)
train_len (int)
forecast_length (int)
output_array (float )
upper_array (float )
lower_array (float )
Returns: TODO: Will return 3 arrays, one with the forecasted results, one with the upper confidence results, and a final with the lower confidence results. Example is given below.
Triple EMA By Ozy
**Triple EMA By Ozy**
The "Triple EMA By Ozy" is a visual indicator that offers traders a clear and concise view of three exponential moving averages (EMAs) at a glance. This tool combines three common EMAs (20, 50, and 200) and additionally calculates and displays the slope angle of each EMA, allowing for a more precise identification of the current trend's direction and strength.
**Key Features:**
1. **Three EMAs in One Indicator:** The 20, 50, and 200-period EMAs are popular among traders and are crucial for identifying short, medium, and long-term trends.
2. **Slope Angle:** The indicator calculates the slope angle for each EMA, which can be indicative of the trend's strength. A positive angle suggests bullish momentum, while a negative angle indicates bearish momentum.
3. **Clear Visual Indication:** The indicator uses colors to easily distinguish between EMAs and also to identify the direction of the slope angle (green for positive, red for negative).
**How to Use:**
- An increasing angle in the EMA20 may indicate the beginning of a new short-term upward trend.
- A decreasing angle in the EMA200 might signal a long-term downtrend gaining strength.
- Crosses between the EMAs can also be points of interest, like the golden cross (EMA50 crossing above the EMA200) or the death cross (EMA50 crossing below the EMA200).
**Triple EMA By Ozy**
El "Triple EMA By Ozy" es un indicador visual que proporciona a los traders una visión clara y concisa de tres medias móviles exponenciales (EMAs) en un solo vistazo. Esta herramienta combina tres EMAs comunes (20, 50 y 200) y, además, calcula y muestra el ángulo de inclinación de cada EMA para identificar con mayor precisión la dirección y la fuerza de la tendencia actual.
**Características principales:**
1. **Tres EMAs en un solo indicador:** Las EMAs de 20, 50 y 200 períodos son populares entre los traders y son esenciales para identificar tendencias a corto, mediano y largo plazo.
2. **Ángulo de inclinación:** El indicador calcula el ángulo de inclinación de cada EMA, que puede ser un indicativo de la fuerza de la tendencia. Un ángulo positivo sugiere un impulso alcista, mientras que un ángulo negativo indica un impulso bajista.
3. **Indicación visual clara:** El indicador utiliza colores para distinguir fácilmente entre EMAs y también para identificar la dirección del ángulo de inclinación (verde para positivo, rojo para negativo).
**Cómo usar:**
- Un ángulo creciente en la EMA20 puede indicar el comienzo de una nueva tendencia al alza a corto plazo.
- Un ángulo decreciente en la EMA200 puede ser una señal de una tendencia bajista a largo plazo que está ganando fuerza.
- Los cruces entre las EMAs también pueden ser puntos de interés, como el cruce dorado (EMA50 cruza por encima de la EMA200) o el cruce de la muerte (EMA50 cruza por debajo de la EMA200).

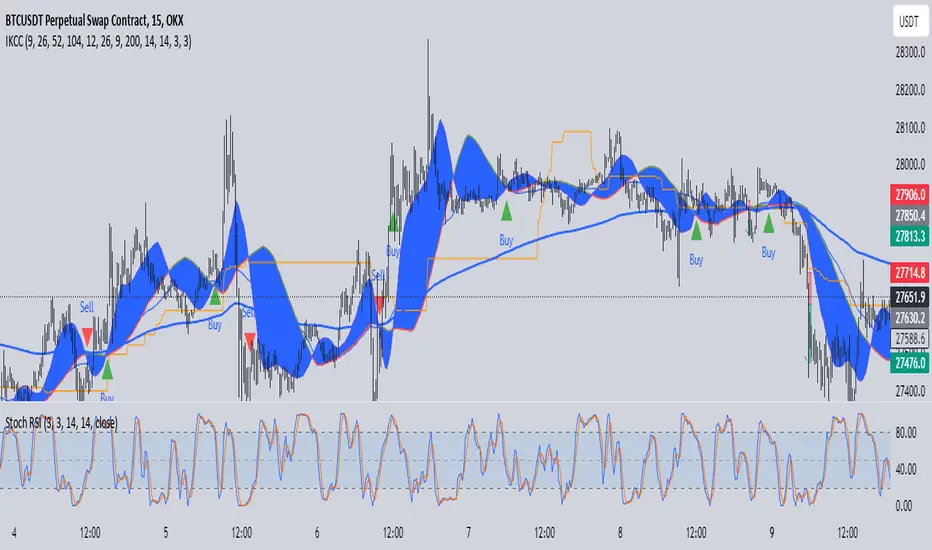
IchimokuBuy Sell With Stoch RSIIchimoku Kumo Cloud Crossover Indicator
The "Ichimoku Kumo Cloud Crossover" indicator is a custom technical analysis tool designed for use in the TradingView platform. This indicator is built to assist traders in identifying potential buy and sell signals based on a combination of Ichimoku Cloud analysis, Moving Average Convergence Divergence (MACD), Exponential Moving Average (EMA), Relative Strength Index (RSI), and Stochastic RSI.
Key Components and Parameters:
Ichimoku Kumo Cloud Calculation:
The Ichimoku Kumo Cloud is calculated using the Ichimoku Cloud's Conversion Line and Base Line.
Conversion Line, Base Line, Leading Span 1, and Leading Span 2:
These are key components of the Ichimoku Cloud, and they help identify trends and potential support/resistance levels in the market.
MACD Oscillator:
The Moving Average Convergence Divergence (MACD) is used to gauge the strength and direction of the trend.
EMA 200 (Exponential Moving Average):
The EMA 200 is a long-term moving average used to identify the overall trend direction.
RSI (Relative Strength Index):
The RSI is a momentum oscillator that measures the speed and change of price movements, helping to identify overbought and oversold conditions.
Stochastic RSI (Stoch RSI):
Stoch RSI is calculated based on the RSI values and helps to identify overbought and oversold conditions in a more dynamic manner.
Signal Generation:
The indicator generates buy and sell signals based on the following criteria:
Buy Signal (Long Position):
The Conversion Line crosses above the Base Line (Ichimoku Cloud crossover).
The closing price is above the EMA 200, indicating a bullish bias.
The RSI is between 50 and 70, suggesting the potential for an uptrend.
The MACD Histogram is positive, indicating increasing bullish momentum.
The high price is at least 25% above the EMA 200.
Sell Signal (Short Position):
The Conversion Line crosses below the Base Line (Ichimoku Cloud crossover).
The closing price is below the EMA 200, indicating a bearish bias.
The RSI is between 20 and 50, suggesting the potential for a downtrend.
The MACD Histogram is negative, indicating increasing bearish momentum.
The low price is at least 25% below the EMA 200.
Stoch RSI Filter:
Additionally, a filter based on Stoch RSI slope is applied. The indicator will only open a position if the Stoch RSI is declining for short positions (sell) and rising for long positions (buy).
Visualization:
Buy signals are marked with green triangles below the bars.
Sell signals are marked with red triangles above the bars.
The Ichimoku Cloud is plotted in the background, with cloud colors changing based on whether the Conversion Line or Base Line is higher.
This indicator can be a valuable tool for traders looking to combine multiple technical analysis techniques to make informed trading decisions in the financial markets.
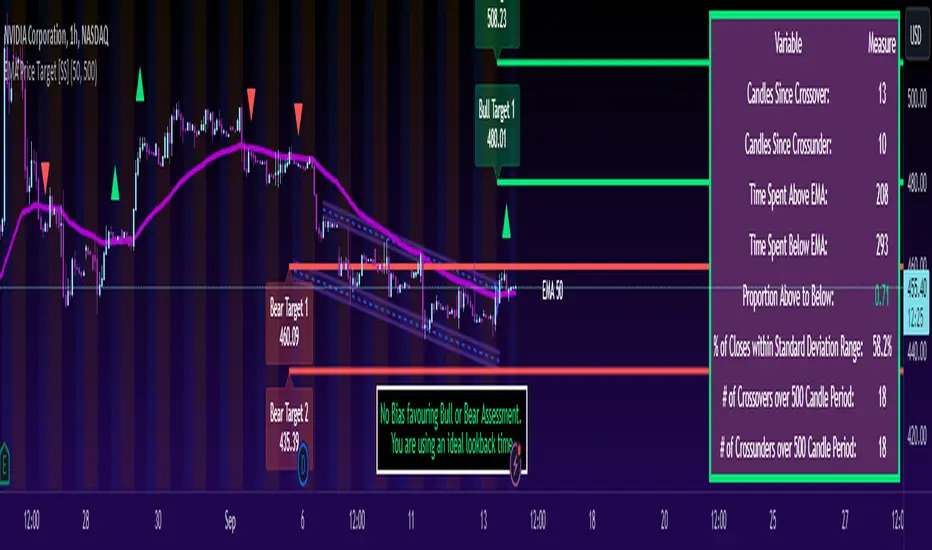
ATR Based EMA Price Targets [SS]As requested...
This is a spinoff of my EMA 9/21 cross indicator with price targets.
A few of you asked for a simple EMA crossover version and that is what this is.
I have, of course, added a bit of extra functionality to it, assuming you would want to transition from another EMA indicator to this one, I tried to leave it somewhat customizable so you can get the same type of functionality as any other EMA based indicator just with the added advantage of having an ATR based assessment added on. So lets get into the details:
What it does:
Same as my EMA 9/21, simply performs a basic ATR range analysis on a ticker, calculating the average move it does on a bullish or bearish cross.
How to use it:
So there are quite a few functions of this indicator. I am going to break them down one by one, from most basic to the more complex.
Plot functions:
EMA is Customizable: The EMA is customizable. If you want the 200, 100, 50, 31, 9, whatever you want, you just have to add the desired EMA timeframe in the settings menu.
Standard Deviation Bands are an option: If you like to have standard deviation bands added to your EMA's, you can select to show the standard deviation band. It will plot the standard deviation for the desired EMA timeframe (so if it is the EMA 200, it will plot the Standard Deviation on the EMA 200).
Plotting Crossovers: You can have the indicator plot green arrows for bullish crosses and red arrows for bearish crosses. I have smoothed out this function slightly by only having it signal a crossover when it breaks and holds. I pulled this over to the alert condition functions as well, so you are not constantly being alerted when it is bouncing over and below an EMA. Only once it chooses a direction, holds and moves up or down, will it alert to a true crossover.
Plotting labels: The indicator will default to plotting the price target labels and the EMA label. You can toggle these on and off in the EMA settings menu.
Trend Assessment Settings:
In addition to plotting the EMA itself and signaling the ATR ranges, the EMA will provide you will demographic information about the trend and price action behaviour around the EMA. You can see an example in the image below:
This will provide you with a breakdown of the statistics on the EMA over the designated lookback period, such as the number of crosses, the time above and below the EMA and the amount the EMA has remained within its standard deviation bands.
Where this is important is the proportion assessment. And what the proportion assessment is doing is its measuring the amount of time the ticker is spending either above or below the EMA.
Ideally, you should have relatively equal and uniform durations above and below. This would be a proportion of between 0.5 and 1.5 Above to Below. Now, you don't have to remember this because you can ask the indicator to do the assessment for you. It will be displayed at the bottom of your chart in a table that you can toggle on and off:
Example of a Uniform Assessment:
Example of a biased assessment:
Keep in mind, if you are using those very laggy EMAs (like the 50, 200, 100 etc.) on the daily timeframe, you aren't going to get uniformity in the data. This is because, stocks are technically already biased to the upside over time. Thus, when you are looking at the big picture, the bull bias thesis of the stock market is in play.
But for the smaller and moderate timeframes, owning to the randomness of price action, you can generally get uniformity in data representation by simply adjusting your lookback period.
To adjust your lookback period, you simply need to change the timeframe for the ATR lookback length. I suggest no less than 500 and probably no more than 1,500 candles, and work within this range. But you can use what the indicator indicates is appropriate.
Of course, all of these charts can be turned off and you are left with a clean looking EMA indicator:
And an example with the standard deviation bands toggled on:
And that, my friends, is the indicator.
Hopefully this is what you wanted, let me know if you have any suggestions.
Enjoy and safe trades!
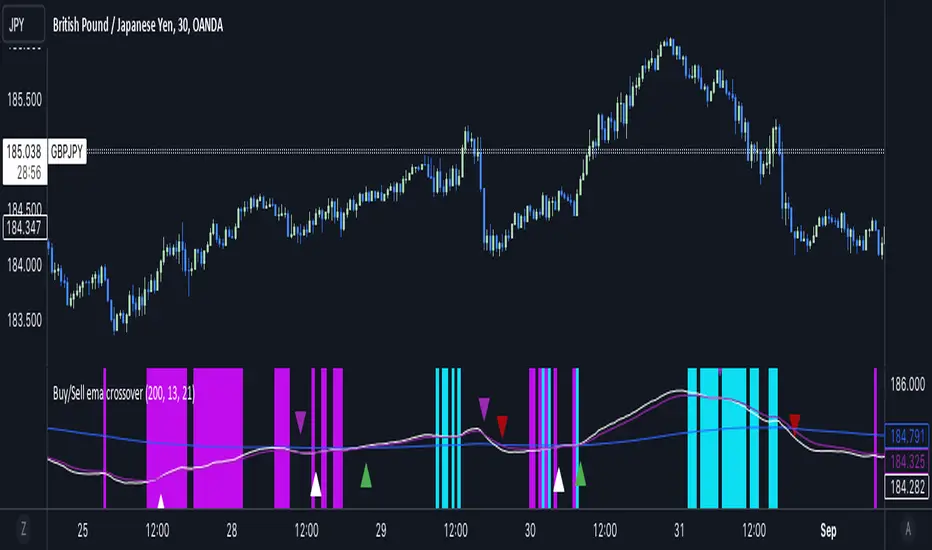
Buy/Sell EMA CrossoverThe indicator identifies potential trading opportunities within the market. It is entirely based on the combination of exponential moving averages by drawing triangles on the chart that identify buy or sell signals combined with vertical bars that create areas of interest.
Specifically, when a buy signal occurs, the indicator draws a vertical bar with an azure background, indicating a possible buy area. Similarly, a sell signal is represented by a vertical bar with a fuchsia background, indicating a possible sell area.
These areas represent the main point of the indicator which uses exponential moving averages which, based on the direction of prices, identify the trend and color the background of the graph in order to visually highlight the predominant trend.
The green triangles above the bars of the chart suggest possible upside opportunities (good bullish entry points) when the 21 ema crosses the 200 ema.
While on the contrary the red triangles, 21 ema lower than the 200 ema, can indicate possible bearish trends (good bearish entry points).
While the white and purple triangles reveal moments of potential indecision or market change.
We can think of them as situations of uncertain trend in which it is possible to place a long or short order near some conditions that we are going to see.
The white triangles below, which are created when the 13 ema is higher than the 21 ema, indicate a possible bullish zone while the purple triangles above (13 ema lower than the 21) could suggest a bearish reflex
Colored lines represent moving averages blue = 200, 21= fuchsia and 13 = white. If the price is above the 200 period line then it could be a bullish opportunity, otherwise it could be a bearish one.
An interesting strategy to adopt is to evaluate, for example, the inputs near the vertical bars (azure - long) (fuchsia - short) when a white or purple triangle appears.
The more prominent green triangle indicates that the trend is going in a long direction.
On the contrary, the red (short) triangles are the opposite of the green ones and have the same importance as input logic.
The white triangle instead present more often inside the indicator identifies interesting buying areas of short duration, it is important to consider that the closer the triangles are to the vertical blue bars the stronger the entry signal.
Finally, the purple triangles are the short-term bearish trends whose entry near the fuchsia vertical bars defines a short.
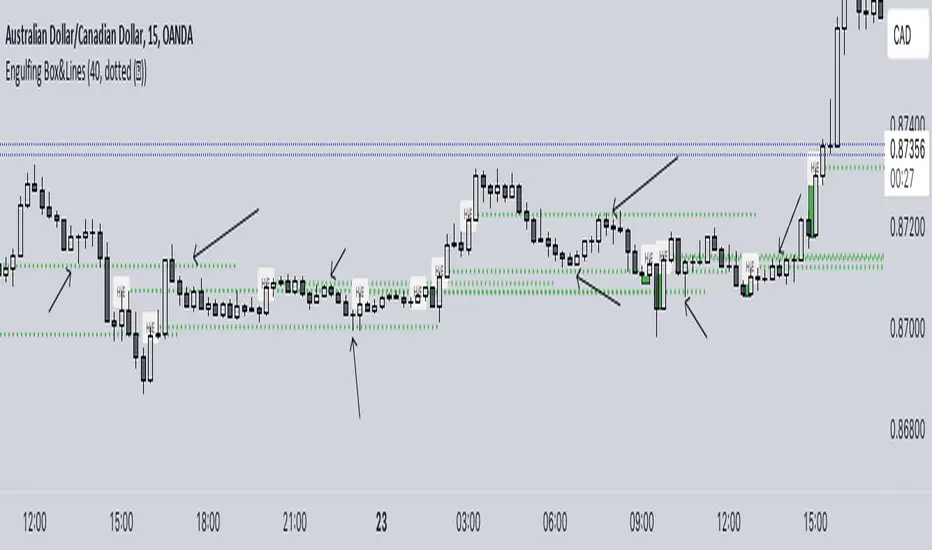
Engulfing Box & LinesThe "Engulfing Box & Lines" indicator aims to spot and highlight Engulfing candlestick patterns within a trend. These patterns can provide valuable indications of a possible trend reversal, and the indicator underlines them through the use of colored rectangles and horizontal lines. To fully understand the functioning and use of this indicator, let's explore its key elements and associated strategies.
Identification of Engulfing Patterns:
The indicator focuses on detecting two types of Engulfing candles:
Bullish Engulfing: Occurs when a bullish candle (open lower than close) completely encloses the body of the previous bearish candle. This could indicate a possible upside reversal.
Bearish Engulfing: Occurs when a bearish candle (opening higher than closing) entirely engulfs the body of the previous bullish candle. This could signal a potential bearish reversal.
Using the EMA 200:
The indicator uses the 200-period Exponential Moving Average (EMA) as a reference to determine the position of the candles with respect to the long-term trend. When the price is above the 200 EMA, the bullish Engulfing candles are highlighted with a green box, while below the 200 EMA, red boxes are shown for the bearish Engulfing candles.
Size of Boxes and Lines:
The colored boxes represent the size of the body of the candle that caused the Engulfing. Additionally, a horizontal line is drawn close to the body of the candle, serving as the fulcrum of the indicator.
Trading Strategies:
This indicator can be used for different trading strategies:
Trend Continuation: During a positive trend, the onset of an engulfing pattern suggests a possible continuation of the trend. The horizontal lines represent potential support areas, where the price could bounce. Traders might consider buying during such bounces.
Retracements and Entries: Lines can act as support or resistance zones, depending on the trend. When the price approaches a line, a retracement could occur. Traders might move to a lower timeframe to spot entry signals, using the line as a reference.
Closing Positions: Lines could also be used to define exit levels. For example, a trader might decide to exit a position when the price approaches a resistance line.
Confirmations with Other Indicators: The indicator could be used in conjunction with other technical tools, such as oscillators or candlestick analysis, to confirm signals and improve the accuracy of trading decisions.
Engulfing Signals
Okay, so we've got an indicator here that prints buy sell signals based on engulfing candles and uses a 200 EMA and RSI to filter out some of the noise.
This indicator incorporates price action, in the form of engulfing candles, moving averages and a momentum oscillator. It also has the of plotting either a Simple Moving Average or an Exponential Moving Average over varying periods in order to determine if price is respecting a certain level or to develop more accurately-timed alert signals. Engulfing candles can be a good indication of a change in sentiment and momentum.
Engulfing candles can be a good indication of a change in market behaviour but they happen far too often to be of any practical use by themselves.
In order to filter out some of the weaker candles, I have incorporated RSI into this script. The indicator will provide a BUY signal only when an engulfing candle prints and there is a reading of above 50 on the RSI, which is considered to reflect overall bullish sentiment. The signal is printed directly on the chart as a small green triangle just under the engulfing candle.
In contrast, the indicator will provide a SELL signal only when an engulfing candle prints and there is a reading of below 50 on the RSI, which is considered to reflect overall bearish sentiment. The signal is printed directly on the chart as a small red triangle just above the engulfing candle.
In order to maintain a clean chart and maximise the opportunity to couple this indicator up with other indicators that may increase the accuracy of the signals even further, the RSI will not be shown on the chart. However, to verify the accuracy of the signals please feel free to load the RSI indicator onto your chart and you will see that the signals only print according to the conditions described above.
In order to further filter out weaker signals I have made a rule that a buy signal should only print if it is above the 200 EMA and a sell signal only if the engulfing candle is below the 200 EMA. I use the 200 EMA because it is a commonly accepted indication of the general trend and to make the signals as accurate as possible we want to be trading with the longer trend, not against it.
The indicator will not print signals for engulfing candles outside of these parameters.
I suggest combining this indicator with a shorter moving average such as a 9, 14 or 20 perhaps. There is no need to add an additional indicator. You can do this directly in the settings menu. This unique feature allows you to study possible levels that price may or may not be respecting.
Alternatively, you could use the MACD to filter out some of the weaker signals, though bear in mind that the RSI is already doing that to some degree before the signal even prints.
To my knowledge there is no other indicator out there that combines these three concepts but, as you will see, doing so provides some high quality signals.

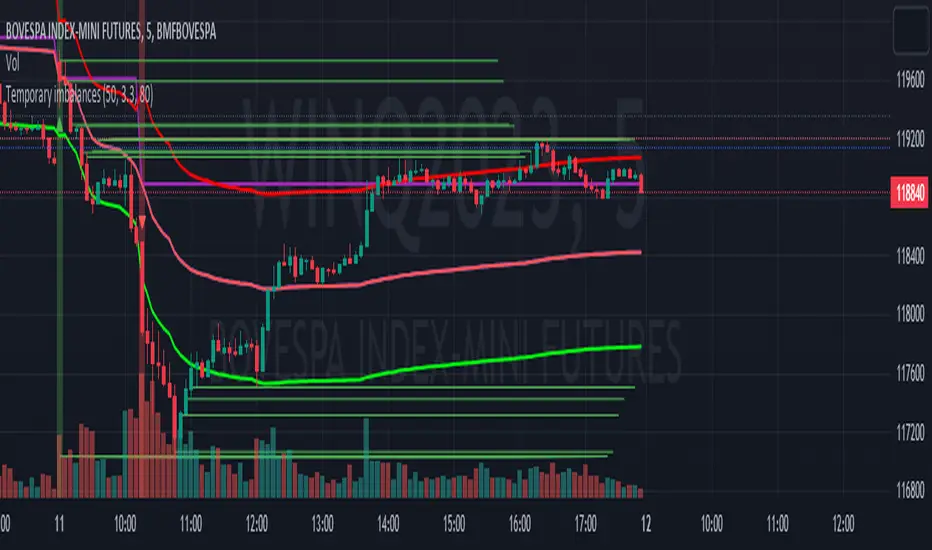
Temporary imbalancesThis indicator is designed to identify imbalances in order flow and market liquidity, It highlights candles with significant imbalances and draws reference lines
The indicator calculates imbalance based on changes in closing prices and volume. It uses the standard deviation to determine the significant imbalance threshold. Candles with bullish imbalances are highlighted in green, while candles with bearish imbalances are highlighted in red.
Furthermore, the indicator includes features of latency arbitrage and liquidity analysis. Latency arbitrage looks for price differences between the anchored VWAP and bid/ask quotes, targeting trading opportunities based on these differences. The liquidity analysis verifies the liquidity imbalance and calculates the VWAP anchored on this value in total using 4 VWAP.
This indicator can be adjusted according to the preferences and characteristics of the specific asset or market. It provides clear visual information and can be used as a complementary tool for technical analysis in trading strategies.
Interesting Segment Length 20,50,80,200
and Interesting lookback period 20,50,80,200
Interesting imbalance threshold 1.5, 2.4, 3.3 ,4.2
Este indicador é projetado para identificar desequilíbrios no fluxo de ordens e na liquidez do mercado, Ele destaca velas com desequilíbrios significativos e traça linhas de referência
O indicador calcula o desequilíbrio com base nas mudanças nos preços de fechamento e no volume. Ele usa o desvio padrão para determinar o limiar de desequilíbrio significativo. As velas com desequilíbrios de alta são destacadas em verde, enquanto as velas com desequilíbrios de baixa são destacadas em vermelho.
Além disso, o indicador inclui recursos de arbitragem de latência e análise de liquidez. A arbitragem de latência procura diferenças de preços entre a VWAP ancorada e as cotações de compra/venda, visando oportunidades de negociação com base nessas diferenças. A análise de liquidez verifica o desequilíbrio de liquidez e calcula a VWAP ancorada nesse valor ao total utiliza 4 VWAP.
Este indicador pode ser ajustado de acordo com as preferências e características do ativo ou mercado específico. Ele fornece informações visuais claras e pode ser usado como uma ferramenta complementar para análise técnica em estratégias de negociação.
Comprimento do Segmento interessante para usa 20,50,80,200
e Período de lookback interessante para usa 20,50,80,200
Limiar de desequilíbrio interessante para usa 1.5 ,2.4, 3.3 ,4.2
Trend Correlation HeatmapHello everyone!
I am excited to release my trend correlation heatmap, or trend heatmap for short.
Per usual, I think its important to explain the theory before we get into the use of the indicator, so let's get into the theory!
The theory:
So what is a correlation?
Correlation is the relationship one variable has to another. Correlations are the basis of everything I do as a quantitative trader. From the correlation between the same variables (i.e. autocorrelation), the correlation between other variables (i.e. VIX and SPY, SPY High and SPY Low, DXY and ES1! close, etc.) and, as well, the correlation between price and time (time series correlation).
This may sound very familiar to you, especially if you are a user, observer or follower of my ideas and/or indicators. Ninety-five percent of my indicators are a function of one of those three things. Whether it be a time series based indicator (i.e.my time series indicator), whether it be autocorrelation (my autoregressive cloud indicator or my autocorrelation oscillator) or whether it be regressive in nature (i.e. my SPY Volume weighted close, or even my expected move which uses averages in lieu of regressive approaches but is foundational in regression principles. Or even my VIX oscillator which relies on the premise of correlations between tickers.) So correlation is extremely important to me and while its true I am more of a regression trader than anything, I would argue that I am more of a correlation trader, because correlations are the backbone of how I develop math models of stocks.
What I am trying to stress here is the importance of correlations. They really truly are foundational to any type of quantitative analysis for stocks. And as such, understanding the current relationship a stock has to time is pivotal for any meaningful analysis to be conducted.
So what is correlation to time and what does it tell us?
Correlation to time, otherwise known and commonly referred to as "Time Series", is the relationship a ticker's price has to the passing of time. It is displayed in the traditional Pearson Correlation Coefficient or R value and can be any value from -1 (strong negative relationship, i.e. a strong downtrend) to + 1 (i.e. a strong positive relationship, i.e. a strong uptrend). The higher or lower the value the stronger the up or downtrend is.
As such, correlation to time tells us two very important things. These are:
a) The direction of the stock; and
b) The strength of the trend.
Let's take a look at an example:
Above we have a chart of QQQ. We can see a trendline that seems to fit well. The questions we ask as traders are:
1. What is the likelihood QQQ breaks down from this trendline?
2. What is the likelihood QQQ continues up?
3. What is the likelihood QQQ does a false breakdown?
There are numerous mathematical approaches we can take to answer these questions. For example, 1 and 2 can be answered by use of a Cumulative Distribution Density analysis (CDDA) or even a linear or loglinear regression analysis and 3 can be answered, more or less, with a linear regression analysis and standard error ascertainment, or even just a general comparison using a data science approach (such as cosine similarity or Manhattan distance).
But, the reality is, all 3 of these questions can be visualized, at least in some way, by simply looking at the correlation to time. Let's look at this chart again, this time with the correlation heatmap applied:
If we look at the indicator we can see some pivotal things. These are:
1. We have 4, very strong uptrends that span both higher AND lower timeframes. We have a strong uptrend of 0.96 on the 5 minute, 50 candle period. We have a strong uptrend at the 300 candle lookback period on the 1 minute, we have a strong uptrend on the 100 day lookback on the daily timeframe period and we have a strong uptrend on the 5 minute on the 500 candle lookback period.
2. By comparison, we have 3 downtrends, all of which have correlations less than the 4 uptrends. All of the downtrends have a correlation above -0.8 (which we would want lower than -0.8 to be very strong), and all of the uptrends are greater than + 0.80.
3. We can also see that the uptrends are not confined to the smaller timeframes. We have multiple uptrends on multiple timeframes and both short term (50 to 100 candles) and long term (up to 500 candles).
4. The overall trend is strengthening to the upside manifested by a positive Max Change and a Positive Min change (to be discussed later more in-depth).
With this, we can see that QQQ is actually very strong and likely will continue at least some upside. If we let this play out:
We continued up, had one test and then bounced.
Now, I want to specify, this indicator is not a panacea for all trading. And in relation to the 3 questions posed, they are best answered, at least quantitatively, not only by correlation but also by the aforementioned methods (CDDA, etc.) but correlation will help you get a feel for the strength or weakness present with a stock.
What are some tangible applications of the indicator?
For me, this indicator is used in many ways. Let me outline some ways I generally apply this indicator in my day and swing trading:
1. Gauging the strength of the stock: The indictor tells you the most prevalent behavior of the stock. Are there more downtrends than uptrends present? Are the downtrends present on the larger timeframes vs uptrends on the shorter indicating a possible bullish reversal? or vice versa? Are the trends strengthening or weakening? All of these things can be visualized with the indicator.
2. Setting parameters for other indicators: If you trade EMAs or SMAs, you may have a "one size fits all" approach. However, its actually better to adjust your EMA or SMA length to the actual trend itself. Take a look at this:
This is QQQ on the 1 hour with the 200 EMA with 200 standard deviation bands added. If we look at the heatmap, we can see, yes indeed 200 has a fairly strong uptrend correlation of 0.70. But the strongest hourly uptrend is actually at 400 candles, with a correlation of 0.91. So what happens if we change the EMA length and standard deviation to 400? This:
The exact areas are circled and colour coded. You can see, the 400 offers more of a better reference point of supports and resistances as well as a better overall trend fit. And this is why I never advocate for getting married to a specific EMA. If you are an EMA 200 lover or 21 or 51, know that these are not always the best depending on the trend and situation.
Components of the indicator:
Ah okay, now for the boring stuff. Let's go over the functionality of the indicator. I tried to keep it simple, so it is pretty straight forward. If we open the menu here are our options:
We have the ability to toggle whichever timeframes we want. We also have the ability to toggle on or off the legend that displays the colour codes and the Max and Min highest change.
Max and Min highest change: The max and min highest change simply display the change in correlation over the previous 14 candles. An increasing Max change means that the Max trend is strengthening. If we see an increasing Max change and an increasing Min change (the Min correlation is moving up), this means the stock is bullish. Why? Because the min (i.e. ideally a big negative number) is going up closer to the positives. Therefore, the downtrend is weakening.
If we see both the Max and Min declining (red), that means the uptrend is weakening and downtrend is strengthening. Here are some examples:
Final Thoughts:
And that is the indicator and the theory behind the indicator.
In a nutshell, to summarize, the indicator simply tracks the correlation of a ticker to time on multiple timeframes. This will allow you to make judgements about strength, sentiment and also help you adjust which tools and timeframes you are using to perform your analyses.
As well, to make the indicator more user friendly, I tried to make the colours distinctively different. I was going to do different shades but it was a little difficult to visualize. As such, I have included a toggle-able legend with a breakdown of the colour codes!
That's it my friends, I hope you find it useful!
Safe trades and leave your questions, comments and feedback below!

Anchored VWAP+This indicator is an enhanced version of the Anchored VWAP indicator with additional functions:
1. Anchored AP (average price). It removes the volume weighting step in Anchored VWAP, and can display the average price over a period of time. For example, if the price of the stock in the last 3 days is 100, 200, 300, then AP is their average value of 200
2. Anchored AC (average cost). The average cost over time can be displayed. For example, if the price of the stock in the last 2 days is 100,300, then AC is (1+1)/(1/100+1/300)=150
When using the indicator, you need to choose a starting point, then the indicator will start to calculate the subsequent VWAP, AP and AC from this starting point, and draw 3 lines in the graph
These three lines can be regarded as the average cost line of the market, with potential support and resistance effects
We have filled the shadow between VWAP and AP, which can be regarded as a potential support resistance band
===========================中文版本===========================
该指标为增强版本的Anchored VWAP指标。在Anchored VWAP基础上增加了额外功能:
1. Anchored AP。其去掉了Anchored VWAP中成交量加权的步骤,可以显示一段时间的平均价格。举个例子,假如股票最近3天的价格为100,200,300,那么AP为他们的平均值200
2. Anchored AC。可以显示一段时间的平均成本。举个例子,假如股票最近2天的价格为100,300,那么AC为(1+1)/(1/100+1/300)=150
使用指标时你需要先选择一个起点,随后指标将会以该起点开始计算后续的VWAP、AP和AC,并且在图中绘制3根线
这3根线均可以视作是市场的平均成本线,具有潜在的支撑和阻力效果
我们让VWAP和AP之间填充了阴影,该阴影可以视作潜在的支撑阻力带

D-BoT Alpha 'Short' SMA and RSI StrategyDostlar selamlar,
İşte son derece basit ama etkili ve hızlı, HTF de çok iyi sonuçlar veren bir strateji daha, hepinize bol kazançlar dilerim ...
Nedir, Nasıl Çalışır:
Strateji, iki ana girdiye dayanır: SMA ve RSI. SMA hesaplama aralığı 200 olarak, RSI ise 14 olarak ayarlanmıştır. Bu değerler, kullanıcı tercihlerine veya geriye dönük test sonuçlarına göre ayarlanabilir.
Strateji, iki koşul karşılandığında bir short sinyali oluşturur: RSI değeri, belirlenen bir giriş seviyesini (burada 51 olarak belirlenmiş) aşar ve kapanış fiyatı SMA değerinin altındadır.
Strateji, kısa pozisyonu üç durumda kapatır: Kapanış fiyatı, takip eden durdurma seviyesinden (pozisyon açıldığından beri en düşük kapanış olarak belirlenmiştir) büyükse, RSI değeri belirlenen bir durdurma seviyesini (bu durumda 54) aşarsa veya RSI değeri belirli bir kar al seviyesinin (bu durumda 32) altına düşerse.
Güçlü Yönleri:
İki farklı gösterge (SMA ve RSI) kullanımı, yalnızca birini kullanmaktan daha sağlam bir sinyal sağlayabilir.
Strateji, karları korumaya ve fiyat dalgalanmalarında kayıpları sınırlamaya yardımcı olabilecek bir iz süren durdurma seviyesi içerir.
Script oldukça anlaşılır ve değiştirmesi nispeten kolaydır.
Zayıf Yönleri:
Strateji, hacim, oynaklık veya daha geniş piyasa eğilimleri gibi diğer potansiyel önemli faktörleri göz önünde bulundurmaz.
RSI seviyeleri ve SMA süresi için belirli parametreler sabittir ve tüm piyasa koşulları veya zaman aralıkları için optimal olmayabilir.
Strateji oldukça basittir. Trade maliyetini (kayma veya komisyonlar gibi) hesaba katmaz, bu da trade performansını önemli ölçüde etkileyebilir.
Bu Stratejiyle Nasıl İşlem Yapılır:
Strateji, short işlemler için tasarlanmıştır. RSI, 51'in üzerine çıktığında ve kapanış fiyatı 200 periyotluk SMA'nın altında olduğunda işleme girer. RSI, 54'ün üzerine çıktığında veya 32'nin altına düştüğünde veya fiyat, pozisyon açıldığından beri en düşük kapanış fiyatının üzerine çıktığında işlemi kapatır.
Lütfen Dikkat, bu strateji veya herhangi bir strateji izole bir şekilde kullanılmamalıdır. Tüm bu çalışmalar eğitsel amaçlıdır. Yatırım tavsiyesi içermez.
This script defines a trading strategy based on Simple Moving Average (SMA) and the Relative Strength Index (RSI) indicators. Here's an overview of how it works, along with its strengths and weaknesses, and how to trade using this strategy:
How it works:
The strategy involves two key inputs: SMA and RSI. The SMA length is set to 200, and the RSI length is set to 14. These values can be adjusted based on user preferences or back-testing results.
The strategy generates a short signal when two conditions are met: The RSI value crosses over a defined entry level (set at 51 here), and the closing price is below the SMA value.
When a short signal is generated, the strategy opens a short position.
The strategy closes the short position under three conditions: If the close price is greater than the trailing stop (which is set as the lowest close since the position opened), if the RSI value exceeds a defined stop level (54 in this case), or if the RSI value drops below a certain take-profit level (32 in this case).
Strengths:
The use of two different indicators (SMA and RSI) can provide a more robust signal than using just one.
The strategy includes a trailing stop, which can help to protect profits and limit losses as the price fluctuates.
The script is straightforward and relatively easy to understand and modify.
Weaknesses:
The strategy doesn't consider other potentially important factors, such as volume, volatility, or broader market trends.
The specific parameters for the RSI levels and SMA length are hard-coded, and may not be optimal for all market conditions or timeframes.
The strategy is very simplistic. It doesn't take into account the cost of trading (like slippage or commissions), which can significantly impact trading performance.
How to trade with this strategy:
The strategy is designed for short trades. It enters a trade when the RSI crosses above 51 and the closing price is below the 200-period SMA. It will exit the trade when the RSI goes above 54 or falls below 32, or when the price rises above the lowest closing price since the position was opened.
Please note, this strategy or any strategy should not be used in isolation. It's important to consider other aspects of trading such as risk management, capital allocation, and combining different strategies to diversify. Back-testing the strategy on historical data and demo trading before going live is also a recommended practice.

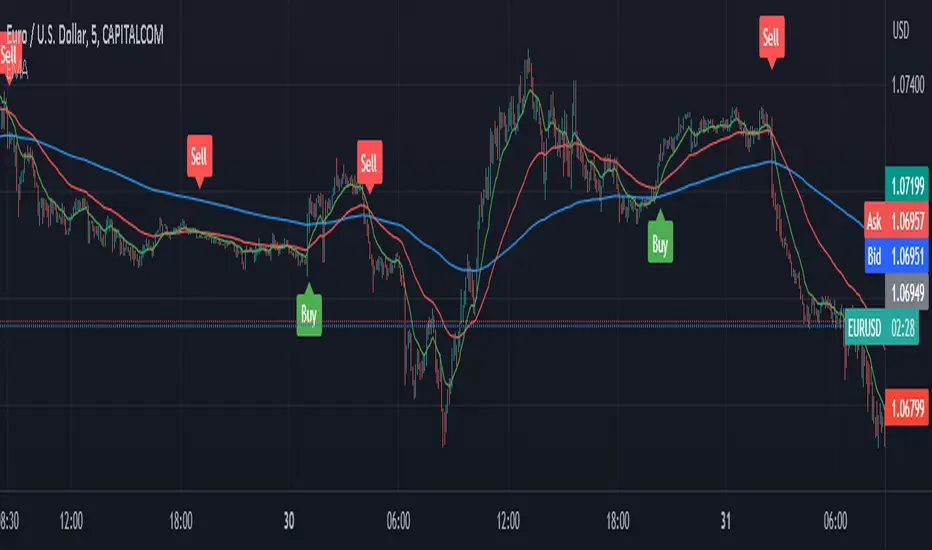
EMA with Buy/Sell Signals by lbkindCertainly! Here's a description of the code:
This Pine Script code is designed to plot Exponential Moving Averages (EMAs) on a chart and generate buy/sell signals based on specific conditions. The code includes a filter to reduce false signals by considering the trend of the EMA 200.
The key components of the code are as follows:
1. Input Variables: The code starts by defining input variables such as the periods for the EMAs (ema200Period, ema50Period, ema13Period), the Average True Range period (atrPeriod), and the chopiness threshold (chopinessThreshold).
2. Calculating EMAs: The EMAs (ema200, ema50, ema13) are calculated using the `ema()` function based on the closing price.
3. Average True Range (ATR): The ATR is calculated using the `atr()` function with the specified period (atrPeriod).
4. Normalized ATR: The normalized ATR is computed by dividing the ATR by the closing price and multiplying by 100. This allows for better comparison across different price levels.
5. EMA 200 Trend Direction: The code determines the trend direction of the EMA 200 by comparing the current value with the previous value. The variables `ema200TrendUp` and `ema200TrendDown` are assigned `true` or `false` values based on the trend direction.
6. Generate Buy/Sell Signals: The buySignal is generated when the following conditions are met:
- There is a crossover of the shorter EMAs (ema13, ema50).
- The EMA 200 is in an uptrend (`ema200TrendUp` is true).
- The current close is above the EMA 200.
- The normalized ATR is below the specified chopiness threshold.
The sellSignal is generated when the opposite conditions are met.
7. Plotting: The EMAs (ema200, ema50, ema13) are plotted on the chart using the `plot()` function. The buy and sell signals are plotted as labels using the `plotshape()` function. The buySignal is displayed below the candle (`location=location.belowbar`), and the sellSignal is displayed above the candle (`location=location.abovebar`).
By incorporating these features, the code provides a visual representation of the EMAs, along with buy and sell signals that consider the EMA 200 trend, crossover of shorter EMAs, and the normalized ATR condition. This helps in identifying potential entry and exit points in the market while attempting to reduce false signals.
Cycle Position TradingTitle: Cycle Position Trading Strategy v1.0
Description: Cycle Position Trading Strategy is a simple yet effective trading strategy based on a 200-day Simple Moving Average (SMA). Users can select between two modes, "Buy Uptrend" and "Buy Downtrend," to customize the strategy according to their trading preferences. The strategy allows users to set their own stop loss (SL) and take profit (TP) levels, providing more flexibility and control over their trades.
Features:
Choose between two trading modes: "Buy Uptrend" and "Buy Downtrend."
Customize your stop loss (SL) and take profit (TP) levels.
Clear visual representation of the 200-day Simple Moving Average (SMA) on the chart.
How to use:
Add the strategy to your chart by searching for "Cycle Position Trading Strategy" in the TradingView "Indicators & Strategies" section.
Configure the strategy settings according to your preferences:
Select the trading mode from the dropdown menu. "Buy Uptrend" will open long positions when the closing price is above the 200-day SMA. "Buy Downtrend" will open long positions when the closing price is below the 200-day SMA.
Set your desired stop loss (SL) and take profit (TP) levels. The default values are 0.9 (10% below the entry price) for the stop loss and 1.1 (10% above the entry price) for the take profit.
Monitor the chart for trade signals based on the chosen mode and settings. The strategy will enter and exit trades automatically based on the selected mode and the configured stop loss and take profit levels.
Analyze the performance of the strategy by checking the TradingView strategy performance summary or by viewing individual trades in the "Trades" list.
Disclaimer: This strategy is intended for educational and illustrative purposes only. Use it at your own risk. Past performance is not indicative of future results. Trading stocks, cryptocurrencies, or any other financial instrument involves significant risk and may result in the loss of capital.
Version: v1.0
Release date: 2023-03-25
Author: I11L
License: Mozilla Public License 2.0 (mozilla.org)

Investments/swing trading strategy for different assetsStop worrying about catching the lowest price, it's almost impossible!: with this trend-following strategy and protection from bearish phases, you will know how to enter the market properly to obtain benefits in the long term.
Backtesting context: 1899-11-01 to 2023-02-16 of SPX by Tvc. Commissions: 0.05% for each entry, 0.05% for each exit. Risk per trade: 2.5% of the total account
For this strategy, 5 indicators are used:
One Ema of 200 periods
Atr Stop loss indicator from Gatherio
Squeeze momentum indicator from LazyBear
Moving average convergence/divergence or Macd
Relative strength index or Rsi
Trade conditions:
There are three type of entries, one of them depends if we want to trade against a bearish trend or not.
---If we keep Against trend option deactivated, the rules for two type of entries are:---
First type of entry:
With the next rules, we will be able to entry in a pull back situation:
Squeeze momentum is under 0 line (red)
Close is above 200 Ema and close is higher than the past close
Histogram from macd is under 0 line and is higher than the past one
Once these rules are met, we enter into a buy position. Stop loss will be determined by atr stop loss (white point) and break even(blue point) by a risk/reward ratio of 1:1.
For closing this position: Squeeze momentum crosses over 0 and, until squeeze momentum crosses under 0, we close the position. Otherwise, we would have closed the position due to break even or stop loss.
Second type of entry:
With the next rules, we will not lose a possible bullish movement:
Close is above 200 Ema
Squeeze momentum crosses under 0 line
Once these rules are met, we enter into a buy position. Stop loss will be determined by atr stop loss (white point) and break even(blue point) by a risk/reward ratio of 1:1.
Like in the past type of entry, for closing this position: Squeeze momentum crosses over 0 and, until squeeze momentum crosses under 0, we close the position. Otherwise, we would have closed the position due to break even or stop loss.
---If we keep Against trend option activated, the rules are the same as the ones above, but with one more type of entry. This is more useful in weekly timeframes, but could also be used in daily time frame:---
Third type of entry:
Close is under 200 Ema
Squeeze momentum crosses under 0 line
Once these rules are met, we enter into a buy position. Stop loss will be determined by atr stop loss (white point) and break even(blue point) by a risk/reward ratio of 1:1.
Like in the past type of entries, for closing this position: Squeeze momentum crosses over 0 and, until squeeze momentum crosses under 0, we close the position. Otherwise, we would have closed the position due to break even or stop loss.
Risk management
For calculating the amount of the position you will use just a small percent of your initial capital for the strategy and you will use the atr stop loss for this.
Example: You have 1000 usd and you just want to risk 2,5% of your account, there is a buy signal at price of 4,000 usd. The stop loss price from atr stop loss is 3,900. You calculate the distance in percent between 4,000 and 3,900. In this case, that distance would be of 2.50%. Then, you calculate your position by this way: (initial or current capital * risk per trade of your account) / (stop loss distance).
Using these values on the formula: (1000*2,5%)/(2,5%) = 1000usd. It means, you have to use 1000 usd for risking 2.5% of your account.
We will use this risk management for applying compound interest.
In settings, with position amount calculator, you can enter the amount in usd of your account and the amount in percentage for risking per trade of the account. You will see this value in green color in the upper left corner that shows the amount in usd to use for risking the specific percentage of your account.
Script functions
Inside of settings, you will find some utilities for display atr stop loss, break evens, positions, signals, indicators, etc.
You will find the settings for risk management at the end of the script if you want to change something. But rebember, do not change values from indicators, the idea is to not over optimize the strategy.
If you want to change the initial capital for backtest the strategy, go to properties, and also enter the commisions of your exchange and slippage for more realistic results.
If you activate break even using rsi, when rsi crosses under overbought zone break even will be activated. This can work in some assets.
---Important: In risk managment you can find an option called "Use leverage ?", activate this if you want to backtest using leverage, which means that in case of not having enough money for risking the % determined by you of your account using your initial capital, you will use leverage for using the enough amount for risking that % of your acount in a buy position. Otherwise, the amount will be limited by your initial/current capital---
Some things to consider
USE UNDER YOUR OWN RISK. PAST RESULTS DO NOT REPRESENT THE FUTURE.
DEPENDING OF % ACCOUNT RISK PER TRADE, YOU COULD REQUIRE LEVERAGE FOR OPEN SOME POSITIONS, SO PLEASE, BE CAREFULL AND USE CORRECTLY THE RISK MANAGEMENT
Do not forget to change commissions and other parameters related with back testing results!
Some assets and timeframes where the strategy has also worked:
BTCUSD : 4H, 1D, W
SPX (US500) : 4H, 1D, W
GOLD : 1D, W
SILVER : 1D, W
ETHUSD : 4H, 1D
DXY : 1D
AAPL : 4H, 1D, W
AMZN : 4H, 1D, W
META : 4H, 1D, W
(and others stocks)
BANKNIFTY : 4H, 1D, W
DAX : 1D, W
RUT : 1D, W
HSI : 1D, W
NI225 : 1D, W
USDCOP : 1D, W

Market Breadth: Trends & BreakoutsVisualize the percentage of stocks in an index participating in trends and breakouts/breakdowns.
The default data source is the S & P 500: the percent of stocks above/below the 200 and 50 day moving averages, and the percentage of stocks making new 52 week breakouts/breakdowns. You can pick new data sources in the settings.
The blue band represents the percentage of stocks above/below the 200 day moving average. (It's always 100% in width, unlike say Bollinger bands). The thin blue lines are the same but for the 50 day moving average. The red and green areas represent the percentage of stocks making new 52 week highs/lows.
In the example chart you can see a divergence between the market as a whole which continues up and to the right throughout 2021, where as fewer and fewer stocks were above their own 200 day moving average, causing the blue band to trend down. Before the market turns beginning 2022 you can see more stocks making new 52 week lows, even as other stocks make 52 week highs. After the market tops, the percentage of 52 week lows intensifies and the percentage of stocks below their 200 day moving average is already over 50%.

EMA + Supertrend with BUY a SELL signals by @zeusbottradingwe are presenting you new indicator with opensource script,
this indicator uses 3x EMAs and 2 supertrends. Supertrends generate SELL or BUY labels when they are both red or green, meaning uptrend or downtrend. Main idea behind this indicator is filtering supertrend labels by 3 EMAs (filter>All EMAs Aligned) or just 1 EMA 200 Only. EMA (Esxponential Moving Average) measures trend direction over a period of time . EMA should follow price section more closely than others moving averages. In the script is defaulty set EMA1 to calculet on 21 previouse candles which is good for calculating fast moving trends. EMA2 is defaulty set on 50 previouse candles which is use for medium moving trends. End lastly EMA3 is defaulty set on 200 candles to calculate long period moving trend.
You can setup sources of all EMAs and Supertrend values including ATR period and multiplier.
We also included Bearish and Bullish Engulfing candles for more precise entries. Bearish and Bullish Engulfing candels are marked by little triangle. Bearish candles means red candles, Bullish candles means green candles. Engulfing candles should be bigger than previouse candle. Engulfing candles used to indicate a market reversal
Buy signal is shown when close is between ATRs and close price of the candle is bigger than EMA3 when its used in Filter section 200 EMA Only . If in Filter section is choosed ALL EMAs Aligned Buy signal is shown when close is between ATRs and close price of the candle is bigger than EMA1 , EMA1 is bigger than EMA2 and EMA2 is bigger than EMA3 .
Sell signal is shown when close is between ATRs and close price of the candle is lower than EMA3 when its used in Filter section 200 EMA Only . If in Filter section is choosedALL EMAs Aligned Sell signal is shown when close is between ATRs and close price of the candle is lower than EMA1, EMA1 is lower than EMA2 and EMA2 is lower than EMA3 .
ATR (Average True Range) it is trading system that measures market volatility by decomposing the entire range of an asset price for choosen period.
You can use this indicator on any timeframe and any instrument.
Made with ❤️ for this community.
If you have any questions or suggestions, let us know.
The script is for informational and educational purposes only. Use of the script does not constitutes professional and/or financial advice. You alone the sole responsibility of evaluating the script output and risks associated with the use of the script. In exchange for using the script, you agree not to hold zeusbottrading TradingView user liable for any possible claim for damages arising from any decision you make based on use of the script.

Stochastic Buy Sell with EMA TrendStochastic Buy Sell with EMA Trend is combination of two indicators only.
The Stochastic Oscillator ( STOCH ) is a range bound momentum oscillator. The Stochastic indicator is designed to display the location of the close compared to the high/low range over a user defined number of periods. Typically, the Stochastic Oscillator is used for three things; Identifying overbought and oversold levels, spotting divergences and also identifying bull and bear set ups or signals.
The Exponential Moving Average (EMA) is a specific type of moving average that points towards the importance of the most recent data and information from the market.
1) Stochastic - It is giving signal whenever cross happen in oversold or overbought zone.
2) EMA 200 - EMA 200 is used to identify market trend.
Long :
If stochastic giving buy signal and price is over 200 EMA.
Short :
If stochastic giving sell signal and price is below 200 EMA.