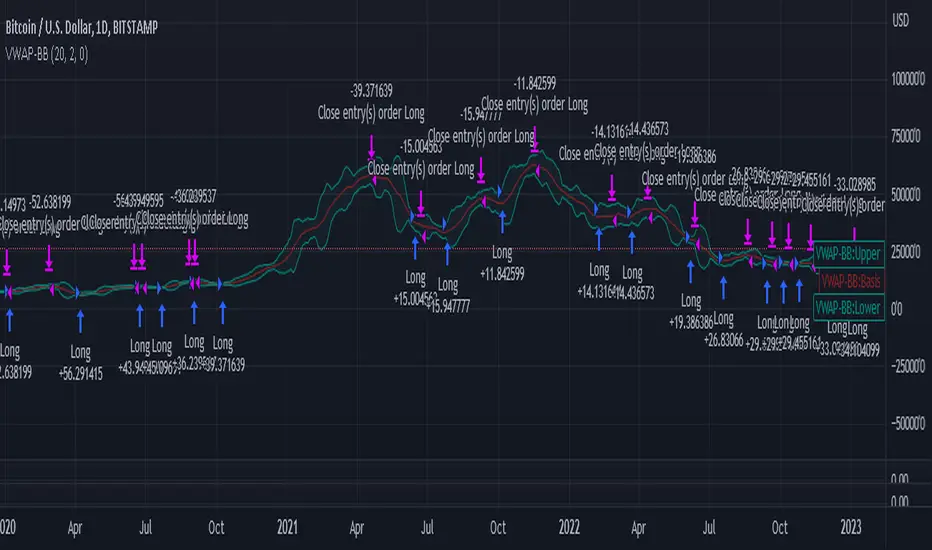
VWAP-Bollinger BandsThis script uses Bollinger bands but with a VWAP as the source, it uses the high crossing the upper band as a buy signal and a low crossing the lower band as a sell signal
Its default settings are for a day chart - Crypto 30 periods, forex 24 periods and stocks 20 periods, which basically line up with a month per asset class
ive seen good results in crypto and stocks, settings used between1% and 10% equity per trade with a 0.1% fee which lines up with Binance fee structure and $25 per trade which lines up with Commsec on the ASX
In den Scripts nach "弘历投教boll指标代码分析" suchen
6 Bollinger Bands (1.5 thru 4)20 period SMA Bollinger Bands with the following standard deviations: 1.5 2 2.5 3 3.5 4

CBMA Bollinger Bands Strategy directed [ChuckBanger]I just did a Bollinger Bands script with my newly CB moving average
While I'm generally against posting strategies because it's very easy to fake performance numbers... This is just to share a cool strategy snippet. My settings are 10 contracts/order with pyramiding set to 10. You can make the profitability a lot higher if you set the order size higher. But that dosent help you getting more out of this script when u make a bot of this script. I set the order size to 10 contracts to get your attention not to showcase the performance.
When the price is going down and outside of the lower side of the band. And when the price comes back into the channel the strategy buys. Usually that means the price is going up. And when the price is going up and outside of the upper band. The strategy sells when it crosses back in to the channel.
It is a very simple strategy but it is effective. I guess you need a proper stop-loss for this script to bee really profitable in a bot environment.

EMA Bollinger BandsThis is a simple Bollinger Bands indicator that uses the exponential moving average instead of the simple moving average.

MG - Bollinger band alerts- Displays the Bollinger Bands for standard deviation coefficients 2 & 3 (can toggle both independently)
- Has four preset alerts
- Price reached upper band (SD = 3)
- Price reached upper band (SD = 2)
- Price reached lower band (SD = 2)
- Price reached lower band (SD = 3)

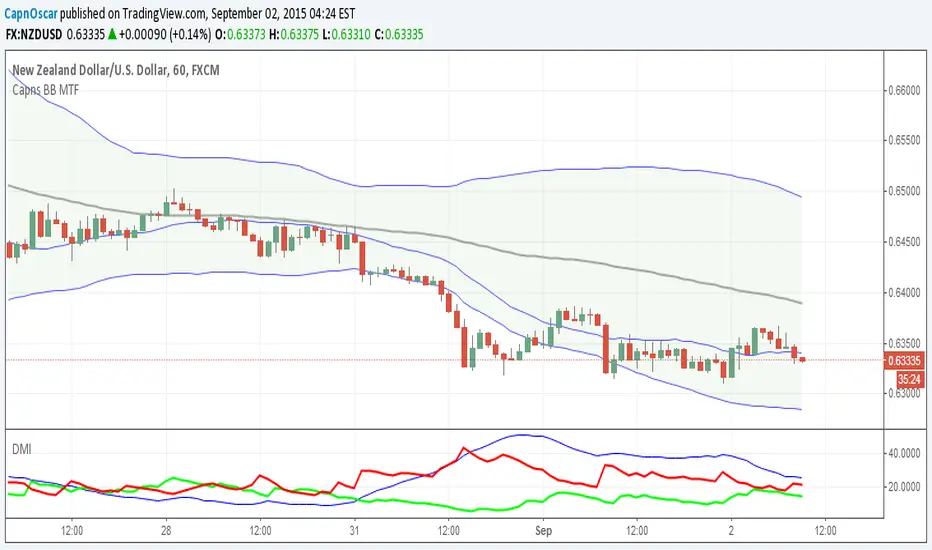
Capns Bollinger Bands MTF This Simple Script display higher time frame Bollinger Band on current resolution . Etc : On 1 Minutes chart BB Band is 5 Minutes Band. I use this code on my pc for scalping...Hope You like the idea
Generalized Bollinger Bands %B And Bandwidth (Tartigradia)Bollinger Band is simply a representation of the rolling average of price and its standard deviation around the average (called the "basis").
This indicator generalizes the Bollinger Band by implementing many different equations to calculate the Bollinger Bands beyond the standard deviation and sma, and then plot the %B (where the current price falls inside the Bollinger Band), Bandwidth (size of the Bollinger Band) as well as the Bollinger Band itself and a reproduction of the OHLC price candles in a separate pane.
Whereas other Bollinger Bands indicators often just change the basis but not the stdev calculation, the correct way to change the basis is to also change it inside the stdev calculation.
Advanced features such as temporal discounting (ie, newer bars can have more weights), median absolute deviation and multiple sigma bands (eg, 3-sigma) are available.
Up to 3 different Bollinger Bands can be displayed, and the background can be highlighted when price is overbought/oversold (beyond the Bollinger Band of choice). Tip: BB3, which is the bollinger band with standard deviation of 3, which represents 99% of observed values in the lookback period, is a good choice to highlight overbought/oversold conditions.
Three "Sentiment Bars" are provided to see at a glance the sentiments on the price action relative to the Bollinger Bands as reflected by the %B value.
Usage:
Use the %B as a measure of sentiment: bullish if > 0.5, bearish if < 0.5. You can use the Sentiment Bars at the bottom for a quick reference: aqua if bullish, red if bearish, gray if undefined (too close to the middle line).
Use the bandwidth as a measure of volatility: higher is more volatile, lower is less.
When overbought, it can be a good time to sell/short. Use a higher Bollinger Band Multiplier such as 3 or more to reduce false positives.
When oversold, it can be a good time to buy/long. Use a higher Bollinger Band Multiplier such as 3 or more to reduce false positives.
Consider setting a much tighter lookback period of 4 as recommended in backtested works (en.wikipedia.org), use zlma instead of sma, and finally set a higher timeframe for the Bollinger Bands than the one you are currently studying. Then, the Bollinger Bands can help in detecting overbought and oversold regions (price going "out of bands").
Note that I tried to automate the setting of a higher timeframe, but for some reason the output is different when I manually do it using request.security() than when it's in indicator(timeframe=""). If someone has any suggestion as to why it happens, please let me know! (You can try it for yourself by uncommenting the auto_timeframe parameter line).

Bollinger Bands ETSOverview
Bollinger Bands ETstyle (BB ETS) is an advanced volatility and breakout detection indicator, building upon the classic Bollinger Bands. This script introduces adaptive ATR-based band width smoothing and clear squeeze detection, making it a versatile tool for traders seeking more responsive and actionable volatility analysis.
Features
Dual Bollinger Bands: Plots both standard and outer bands around a configurable moving average, allowing visualization of typical and extreme volatility ranges.
ATR-Based Band Smoothing (Optional): When enabled, the bands automatically widen during low-volatility periods using the Average True Range (ATR), reducing false signals and making the bands more adaptive.
Squeeze Detection (Optional): Highlights periods when the bands contract below a user-defined threshold, signaling potential breakout setups. Squeeze periods are visually marked with a background highlight for easy identification.
Customizable Settings: Users can adjust band length, standard deviation multipliers, ATR parameters, and squeeze thresholds. Both ATR smoothing and squeeze detection can be toggled on or off.
Clean Chart Output: The indicator overlays directly on price with clear, distinguishable visuals for all features.
How It Works
The indicator calculates a moving average (basis) and plots upper and lower bands at user-selected standard deviations.
If ATR smoothing is enabled, the band width expands by a multiple of the ATR, adapting to real-time volatility.
The script computes the relative band width ("bandwidth"). When this falls below your chosen threshold, the background is highlighted to indicate a "squeeze"-a period of reduced volatility that often precedes breakouts.
How to Use
Trend & Volatility Analysis: Use the bands to identify overbought/oversold conditions and current market volatility. Price touching or crossing the outer bands may signal trend exhaustion or continuation.
Breakout Anticipation: Watch for background highlights indicating a squeeze. These periods suggest the market is coiling for a potential significant move.
Adaptive Sensitivity: Enable ATR smoothing to keep bands relevant during both calm and volatile markets, reducing false signals in low-volatility conditions.
Customization: Adjust all parameters in the settings to match your trading style and the asset’s behavior.
Limitations
The indicator is designed for standard price charts and may not perform as intended on non-standard chart types (such as Renko or Heikin Ashi).
As with all technical tools, best results are achieved when used alongside other forms of analysis.
Summary
Bollinger Bands ETstyle (BB ETS) offers a modern, adaptive approach to volatility and breakout analysis by combining classic bands with ATR-based smoothing and clear squeeze visualization. It is suitable for trend-following and breakout strategies, and requires no additional scripts-simply apply to your chart and adjust the settings as needed.

Trendlines Boll Ichi S1 by GammaprodI. How to use this indicator :
------------------------------
I.1. Set your teadingview theme to dark theme.
I.2. Gammaprod indicator is valid for forex, stock and but more valid for crypto.
I.3. Use three timeframe for more validation (choose between those, that fit to your trading style) :
- Timeframe 1m, 5m, and 15m for Scalping
- Timeframe 30m, 1h and 4h for Intraday
- Timeframe 4h, 1D and 1W for Swing Trading
I.4 Always use THREE INDICATORS FROM GAMMAPROD, those three indicators is back to back each other, by the way, I only made those three indicators only (for now) :
- Trendlines Boll Ichi S1 by Gammaprod
- MACD Volume S2 by Gammaprod
- Stoch RSI Divs Zone S2 by Gammaprod
============================================================================
II. How to setting :
--------------------
II.1. Trendlines Boll Ichi Crypto by Gammaprod
II.1.A. Support and Resistance
- Well if you familiar with this indicator you can add it, but recommended for Timeframe 30m or more
II.1.B. Trendlines Primary or Trendlines Secondary
- Timeframe 1m you DON'T NEED Trendlines Primary or Trendlines Secondary
- Timeframe 5m you DON'T NEED Trendlines Secondary, but you CAN ADD Trendlines Primary if you fell it helpful (for me, it is helpful to find where the candles start or the end trend or a consolidation or where the candles will surpass a resistance or a support).
- Timeframe 15m you DON'T NEED Trendlines Secondary, DEFENITELY add Trendlines Primary it will help to find where the candles stop or a consolidation or where the candles will surpass a resistance or a support).
- Timeframe 30m or more, DEFENITELY NEED BOTH Trendlines Primary and Secondary Trendlines, it will help to find where the candle stop or consolidation or where the candle will surpass a resistance or support).
II.1.C. Bollinger, Ichimoku Cloud and Lagging Span
- Please DON'T CHANGE IT at all, it's really helpful to know when and where to make an entry decesion or a trend or a consolidation, if you don't understand how to read it, you better to learn it first (on "how to read" section and "How to OPEN position" the section below)
II.2. Stoch RSI Divs Zone Crypto by Gammaprod (DON'T CHANGE IT)
II.3. MACD Volume Crypto by Gammaprod (DON'T CHANGE IT)
============================================================================
III. How to read :
------------------
III.1. Sell or Buy Priority :
III.1.A. Sell Priority
- Color background on macd and stoch rsi is pink or purple sell is the priority, (if you're not sure to buy, just wait until the best moment to sell)
III.1.B. Buy Priority
- Color background on macd and stoch rsi Teal or light green buy is the priority, (if you're not sure to sell, just wait until the best moment to buy)
III.1.C. Indecision / Golden Moment
- Color background on stoch rsi yellow is indecision / golden moment of reversal pattern (wait until it formed background only on Stoch RSI), please be careful at this moment.
III.2. Trend / Consolidation :
III.2.A. BULLISH trend
- When Stoch RSI and MACD have teal or light green background that's means BULLISH trend, better to confirm by the candle is above green cloud and lagging span (red line) is also above the candle.
III.2.B. BEARISH trend
- When Stoch RSI and MACD have the Pink or purple background that's means BEARISH trend, better to confirm by the candle is above purple cloud and lagging span (red line) is also below the candle.
III.2.C. CONSOLIDATION
- When Stoch RSI have the mix background that's means CONSOLIDATION, better to confirm by the candle is in or near to green / purple cloud and lagging span (red line) is also on the candle.
III.3. Special Mark
III.3.A. Ideal Bullish :
- Near line 20 and green / teal background = When Stoch RSI have the char R / H on lime color label, that's means divergence or hidden divergence for buy position, if you not see this label that's means just a standard confirmation for buy
III.3.B. Not an Ideal Bullish :
- Near line 80 and green / teal background = if this happens make sure you know what happen, it could be a false signal or bullish continual pattern
III.3.C. Ideal Bearish :
- Near line 80 and pink / purple background = When Stoch RSI have the char R / H on lime color label, that's means divergence or hidden divergence for buy position, if you not see this label that's means just a standard confirmation for sell position.
III.3.D. Not an Ideal Bearish:
- Near line 20 and pink / purple background = if this happens make sure you know what happen, it could be a false signal or bearish continual pattern
III.3.E. The Beginning of Reversal (from BEARISH to BULLISH) :
- When Stoch RSI line shaping GREEN position is near 20.
- MACD lines still PINK, position lines is UNDER the HISTOGRAM, but the HISTOGRAM start to SHAPE FALL PINK (light pink) and the BACKGROUND still PINK / PURPLE.
- Position CANDLES NEAR BLUE line, NEAR PURPLE CLOUD, and lagging span (red line) STILL ON the area candle. (it used to be confirmed with the golden moment).
III.3.F. The Beginning of Reversal (from BULLISH to BEARISH) :
- When Stoch RSI line shaping PINK position is near 80.
- MACD lines still GREEN, position lines is ABOVE the HISTOGRAM, but the HISTOGRAM start to SHAPE FALL GREEN (light green) and the BACKGROUND still TEAL / GREEN.
- Position CANDLES NEAR WHITE line, NEAR TEAL CLOUD, and lagging span (red line) STILL ON the area candle. (it used to be confirmed with the golden moment).
III.3.G. False Signals, or It could be a Golden Moment (better to see it on TF 15 or bigger):
- Near line 20 or 80 and yellow background = When Stoch RSI have the char R / H on color label, that's means divergence or hidden divergence for buy / sell position, if you not see this label that's means just a standard confirmation for buy / sell depends on where the Stoch RSI line if near 20 that's means buy, near 80 means sell
============================================================================
IV. How to OPEN position:
-------------------------
IV.1. Bullish
IV.1.A. Trendlines Boll Ichi S1 by Gammaprod
- The candles above the green cloud.
- Lagging span (red line) above the candles.
- then open buy near yellow line (the first option) / blue line (the second option) (always confirm the position with two other indicators below).
IV.1.B. MACD Volume S2 by Gammaprod
- Teal or Green background.
- The lines is shaped or shaping green.
- Better if at the green histogram.
IV.1.C. Stoch RSI Divs Zone S3 by Gammaprod
- Teal or Green background.
- The lines is shaping green.
- Better if on the bottom (at a range 20).
IV.2. Bearish
IV.2.A. Trendlines Boll Ichi S1 by Gammaprod
- The candles below the purple cloud.
- Lagging span (red line) below the candles.
- then open buy near yellow line (the first option) / white line (the second option) (always confirm the position with two other indicators below).
IV.2.B. MACD Volume S2 by Gammaprod
- Pink or purple background.
- The lines are shaped or shaping green.
- Better if at the pink histogram.
IV.2.C. Stoch RSI Divs Zone S3 by Gammaprod
- Pink or purple background.
- The lines are shaping pink.
- Better if the line on the top (at a range 80).
IV.3. Consolidation
IV.3.A. Trendlines Boll Ichi S1 by Gammaprod
- The candles on the cloud (green or purple).
- Lagging span (red line) on the candles.
- then open buy near the white or blue line (always confirm the position with two other indicators below).
IV.3.B. MACD Volume S2 by Gammaprod
- Changing the background.
- The line is near the middle line.
- Have small Histogram.
IV.3.C. Stoch RSI Divs Zone S3 by Gammaprod
- Mix background specially on a timeframe 15m or more.
- The line move fast up and down.
- Better if on the bottom or the top of the lines (at a range 20 or 80).
============================================================================
>> The secret ingredient is comparing the timeframe :
The example scalping (Timeframe 1m, 5m and 15m)
- TF 1m is for making an open position.
- TF 5m is for making a judgement of the trend market.
- TF 15m is to confirm that judgement from TF 5m, be careful if it not similar then it used to be a consolidation or the beginning of the reversal.
There's a lot a way to open the position than above information that i gave it to you, but consider there are a limit chars on this column, I hope it will help your trading and make a more profit on it.

Bollinger Pair TradeNYSE:MA-1.6*NYSE:V
Revision: 1
Author: @ozdemirtrading
Revision 2 Considerations :
- Simplify and clean up plotting
Disclaimer: This strategy is currently working on the 5M chart. Change the length input to accommodate your needs.
For the backtesting of more than 3 months, you may need to upgrade your membership.
Description:
The general idea of the strategy is very straightforward: it takes positions according to the lower and upper Bollinger bands.
But I am mainly using this strategy for pair trading stocks. Do not forget that you will get better results if you trade with cointegrated pairs.
Bollinger band: Moving average & standard deviation are calculated based on 20 bars on the 1H chart (approx 240 bars on a 5m chart). X-day moving averages (20 days as default) are also used in the background in some of the exit strategy choices.
You can define position entry levels as the multipliers of standard deviation (for exp: mult2 as 2 * standard deviation).
There are 4 choices for the exit strategy:
SMA: Exit when touches simple moving average (SMA)
SKP: Skip SMA and do not stop if moving towards 20D SMA, and exit if it touches the other side of the band
SKPXDSMA: Skip SMA if moving towards 20D SMA, and exit if it touches 20D SMA
NoExit: Exit if it touches the upper & lower band only.
Options:
- Strategy hard stop: if trade loss reaches a point defined as a percent of the initial capital. Stop taking new positions. (not recommended for pair trade)
- Loss per trade: close position if the loss is at a defined level but keeps watching for new positions.
- Enable expected profit for trade (expected profit is calculated as the distance to SMA) (recommended for pair trade)
- Enable VIX threshold for the following options: (recommended for volatile periods)
- Stop trading if VIX for the previous day closes above the threshold
- Reverse active trade direction if VIX for the previous day is above the threshold
- Take reverse positions (assuming the Bollinger band is going to expand) for all trades
Backtesting:
Close positions after a defined interval: mark this if you want the close the final trade for backtesting purposes. Unmark it to get live signals.
Use custom interval: Backtest specific time periods.
Other Options:
- Use EMA: use an exponential moving average for the calculations instead of simple moving average
- Not against XDSMA: do not take a position against 20D SMA (if X is selected as 20) (recommended for pairs with a clear trend)
- Not in XDSMA 1 DEV: do not take a position in 20D SMA 1*standart deviation band (recommended if you need to decrease # of trades and increase profit for trade)
- Not in XDSMA 2 DEV: do not take a position in 20D SMA 2*standart deviation band
Session management:
- Not in session: Session start and end times can be defined here. If you do not want to trade in certain time intervals, mark that session.(helps to reduce slippage and get more realistic backtest results)

Bollinger Bands Enhanced StrategyOverview
The common practice of using Bollinger bands is to use it for building mean reversion or squeeze momentum strategies. In the current script Bollinger Bands Enhanced Strategy we are trying to combine the strengths of both strategies types. It utilizes Bollinger Bands indicator to buy the local dip and activates trailing profit system after reaching the user given number of Average True Ranges (ATR). Also it uses 200 period EMA to filter trades only in the direction of a trend. Strategy can execute only long trades.
Unique Features
Trailing Profit System: Strategy uses user given number of ATR to activate trailing take profit. If price has already reached the trailing profit activation level, scrip will close long trade if price closes below Bollinger Bands middle line.
Configurable Trading Periods: Users can tailor the strategy to specific market windows, adapting to different market conditions.
Major Trend Filter: Strategy utilizes 100 period EMA to take trades only in the direction of a trend.
Flexible Risk Management: Users can choose number of ATR as a stop loss (by default = 1.75) for trades. This is flexible approach because ATR is recalculated on every candle, therefore stop-loss readjusted to the current volatility.
Methodology
First of all, script checks if currently price is above the 200-period exponential moving average EMA. EMA is used to establish the current trend. Script will take long trades on if this filtering system showing us the uptrend. Then the strategy executes the long trade if candle’s low below the lower Bollinger band. To calculate the middle Bollinger line, we use the standard 20-period simple moving average (SMA), lower band is calculated by the substruction from middle line the standard deviation multiplied by user given value (by default = 2).
When long trade executed, script places stop-loss at the price level below the entry price by user defined number of ATR (by default = 1.75). This stop-loss level recalculates at every candle while trade is open according to the current candle ATR value. Also strategy set the trailing profit activation level at the price above the position average price by user given number of ATR (by default = 2.25). It is also recalculated every candle according to ATR value. When price hit this level script plotted the triangle with the label “Strong Uptrend” and start trail the price at the middle Bollinger line. It also started to be plotted as a green line.
When price close below this trailing level script closes the long trade and search for the next trade opportunity.
Risk Management
The strategy employs a combined and flexible approach to risk management:
It allows positions to ride the trend as long as the price continues to move favorably, aiming to capture significant price movements. It features a user-defined ATR stop loss parameter to mitigate risks based on individual risk tolerance. By default, this stop-loss is set to a 1.75*ATR drop from the entry point, but it can be adjusted according to the trader's preferences.
There is no fixed take profit, but strategy allows user to define user the ATR trailing profit activation parameter. By default, this stop-loss is set to a 2.25*ATR growth from the entry point, but it can be adjusted according to the trader's preferences.
Justification of Methodology
This strategy leverages Bollinger bangs indicator to open long trades in the local dips. If price reached the lower band there is a high probability of bounce. Here is an issue: during the strong downtrend price can constantly goes down without any significant correction. That’s why we decided to use 200-period EMA as a trend filter to increase the probability of opening long trades during major uptrend only.
Usually, Bollinger Bands indicator is using for mean reversion or breakout strategies. Both of them have the disadvantages. The mean reversion buys the dip, but closes on the return to some mean value. Therefore, it usually misses the major trend moves. The breakout strategies usually have the issue with too high buy price because to have the breakout confirmation price shall break some price level. Therefore, in such strategies traders need to set the large stop-loss, which decreases potential reward to risk ratio.
In this strategy we are trying to combine the best features of both types of strategies. Script utilizes ate ATR to setup the stop-loss and trailing profit activation levels. ATR takes into account the current volatility. Therefore, when we setup stop-loss with the user-given number of ATR we increase the probability to decrease the number of false stop outs. The trailing profit concept is trying to add the beat feature from breakout strategies and increase probability to stay in trade while uptrend is developing. When price hit the trailing profit activation level, script started to trail the price with middle line if Bollinger bands indicator. Only when candle closes below the middle line script closes the long trade.
Backtest Results
Operating window: Date range of backtests is 2020.10.01 - 2024.07.01. It is chosen to let the strategy to close all opened positions.
Commission and Slippage: Includes a standard Binance commission of 0.1% and accounts for possible slippage over 5 ticks.
Initial capital: 10000 USDT
Percent of capital used in every trade: 30%
Maximum Single Position Loss: -9.78%
Maximum Single Profit: +25.62%
Net Profit: +6778.11 USDT (+67.78%)
Total Trades: 111 (48.65% win rate)
Profit Factor: 2.065
Maximum Accumulated Loss: 853.56 USDT (-6.60%)
Average Profit per Trade: 61.06 USDT (+1.62%)
Average Trade Duration: 76 hours
These results are obtained with realistic parameters representing trading conditions observed at major exchanges such as Binance and with realistic trading portfolio usage parameters.
How to Use
Add the script to favorites for easy access.
Apply to the desired timeframe and chart (optimal performance observed on 4h BTC/USDT).
Configure settings using the dropdown choice list in the built-in menu.
Set up alerts to automate strategy positions through web hook with the text: {{strategy.order.alert_message}}
Disclaimer:
Educational and informational tool reflecting Skyrex commitment to informed trading. Past performance does not guarantee future results. Test strategies in a simulated environment before live implementation

Bollinger Bands Breakout Oscillator [LuxAlgo]The Bollinger Bands Breakout Oscillator is an oscillator returning two series quantifying the significance of breakouts between the price and the extremities of the Bollinger Bands indicator.
Settings
Length: Period of the Bollinger Bands indicator
Mult: Controls the width of the Bollinger Bands
Src: Input source of the indicator
Usage
Each series is calculated by summing the distance between price and a respective Bollinger Bands extremity in the case price is outside this extremity and divided by the sum of the absolute distance between price and a respective extremity. This sum is done over the most recent Length bars.
Bullish breakouts are represented by the green areas of the indicator, while bearish breakouts are represented by the red areas of the indicator.
The oscillator can determine the presence of an uptrend when the bullish area is superior to the bearish area, while a downtrend is indicated by a bearish area being superior to the bullish one. The significance of the breakout is determined by the amplitude of each area, with higher amplitudes indicating more significant breakouts or strong trends.
Using higher Mult values would naturally return wider bands, which would induce less frequent breakouts, this would be highlighted by the oscillator.
In the chart above we can see the oscillator using a multiplicative factor of 2.

Bollinger Bands Forecast with Signals (Zeiierman)█ Overview
Bollinger Bands Forecast with Signals (Zeiierman) extends classic Bollinger Bands into a forward-looking framework. Instead of only showing where volatility has been, it projects where the basis (midline) and band width are likely to drift next, based on recent trend and volatility behavior.
The projection is built from the measured slopes of the Bollinger basis, the standard deviation (or ATR, depending on the mode), and a volatility “breathing” component. On top of that, the script includes an optional projected price path that can be blended with a deterministic random walk, plus rejection signals to highlight failed band breaks.
█ How It Works
⚪ Bollinger Core
The script first computes standard Bollinger Bands using the selected Source, Length, and Multiplier:
Basis = SMA(Source, Length)
Band width = Multiplier × StDev(Source, Length)
Upper/Lower = Basis ± Width
This remains the “live” (non-forecast) structure on the chart.
⚪ Trend & Volatility Slope Estimation
To project forward, the indicator measures directional drift and volatility drift using linear regression differences:
Basis slope from the Bollinger basis
StDev slope from the Bollinger deviation
ATR slope for ATR-based projection mode
These slopes drive the forecast bands forward, reflecting the market’s recent directional and volatility regime.
⚪ Projection Engine (Forecast Bands)
At the last bar, the indicator draws projected basis, upper, and lower lines out to Forecast Bars. The projected basis can be:
Trend (straight linear projection)
Curved (ease-in/out transition toward projected endpoints)
Smoothed (extra smoothing on projected basis/width)
⚪ Price Path Projection + Optional Random Walk
In addition to projecting the bands, the script can draw a price forecast path made of a small number of zigzag swings.
Each swing targets a point offset from the projected basis by a multiple of the projected half-width (“width units”).
Decay gradually reduces swing size as the forecast deepens.
The Optional Random Walk Blend adds a deterministic drift component to the zigzag path. It’s not true randomness; it’s a stable pseudo-random sequence, so the drawing doesn’t jump around on refresh, while still adding “natural” variation.
⚪ Rejection Signals
Signals are based on failed attempts to break a band:
Bear Signal (Down): price tries to push above the upper band, then falls back inside, while still closing above the basis.
Bull Signal (Up): price tries to push below the lower band, then returns back inside, while still closing below the basis.
█ How to Use
⚪ Forward Support/Resistance Corridors
Treat the projected upper/lower bands as a future volatility envelope, not a guarantee:
The upper projection ≈ is likely a resistance level if the regime persists
The lower projection ≈ is likely a support level if the regime persists
Best used for trade planning, targets, and “where price could travel” under similar conditions.
⚪ Regime Read: Trend + Volatility
The projection shape is informative:
Rising basis + expanding width → trend with increasing volatility (needs wider stops / more caution)
Flat basis + compressing width → contraction regime (often precedes expansion)
⚪ Signals for Mean-Reversion / Failed Breakouts
The rejection markers are useful for fade-style setups:
A Down signal near/after upper-band failure can imply rotation back toward the basis.
An Up signal near/after lower-band failure can imply snap-back toward the basis.
With MA filtering enabled, signals are constrained to align with the broader bias, helping reduce chop-driven noise.
█ Related Publications
Donchian Predictive Channel (Zeiierman)
█ Settings
⚪ Bollinger Band
Controls the live Bollinger Bands on the chart.
Source – Price used for calculations.
Length – Lookback period; higher = smoother, lower = more reactive.
Multiplier – Bandwidth; higher = wider bands, lower = tighter bands.
⚪ Forecast
Controls the forward projection of the Bollinger Bands.
Forecast Bars – How far into the future the bands are projected.
Trend Length – Lookback used to estimate trend and volatility slopes.
Forecast Band Mode – Defines projection behavior (linear, curved, breathing, ATR-based, or smoothed).
⚪ Price Forecast
Controls the projected price path inside the bands.
ZigZag Swings – Number of projected oscillations.
Amplitude – Distance from basis, measured in bandwidth units.
Decay – Shrinks swings further into the forecast.
⚪ Random-Walk
Adds controlled randomness to the price path.
Enable – Toggle random-walk influence.
Blend – Strength of randomness vs. zigzag.
Step Size – Size of random steps (band-width units).
Decay – Reduces randomness as the forecast deepens.
Seed – Changes the (stable) random sequence.
⚪ Signals
Controls rejection/mean-reversion signals.
Show Signals – Enable/disable signal markers.
MA Filter (Type/Length) – Filters signals by trend direction.
-----------------
Disclaimer
The content provided in my scripts, indicators, ideas, algorithms, and systems is for educational and informational purposes only. It does not constitute financial advice, investment recommendations, or a solicitation to buy or sell any financial instruments. I will not accept liability for any loss or damage, including without limitation any loss of profit, which may arise directly or indirectly from the use of or reliance on such information.
All investments involve risk, and the past performance of a security, industry, sector, market, financial product, trading strategy, backtest, or individual's trading does not guarantee future results or returns. Investors are fully responsible for any investment decisions they make. Such decisions should be based solely on an evaluation of their financial circumstances, investment objectives, risk tolerance, and liquidity needs.

Bollinger Bands Regression Forecast [BigBeluga]🔵 OVERVIEW
The Bollinger Bands Regression Forecast combines volatility envelopes from Bollinger Bands with a linear regression-based projection model .
It visualizes both current and future price zones by extrapolating the Bollinger channel forward in time, giving traders a statistical forecast of probable support and resistance behavior.
🔵 CONCEPTS
Classic Bollinger Bands use a moving average (basis) and standard deviation (deviation) to form dynamic envelopes around price.
This indicator enhances them with linear regression slope detection , allowing it to forecast how the band may expand or contract in the future.
Regression is applied to both the band’s basis and deviation components to predict their trajectory for a user-defined number of Forecast Bars .
The resulting forecast creates a smoothed, funnel-shaped projection that dynamically adapts to volatility.
▲ and ▼ markers highlight potential mean reversion points when price crosses the outer bounds of the bands.
🔵 FEATURES
Forecast Engine : Uses linear regression to project Bollinger Band movement into the future.
Dynamic Channel Width : Adapts standard deviation and slope for realistic volatility modeling.
Auto-Labeled Levels : Displays live upper and lower forecast values for quick reference.
Cross Signals : Marks potential overbought and oversold zones with ▲/▼ signals when price exits the band.
Trend-Adaptive Basis Color : Basis line automatically switches color to represent short-term trend direction.
Customizable Colors and Widths for complete visual control.
🔵 HOW TO USE
Apply the indicator to visualize both current Bollinger structure and its forward projection.
Use ▲/▼ breakout markers to identify short-term reversals or volatility shifts.
When price consistently rides the upper band forecast, the trend is strong and likely continuing.
When regression shows narrowing bands ahead, expect a volatility contraction or consolidation period.
For range traders, outer projected bands can be used as potential mean reversion entry points .
Combine with volume or momentum filters to confirm whether breakouts are genuine or fading.
🔵 CONCLUSION
Bollinger Bands Regression Forecast transforms classic Bollinger analysis into a predictive forecasting model .
By merging volatility dynamics with regression-based extrapolation, it provides traders with a forward-looking visualization of likely price boundaries — revealing not only where volatility is but also where it’s heading next.

Bollinger Bands %B (ValueRay)One of the key features of this BB%B is its ability to highlight overbought and oversold conditions. This allows you to make informed decisions on when to enter and exit a trade, helping you maximize your profits and minimize your losses.
- Bollinger Bands %B with the ability to change to a different Time Frame.(Defaults to current Chart Time Frame).
- Ability To Turn On/Off Background Highlighting if BB %B is Above/Below 0 / 1 thresholds.
- Ability To Turn On/Off Background Highlighting when BB %B Crosses back above/unser 0/1 thresholds.
---
My personal recommandation use: combine with CM_Ultimate RSI Multi Time Frame (ChrisMoody) and have solid oversold/overbought levels, when hes RSI and my BB %B are bot red/green

BOLLY BandsThis is a strategy using Bollinger Bands. The strategy is predicated around having low volatility in price action and then looking to capture a move when price starts to trend outside of the Bollinger bands. This strategy has only been backtested for 1 month but it has promising results so I will be sharing it looking for feedback. I run this strategy on the ERUSD 1 min chart.

double Bollinger BandsThis Bollinger Band indicator is a technical analysis tool defined by a set of trendlines plotted Four standard deviations (two positively and two negatively) away from a simple moving average (SMA) of a security's price, but which can be adjusted to user preference.

Bollinger Bands Breakout StrategyBollinger Bands Breakout Strategy is the strategy version of Bollinger Bands Filter study version, which can be found under my scripts page. The strategy goes long when price closes above the upper band and goes short signal when price closes below the lower band.
Bollinger Bands is a classic indicator that uses a simple moving average of 20 periods, along with plots of upper and lower bands that are 2 standard deviations away from the basis line. These bands help visualize price volatility and trend based on where the price is, in relation to the bands.
The strategy doesn't take into account any other parameters such as Volume / RSI / Fundamentals etc, so user must use discretion based on confirmations from another indicator or based on fundamentals. The strategy results are based on purely long and short trades and doesn't take into account any user defined targets or stop losses.
The strategy works great when the price closes above/below upper/lower bands with continuation on next bar. It is definitely useful to have this strategy or the Bollinger Bands filter along with other indicators to get early glimpse of breach/fail of bands on candle close during BB squeeze or based on volatility .
This can be used on Heikin Ashi candles for spotting trends, but HA candles are not recommended for trade entries as they don't reflect true price of the asset.
The strategy settings default is 55 SMA and 1 standard deviation for Bollinger Bands filter, but these can be changed from settings.
It is definitely worth reading the 22 rules of Bollinger Bands written by John Bollinger if interested in trading Bollinger Bands successfully.

Double Bollinger Bands StrategyThe Strategy involves two Bollinger Bands (BB) at a go.
One with Divergence of 1 and another 2.
Strategy:
When the price rides above the inner BB, buy, check if it rides above the second BB. Exit when price falls inside the Outer BB and enters the Inner BB.
When the price rides below the inner BB, buy, check if it rides below the second BB. Exit when price rises inside the Outer BB and enters the Inner BB.
Bollinger Band Calculation ToolIntroducing the Bollinger Band Calculation Tool
What are Bollinger Bands ?
According to Investopedia ....
"In the 1980s, John Bollinger, a long-time technician of the markets, developed the technique of using a moving average with two trading bands above and below it.
Unlike a percentage calculation from a normal moving average, Bollinger Bands® simply add and subtract a standard deviation calculation.
Standard deviation is a mathematical formula that measures volatility, showing how the stock price can vary from its true value.
By measuring price volatility, Bollinger Bands® adjust themselves to market conditions.
This is what makes them so handy for traders; they can find almost all of the price data needed between the two bands."
Classic interpretations of Bollinger bands from Fidelity Investments....
"When the bands tighten during a period of low volatility, it raises the likelihood of a sharp price move in either direction.
This may begin a trending move. Watch out for a false move in opposite direction which reverses before the proper trend begins.
When the bands separate by an unusual large amount, volatility increases and any existing trend may be ending.
Prices have a tendency to bounce within the bands' envelope, touching one band then moving to the other band.
You can use these swings to help identify potential profit targets.
For example, if a price bounces off the lower band and then crosses above the moving average, the upper band then becomes the profit target.
Price can exceed or hug a band envelope for prolonged periods during strong trends.
On divergence with a momentum oscillator, you may want to do additional research to determine if taking additional profits is appropriate for you.
A strong trend continuation can be expected when the price moves out of the bands.
However, if prices move immediately back inside the band, then the suggested strength is negated."
This indicator contains a standard set of Bollinger Bands with the addition of a Test Closing Price calculation function.
It displays a standard set of Bollinger Bands by default.
How do I use the Test Closing Price function ?
Enter a test price in the Test Closing Price box in the settings, and then click the "Use Test Price" button.
The indicator will then replace the current Bollinger upper, lower and basis-lines with plots showing the resultant lines if price were to close at the Test Closing Price.
An information panel will appear which displays the test closing price and the resulting Bollinger-upper, Bollinger-lower and basis-line prices.
Can display up to 10 decimal places and has adjustable label offset.
It will also plot lines outlining the resultant closed candle body for clarity.
To return to "Standard Bollingers" just click off the "Use Test Price" button.
Knowing exactly what the Bollinger bands and Basis will do if a particular closing price is met can be useful in a variety of ways to traders who use Bollinger Bands® in their trading.
It is possible to work out exactly what closing price is required to get above or below a Bollinger band which is normally difficult as Bollingers react to the change in price.
Users can also experiment with different Test Closing Prices [/i to see exactly what effect this would have on the Basis moving average and on the Bollinger bands themselves.

Bollinger Band ToolkitBollinger Band Toolkit
An advanced, adaptive Bollinger Band system for traders who want more context, precision, and edge.
This indicator expands on the classic Bollinger Bands by combining statistical and volatility-based methods with modern divergence and squeeze detection tools. It helps identify volatility regimes, potential breakouts, and early momentum shifts — all within one clean overlay.
🔹 Core Features
1. Adaptive Bollinger Bands (σ + ATR)
Classic 20-period bands enhanced with an ATR-based volatility adjustment, making them more responsive to true market movement rather than just price variance.
Reduces “overreacting” during chop and avoids bands collapsing too tightly during trends.
2. %B & RSI Divergence Detection
🟢 Green dots: Positive %B divergence — price makes a lower low, but %B doesn’t confirm (bullish).
🔴 Red dots: Negative %B divergence — price makes a higher high, but %B doesn’t confirm (bearish).
✚ Red/green crosses: RSI divergence confirmation — momentum fails to confirm the price’s new extreme.
These signals highlight potential reversal or slowdown zones that are often invisible to the naked eye.
3. Bollinger Band Squeeze (with Volume Filter)
Yellow squares (■) show periods when Bollinger Bands are at their narrowest relative to recent history.
Volume confirmation ensures the squeeze only triggers when both volatility and participation contract.
Often marks the “calm before the storm” — breakout potential zones.
4. Multi-Timeframe Breakout Markers
Optionally displays breakouts from higher or lower timeframes using different colors/symbols.
Lets you see when a higher timeframe band break aligns with your current chart — a strong trend continuation signal.
5. Dual- and Triple-Band Visualization (±1σ, ±2σ, ±3σ)
Optional inner (±1σ) and outer (±3σ) bands provide a layered volatility map:
Price holding between ±1σ → stable range / mean-reverting behavior
Price riding near ±2σ → trending phase, sustained momentum
Price touching or exceeding ±3σ → volatility expansion or exhaustion zone
This triple-band layout visually distinguishes normal movement from statistical extremes, helping you read when the market is balanced, expanding, or approaching its limits.
⚙️ Inputs & Customization
Choose band type (SMA/EMA/SMMA/WMA/VWMA)
Adjust deviation multiplier (σ) and ATR multiplier
Toggle individual features (divergence dots, squeeze markers, inner bands, etc.)
Multi-timeframe and colour controls for advanced users
🧠 How to Use
Watch for squeeze markers followed by a breakout bar beyond ±2σ → volatility expansion signal.
Combine divergence dots with RSI or price structure to anticipate slowdowns or reversals.
Confirm direction using multi-timeframe breakouts and volume expansion.
💬 Why It Works
This toolkit transforms qualitative chart reading (tight bands, hidden divergence) into quantitative, testable conditions — giving you objective insights that can be backtested, coded, or simply trusted in live setups.

Bollinger Adaptive Trend Navigator [QuantAlgo]🟢 Overview
The Bollinger Adaptive Trend Navigator synthesizes volatility channel analysis with variable smoothing mechanics to generate trend identification signals. It uses price positioning within Bollinger Band structures to modify moving average responsiveness, while incorporating ATR calculations to establish trend line boundaries that constrain movement during volatile periods. The adaptive nature makes this indicator particularly valuable for traders and investors working across various asset classes including stocks, forex, commodities, and cryptocurrencies, with effectiveness spanning multiple timeframes from intraday scalping to longer-term position analysis.
🟢 How It Works
The core mechanism calculates price position within Bollinger Bands and uses this positioning to create an adaptive smoothing factor:
bbPosition = bbUpper != bbLower ? (source - bbLower) / (bbUpper - bbLower) : 0.5
adaptiveFactor = (bbPosition - 0.5) * 2 * adaptiveMultiplier * bandWidthRatio
alpha = math.max(0.01, math.min(0.5, 2.0 / (bbPeriod + 1) * (1 + math.abs(adaptiveFactor))))
This adaptive coefficient drives an exponential moving average that responds more aggressively when price approaches Bollinger Band extremes:
var float adaptiveTrend = source
adaptiveTrend := alpha * source + (1 - alpha) * nz(adaptiveTrend , source)
finalTrend = 0.7 * adaptiveTrend + 0.3 * smoothedCenter
ATR-based volatility boundaries constrain the final trend line to prevent excessive movement during volatile periods:
volatility = ta.atr(volatilityPeriod)
upperBound = bollingerTrendValue + (volatility * volatilityMultiplier)
lowerBound = bollingerTrendValue - (volatility * volatilityMultiplier)
The trend line direction determines bullish or bearish states through simple slope comparison, with the final output displaying color-coded signals based on the synthesis of Bollinger positioning, adaptive smoothing, and volatility constraints (green = long/buy, red = short/sell).
🟢 Signal Interpretation
Rising Trend Line (Green): Indicates upward direction based on Bollinger positioning and adaptive smoothing = Potential long/buy opportunity
Falling Trend Line (Red): Indicates downward direction based on Bollinger positioning and adaptive smoothing = Potential short/sell opportunity
Built-in Alert System: Automated notifications trigger when bullish or bearish states change, allowing you to act on significant development without constantly monitoring the charts
Candle Coloring: Optional feature applies trend colors to price bars for visual consistency
Configuration Presets: Three parameter sets available - Default (standard settings), Scalping (faster response), and Swing Trading (slower response)

Bollinger Bands Width and Bollinger Bands %BThis script shows both the Bollinger Band Width(BBW) and %B on the same indicator window.
Both the BBW and %B are introduced by John Bollinger(creator of Bollinger Bands) in 2010.
Default Parameter values: Length = 20, Source = Close, Mult = 2
Bollinger Bands Width (BBW): Color = (Default: Green )
- I consider stocks with "BBW >= 4" are at a volatile state and ready for price contraction, but this depends on the parameter values of your choice.
Bollinger Bands %B (%B): Color = (Default: Blue )
1. %B Above 10 = Price is Above the Upper Band
2. %B Equal to 10 = Price is at the Upper Band
3. %B Above 5 = Price is Above the Middle Line
4. %B Below 5 = Price is Below the Middle Line
5. %B Equal to 0 = Price is at the Lower Band
6. %B Below 0 = Price is Below the Lower Band
