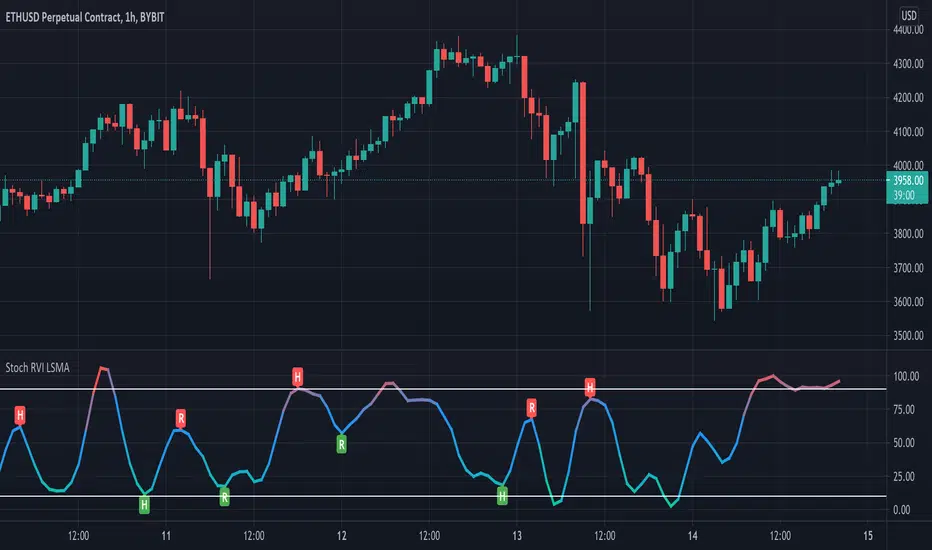
Relative Vigor Index (RVI) with EMD [AIBitcoinTrend]👽 Adaptive Relative Vigor Index with EMD & Signals (AIBitcoinTrend)
The Adaptive Relative Vigor Index (RVI) with Empirical Mode Decomposition (EMD) is an enhanced version of the traditional RVI, designed to improve signal clarity and responsiveness to market conditions. By integrating EMD smoothing and adaptive volatility-based trailing stops.
👽 What Makes the Adaptive RVI with EMD Unique?
Unlike the standard RVI, which often lags in volatile markets, this version refines price momentum detection by applying Empirical Mode Decomposition (EMD), effectively filtering out noise. Additionally, it features ATR-based trailing stops for precise trade execution.
Key Features:
EMD-Enhanced RVI – Filters out short-term noise, improving signal accuracy.
Crossover & Crossunder Signals – Generates trade signals based on RVI trends.
ATR-Based Trailing Stop – Adjusts dynamically based on volatility for optimal risk management.
👽 The Math Behind the Indicator
👾 RVI Calculation with EMD Smoothing
The Relative Vigor Index (RVI) measures trend strength by comparing the relationship between closing and opening prices, relative to the high-low range. Traditional RVI uses fixed smoothing, whereas this version applies Empirical Mode Decomposition (EMD) to extract dominant price cycles and improve trend clarity.
How It Works:
The RVI is initially calculated using a weighted moving average (WMA) over a specified period.
EMD refines the RVI signal by removing high-frequency noise, creating a smoothed RVI component.
This results in a more stable and reliable trend indicator.
👽 How Traders Can Use This Indicator
👾 Trailing Stop & Signal-Based Trading
Bullish Setup:
✅ RVI crosses above EMD → Buy signal.
✅ A bullish trailing stop is placed at low - ATR × Multiplier.
✅ Exit if price crosses below the stop.
Bearish Setup:
✅ RVI crosses below EMD → Sell signal.
✅ A bearish trailing stop is placed at high + ATR × Multiplier.
✅ Exit if price crosses above the stop.
👾 Detecting Overbought & Oversold Areas
This indicator helps traders identify potential reversal zones by highlighting overbought and oversold conditions.
Overbought Zone: When RVI moves above 0.4, the market may be overextended, signaling a potential reversal downward.
Oversold Zone: When RVI moves below -0.4, the market may be undervalued, suggesting a possible upward reversal.
Using these levels, traders can confirm entry and exit points alongside divergence signals for higher probability trades.
👽 Why It’s Useful for Traders
EMD-Based Signal Enhancement: Filters out noise, refining momentum signals.
Adaptive ATR-Based Risk Management: Automatically adjusts stop-loss levels to market conditions.
Works Across Multiple Markets & Timeframes: Effective for stocks, forex, crypto, and futures trading.
👽 Indicator Settings
RVI Length – Defines the period for calculating the Relative Vigor Index.
EMD Period – Controls the level of EMD smoothing applied.
Final Smoothing – Adjusts the degree of additional signal filtering.
Lookback Period – Determines how many bars are used for detecting pivot points.
Enable Trailing Stop – Activates dynamic ATR-based trailing stops.
ATR Multiplier – Adjusts the stop-loss sensitivity.
Disclaimer: This indicator is designed for educational purposes and does not constitute financial advice. Please consult a qualified financial advisor before making investment decisions.
RVI

Relative Vigor Index Z-ScoreThe Relative Vigor Index with Z-Score (RVIZ) is a combined technical analysis tool that helps traders assess the strength and volatility of price movements relative to a market's recent price behavior. This indicator incorporates two distinct concepts:
Relative Vigor Index (RVI):
The RVI is a momentum indicator that measures the strength of a trend by comparing the current price range (high vs low) with the opening and closing prices. The RVI is primarily used to determine if the current price movement is "vigorous" (strong) or weak, and it is plotted as a line that oscillates around a zero baseline.
Z-Score:
The Z-score is a statistical measurement that shows how many standard deviations the RVI is from its historical mean over a given period. This helps identify if the current RVI value is unusually high or low relative to past values, providing a normalized view of the indicator's extremity.
The combination of the RVI and Z-Score offers a more nuanced view of market momentum and volatility, allowing traders to assess both the strength of the current trend and its statistical significance.
Inputs:
Length (RVI Length):
The number of bars used to calculate the Relative Vigor Index. A larger length (e.g., 20 or more) results in a smoother RVI, while a shorter length makes the RVI more sensitive to short-term price changes.
Z-Score Length:
The number of bars used to compute the mean and standard deviation of the RVI for the Z-score calculation. This length determines how "historically" the Z-score will assess the RVI's behavior.
Offset:
Allows users to shift the indicator plot to the left or right for visual adjustment, particularly useful in certain charting setups.

Overbought & Oversold HeatmapThe Broadview OBOS Heatmap is a new indicator that takes commonly used oscillators and transforms them into a powerful heatmap, providing traders and investors with an unparalleled level of insight into market trends and cycles. With the ability to visualize 15 different oscillators all at once, the Broadview Overbought & Oversold Heatmap offers users the ability to control and analyze an impressive array of indicators.
The Relative Strength Index (RSI) is a momentum oscillator that measures the speed and change of price movements. It is often used to identify overbought and oversold conditions in the market. The Money Flow Index (MFI) is a volume-weighted version of the RSI, used to measure buying and selling pressure. The Commodity Channel Index (CCI) is a versatile oscillator used to measure momentum, trend, and overbought/oversold conditions. It is often used to identify trend reversals.
The Aroon Oscillator is a trend-following oscillator that measures the strength of a trend and the potential for a trend reversal. The Relative Volatility Index (RVI) is a volatility-based oscillator that measures the strength of a trend and potential trend reversals. The Stochastic Detrended Price Oscillator is a momentum oscillator that measures the difference between the current price and its moving average.
The Stochastic Elders Force Index is an oscillator used to measure buying and selling pressure. The Stochastic Relative Strength Index is a momentum oscillator used to measure the strength of a trend. The Stochastic Relative Vigor Index is a momentum oscillator used to measure the trend strength and potential reversals. The Stochastic Klinger Oscillator is a momentum oscillator that measures buying and selling pressure. The Stochastic Awesome Oscillator is a momentum oscillator that measures the difference between two moving averages.
The Stochastic Ultimate Oscillator is an oscillator used to measure the strength of a trend and potential reversals. The Stochastic Chande Momentum Oscillator is a momentum oscillator that measures the difference between two moving averages. The Stochastic On Balance Volume Oscillator is a volume-based oscillator used to measure the buying and selling pressure. The Stochastic MACD is a momentum oscillator that measures the difference between two moving averages.
The Broadview OBOS Heatmap is an extremely powerful indicator that reimagines commonly used oscillators as a heatmap, providing traders and investors with an unparalleled level of insight into market trends and cycles. With the ability to control and analyze 15 different oscillators at once, the Broadview Overbought & Oversold Heatmap offers users an incredibly comprehensive tool for analyzing market trends and making informed trading decisions.

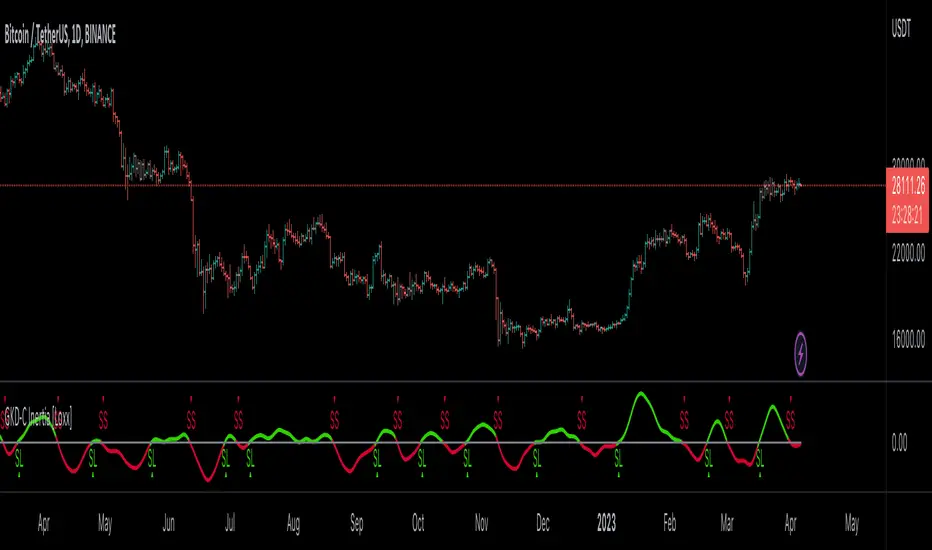
GKD-C Inertia [Loxx]Giga Kaleidoscope GKD-C Inertia is a Confirmation module included in Loxx's "Giga Kaleidoscope Modularized Trading System".
█ Giga Kaleidoscope Modularized Trading System
What is Loxx's "Giga Kaleidoscope Modularized Trading System"?
The Giga Kaleidoscope Modularized Trading System is a trading system built on the philosophy of the NNFX (No Nonsense Forex) algorithmic trading.
What is the NNFX algorithmic trading strategy?
The NNFX (No-Nonsense Forex) trading system is a comprehensive approach to Forex trading that is designed to simplify the process and remove the confusion and complexity that often surrounds trading. The system was developed by a Forex trader who goes by the pseudonym "VP" and has gained a significant following in the Forex community.
The NNFX trading system is based on a set of rules and guidelines that help traders make objective and informed decisions. These rules cover all aspects of trading, including market analysis, trade entry, stop loss placement, and trade management.
Here are the main components of the NNFX trading system:
1. Trading Philosophy: The NNFX trading system is based on the idea that successful trading requires a comprehensive understanding of the market, objective analysis, and strict risk management. The system aims to remove subjective elements from trading and focuses on objective rules and guidelines.
2. Technical Analysis: The NNFX trading system relies heavily on technical analysis and uses a range of indicators to identify high-probability trading opportunities. The system uses a combination of trend-following and mean-reverting strategies to identify trades.
3. Market Structure: The NNFX trading system emphasizes the importance of understanding the market structure, including price action, support and resistance levels, and market cycles. The system uses a range of tools to identify the market structure, including trend lines, channels, and moving averages.
4. Trade Entry: The NNFX trading system has strict rules for trade entry. The system uses a combination of technical indicators to identify high-probability trades, and traders must meet specific criteria to enter a trade.
5. Stop Loss Placement: The NNFX trading system places a significant emphasis on risk management and requires traders to place a stop loss order on every trade. The system uses a combination of technical analysis and market structure to determine the appropriate stop loss level.
6. Trade Management: The NNFX trading system has specific rules for managing open trades. The system aims to minimize risk and maximize profit by using a combination of trailing stops, take profit levels, and position sizing.
Overall, the NNFX trading system is designed to be a straightforward and easy-to-follow approach to Forex trading that can be applied by traders of all skill levels.
Core components of an NNFX algorithmic trading strategy
The NNFX algorithm is built on the principles of trend, momentum, and volatility. There are six core components in the NNFX trading algorithm:
1. Volatility - price volatility; e.g., Average True Range, True Range Double, Close-to-Close, etc.
2. Baseline - a moving average to identify price trend
3. Confirmation 1 - a technical indicator used to identify trends
4. Confirmation 2 - a technical indicator used to identify trends
5. Continuation - a technical indicator used to identify trends
6. Volatility/Volume - a technical indicator used to identify volatility/volume breakouts/breakdown
7. Exit - a technical indicator used to determine when a trend is exhausted
What is Volatility in the NNFX trading system?
In the NNFX (No Nonsense Forex) trading system, ATR (Average True Range) is typically used to measure the volatility of an asset. It is used as a part of the system to help determine the appropriate stop loss and take profit levels for a trade. ATR is calculated by taking the average of the true range values over a specified period.
True range is calculated as the maximum of the following values:
-Current high minus the current low
-Absolute value of the current high minus the previous close
-Absolute value of the current low minus the previous close
ATR is a dynamic indicator that changes with changes in volatility. As volatility increases, the value of ATR increases, and as volatility decreases, the value of ATR decreases. By using ATR in NNFX system, traders can adjust their stop loss and take profit levels according to the volatility of the asset being traded. This helps to ensure that the trade is given enough room to move, while also minimizing potential losses.
Other types of volatility include True Range Double (TRD), Close-to-Close, and Garman-Klass
What is a Baseline indicator?
The baseline is essentially a moving average, and is used to determine the overall direction of the market.
The baseline in the NNFX system is used to filter out trades that are not in line with the long-term trend of the market. The baseline is plotted on the chart along with other indicators, such as the Moving Average (MA), the Relative Strength Index (RSI), and the Average True Range (ATR).
Trades are only taken when the price is in the same direction as the baseline. For example, if the baseline is sloping upwards, only long trades are taken, and if the baseline is sloping downwards, only short trades are taken. This approach helps to ensure that trades are in line with the overall trend of the market, and reduces the risk of entering trades that are likely to fail.
By using a baseline in the NNFX system, traders can have a clear reference point for determining the overall trend of the market, and can make more informed trading decisions. The baseline helps to filter out noise and false signals, and ensures that trades are taken in the direction of the long-term trend.
What is a Confirmation indicator?
Confirmation indicators are technical indicators that are used to confirm the signals generated by primary indicators. Primary indicators are the core indicators used in the NNFX system, such as the Average True Range (ATR), the Moving Average (MA), and the Relative Strength Index (RSI).
The purpose of the confirmation indicators is to reduce false signals and improve the accuracy of the trading system. They are designed to confirm the signals generated by the primary indicators by providing additional information about the strength and direction of the trend.
Some examples of confirmation indicators that may be used in the NNFX system include the Bollinger Bands, the MACD (Moving Average Convergence Divergence), and the MACD Oscillator. These indicators can provide information about the volatility, momentum, and trend strength of the market, and can be used to confirm the signals generated by the primary indicators.
In the NNFX system, confirmation indicators are used in combination with primary indicators and other filters to create a trading system that is robust and reliable. By using multiple indicators to confirm trading signals, the system aims to reduce the risk of false signals and improve the overall profitability of the trades.
What is a Continuation indicator?
In the NNFX (No Nonsense Forex) trading system, a continuation indicator is a technical indicator that is used to confirm a current trend and predict that the trend is likely to continue in the same direction. A continuation indicator is typically used in conjunction with other indicators in the system, such as a baseline indicator, to provide a comprehensive trading strategy.
What is a Volatility/Volume indicator?
Volume indicators, such as the On Balance Volume (OBV), the Chaikin Money Flow (CMF), or the Volume Price Trend (VPT), are used to measure the amount of buying and selling activity in a market. They are based on the trading volume of the market, and can provide information about the strength of the trend. In the NNFX system, volume indicators are used to confirm trading signals generated by the Moving Average and the Relative Strength Index. Volatility indicators include Average Direction Index, Waddah Attar, and Volatility Ratio. In the NNFX trading system, volatility is a proxy for volume and vice versa.
By using volume indicators as confirmation tools, the NNFX trading system aims to reduce the risk of false signals and improve the overall profitability of trades. These indicators can provide additional information about the market that is not captured by the primary indicators, and can help traders to make more informed trading decisions. In addition, volume indicators can be used to identify potential changes in market trends and to confirm the strength of price movements.
What is an Exit indicator?
The exit indicator is used in conjunction with other indicators in the system, such as the Moving Average (MA), the Relative Strength Index (RSI), and the Average True Range (ATR), to provide a comprehensive trading strategy.
The exit indicator in the NNFX system can be any technical indicator that is deemed effective at identifying optimal exit points. Examples of exit indicators that are commonly used include the Parabolic SAR, the Average Directional Index (ADX), and the Chandelier Exit.
The purpose of the exit indicator is to identify when a trend is likely to reverse or when the market conditions have changed, signaling the need to exit a trade. By using an exit indicator, traders can manage their risk and prevent significant losses.
In the NNFX system, the exit indicator is used in conjunction with a stop loss and a take profit order to maximize profits and minimize losses. The stop loss order is used to limit the amount of loss that can be incurred if the trade goes against the trader, while the take profit order is used to lock in profits when the trade is moving in the trader's favor.
Overall, the use of an exit indicator in the NNFX trading system is an important component of a comprehensive trading strategy. It allows traders to manage their risk effectively and improve the profitability of their trades by exiting at the right time.
How does Loxx's GKD (Giga Kaleidoscope Modularized Trading System) implement the NNFX algorithm outlined above?
Loxx's GKD v1.0 system has five types of modules (indicators/strategies). These modules are:
1. GKD-BT - Backtesting module (Volatility, Number 1 in the NNFX algorithm)
2. GKD-B - Baseline module (Baseline and Volatility/Volume, Numbers 1 and 2 in the NNFX algorithm)
3. GKD-C - Confirmation 1/2 and Continuation module (Confirmation 1/2 and Continuation, Numbers 3, 4, and 5 in the NNFX algorithm)
4. GKD-V - Volatility/Volume module (Confirmation 1/2, Number 6 in the NNFX algorithm)
5. GKD-E - Exit module (Exit, Number 7 in the NNFX algorithm)
(additional module types will added in future releases)
Each module interacts with every module by passing data between modules. Data is passed between each module as described below:
GKD-B => GKD-V => GKD-C(1) => GKD-C(2) => GKD-C(Continuation) => GKD-E => GKD-BT
That is, the Baseline indicator passes its data to Volatility/Volume. The Volatility/Volume indicator passes its values to the Confirmation 1 indicator. The Confirmation 1 indicator passes its values to the Confirmation 2 indicator. The Confirmation 2 indicator passes its values to the Continuation indicator. The Continuation indicator passes its values to the Exit indicator, and finally, the Exit indicator passes its values to the Backtest strategy.
This chaining of indicators requires that each module conform to Loxx's GKD protocol, therefore allowing for the testing of every possible combination of technical indicators that make up the six components of the NNFX algorithm.
What does the application of the GKD trading system look like?
Example trading system:
Backtest: Strategy with 1-3 take profits, trailing stop loss, multiple types of PnL volatility, and 2 backtesting styles
Baseline: Hull Moving Average
Volatility/Volume: Hurst Exponent
Confirmation 1: Inertia as shown on the chart above
Confirmation 2: Williams Percent Range
Continuation: Fisher Transform
Exit: Rex Oscillator
Each GKD indicator is denoted with a module identifier of either: GKD-BT, GKD-B, GKD-C, GKD-V, or GKD-E. This allows traders to understand to which module each indicator belongs and where each indicator fits into the GKD protocol chain.
Giga Kaleidoscope Modularized Trading System Signals (based on the NNFX algorithm)
Standard Entry
1. GKD-C Confirmation 1 Signal
2. GKD-B Baseline agrees
3. Price is within a range of 0.2x Volatility and 1.0x Volatility of the Goldie Locks Mean
4. GKD-C Confirmation 2 agrees
5. GKD-V Volatility/Volume agrees
Baseline Entry
1. GKD-B Baseline signal
2. GKD-C Confirmation 1 agrees
3. Price is within a range of 0.2x Volatility and 1.0x Volatility of the Goldie Locks Mean
4. GKD-C Confirmation 2 agrees
5. GKD-V Volatility/Volume agrees
6. GKD-C Confirmation 1 signal was less than 7 candles prior
Continuation Entry
1. Standard Entry, Baseline Entry, or Pullback; entry triggered previously
2. GKD-B Baseline hasn't crossed since entry signal trigger
3. GKD-C Confirmation Continuation Indicator signals
4. GKD-C Confirmation 1 agrees
5. GKD-B Baseline agrees
6. GKD-C Confirmation 2 agrees
1-Candle Rule Standard Entry
1. GKD-C Confirmation 1 signal
2. GKD-B Baseline agrees
3. Price is within a range of 0.2x Volatility and 1.0x Volatility of the Goldie Locks Mean
Next Candle:
1. Price retraced (Long: close < close or Short: close > close )
2. GKD-B Baseline agrees
3. GKD-C Confirmation 1 agrees
4. GKD-C Confirmation 2 agrees
5. GKD-V Volatility/Volume agrees
1-Candle Rule Baseline Entry
1. GKD-B Baseline signal
2. GKD-C Confirmation 1 agrees
3. Price is within a range of 0.2x Volatility and 1.0x Volatility of the Goldie Locks Mean
4. GKD-C Confirmation 1 signal was less than 7 candles prior
Next Candle:
1. Price retraced (Long: close < close or Short: close > close )
2. GKD-B Baseline agrees
3. GKD-C Confirmation 1 agrees
4. GKD-C Confirmation 2 agrees
5. GKD-V Volatility/Volume Agrees
PullBack Entry
1. GKD-B Baseline signal
2. GKD-C Confirmation 1 agrees
3. Price is beyond 1.0x Volatility of Baseline
Next Candle:
1. Price is within a range of 0.2x Volatility and 1.0x Volatility of the Goldie Locks Mean
3. GKD-C Confirmation 1 agrees
4. GKD-C Confirmation 2 agrees
5. GKD-V Volatility/Volume Agrees
█ GKD-C Inertia
What is the Relative Vigor Index?
The Relative Vigor Index (RVI) is a technical analysis indicator used to measure the strength of a trend in financial markets. It was developed by John Ehlers and first introduced in his book "Cybernetic Analysis for Stocks and Futures" in 2004.
The RVI indicator is based on the concept that the strength of a trend can be measured by comparing the closing price of an asset to its opening price, and then smoothing out the resulting data with an exponential moving average (EMA). The indicator is calculated using the following steps:
Calculate the difference between the closing price and the opening price for a given period.
Calculate the high-low range for the same period.
Divide the difference in step 1 by the high-low range in step 2.
Calculate an EMA of the result obtained in step 3, usually using a period of 10.
The resulting RVI value oscillates around a centerline of 0. If the RVI value is positive, it indicates that the closing price is higher than the opening price and that the bullish momentum is increasing. If the RVI value is negative, it indicates that the closing price is lower than the opening price and that the bearish momentum is increasing.
Traders use the RVI indicator to identify changes in the momentum of a trend. When the RVI crosses above the centerline, it indicates that bullish momentum is increasing, and traders may look for opportunities to buy the asset. Conversely, when the RVI crosses below the centerline, it indicates that bearish momentum is increasing, and traders may look for opportunities to sell the asset.
It is important to note that the RVI is not a standalone indicator, and traders usually use it in conjunction with other technical analysis tools to confirm signals and make trading decisions.
What is The Least Squares Moving Average (LSMA)
The Least Squares Moving Average (LSMA) is a technical analysis indicator used to identify trends and momentum in financial markets. It is based on the concept of linear regression analysis, which is a statistical method used to estimate the relationship between two variables.
The LSMA indicator is calculated by fitting a linear regression line to the closing prices over a specified period of time. The slope of the regression line represents the trend, and the intercept represents the moving average. The LSMA indicator is a moving average of the regression line's intercept, and it is designed to be more responsive to changes in price than traditional moving averages.
The LSMA indicator is calculated using the following steps:
Determine the length of the moving average. This is the number of periods that will be used to calculate the LSMA.
Calculate the slope and intercept of the linear regression line for the closing prices over the specified period of time.
Calculate the LSMA using the intercept of the regression line and the length of the moving average.
Traders use the LSMA indicator to identify trends and momentum in financial markets. When the LSMA is moving upward, it indicates an uptrend, and traders may look for opportunities to buy the asset. Conversely, when the LSMA is moving downward, it indicates a downtrend, and traders may look for opportunities to sell the asset.
It is important to note that the LSMA is not a standalone indicator, and traders usually use it in conjunction with other technical analysis tools to confirm signals and make trading decisions. Additionally, the LSMA indicator can be subject to false signals during periods of market volatility, so traders should use caution when interpreting its signals.
What is Inertia?
Inertia applies Jurik Smoothing halfway through the calculation process to filter out noise thereby producing a cleaner output signal.
What is Inertia?
This indicator is the LSMA of RVI. This is one of various types of inertia used primarily in Forex trading but can be used for any time series financial data.
Requirements
Inputs
Confirmation 1 and Solo Confirmation: GKD-V Volatility / Volume indicator
Confirmation 2: GKD-C Confirmation indicator
Outputs
Confirmation 2 and Solo Confirmation Complex: GKD-E Exit indicator
Confirmation 1: GKD-C Confirmation indicator
Continuation: GKD-E Exit indicator
Solo Confirmation Simple: GKD-BT Backtest strategy
Additional features will be added in future releases.
AII - Average indicator of indicatorsThis Pine Script for TradingView is a technical analysis tool that visualizes the average of several popular indicators in the trading world. The indicators included are the RSI (Relative Strength Index), RVI (Relative Vigor Index), Stochastic RSI, Williams %R, relative MACD (ranging from 0 to 100), and Bollinger Bands price distance from 0 to 100. The script uses the "input" function to customize the length of the indicators and the "plot" function to display the results on the chart. In addition, options are included to turn off certain indicators and change the line colors if the user desires. All indicators can also be activated independently, allowing the user to see only the indicators they want. It is also mentioned that the script will be improved in the future to offer a better user experience. The calculated values are calculated with the default EMA of 14. Overall, this script is an excellent option for those looking for a combined view of several important indicators for making trading decisions.

Oversold / OverboughtMy first script. Based on RSI , CCI , RVI, and MFI . You can customize overbought or oversold thresholds for any indicator.
If you have any ideas - welcome.
Disclaimer
This is not financial advice. Trade on your own risk.

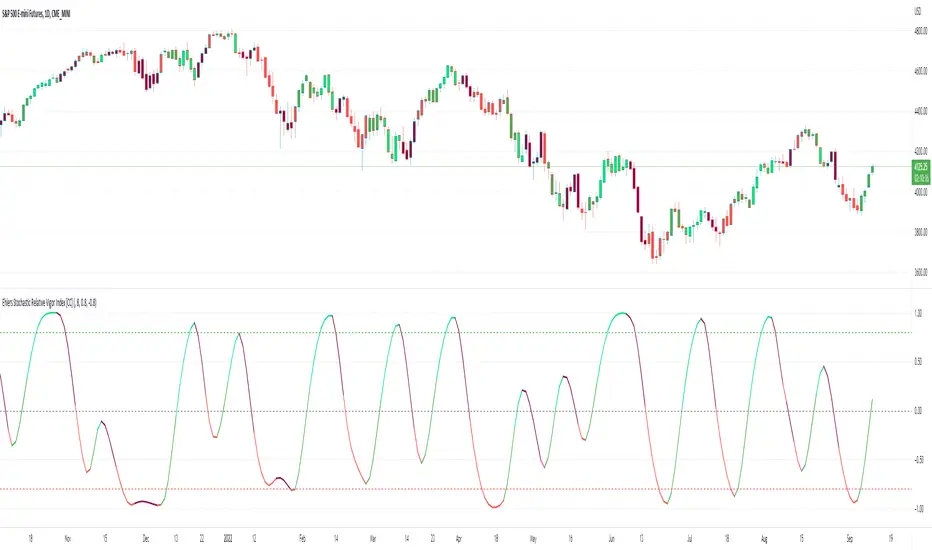
Ehlers Stochastic Relative Vigor Index [CC]The Stochastic Relative Vigor Index was created by John Ehlers (Cybernetic Analysis For Stocks And Futures pgs 84-89) and this of course is very similar to the Ehlers Fisher Stochastic Relative Vigor Index I just published. In hindsight I probably should have published this one first but just like with the other script this is a stochastic version of a Relative Vigor Index and I added some smoothing to make buy and sell signals clearer. There are several ways to identify buy and sell signals but generally in the long term it is a buy signal when the indicator is below the oversold line and is moving up and in the short term when the indicator is above it's trigger line which is what I coded the buy and sell signals to follow. Buy when the line is green and sell when it turns red.
Let me know if there are any other scripts you would like to see me publish!
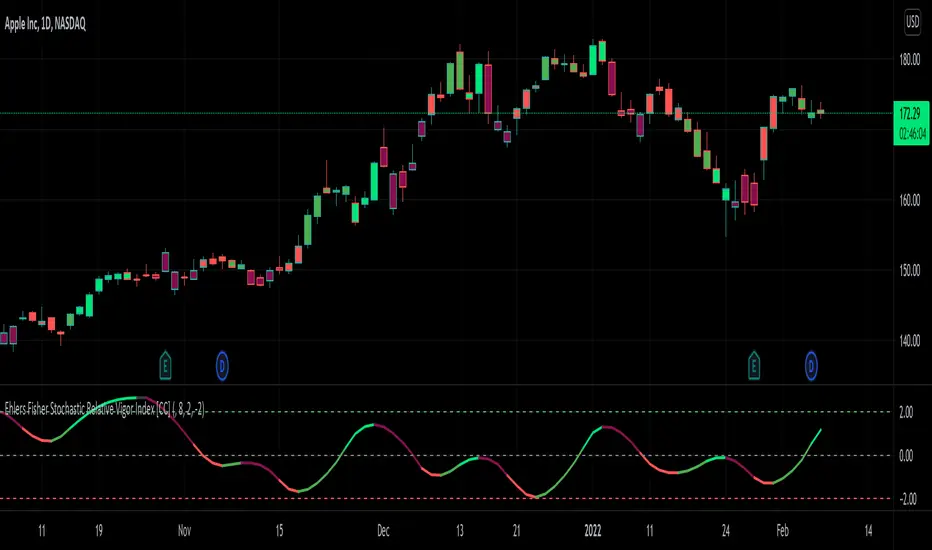
Ehlers Fisher Stochastic Relative Vigor Index [CC]The Fisher Stochastic Relative Vigor Index was created by John Ehlers (Cybernetic Analysis For Stocks And Futures pgs 101-104) and this is a many layered indicator created from his original Relative Vigor Index turned into a stochastic and then performing a Fisher transform on the results. I have included extra smoothing to provide clearer buy and sell signals as well as normal and strong buy and sell signals. As always strong signals are darker in color and normal signals are lighter in color. Buy when the line turns green and sell when it turns red.
Let me know if there are any other scripts you would like to see me publish!
Ehlers Relative Vigor Index [CC]The Relative Vigor Index was created by John Ehlers (Cybernetic Analysis For Stocks And Futures pg 58) and this is a momentum indicator that is similar to the Accumulation Distribution Oscillator created by Jim Waters and Larry Williams. He uses digital signal processing to smooth the indicator to provide clear buy and sell signals. The idea behind this indicator is that during uptrends, prices tend to close near the high and during downtrends, prices tend to close near the low. I have included strong buy and sell signals in addition to normal ones so strong signals are darker in color and normal ones are lighter in color. Buy when the line turns green and sell when it turns red. Usually the best signals I have found for this indicator is when the indicator is below the 0 line and turns green then it is usually a sign of a strong uptrend.
Let me know if there are any other scripts you would like to see me publish!

Volume, Momentum and Volatility weighted moving averageMoving averages are filters on price data. This moving average creates a filter which factors in:
- the price RSI or it's Momentum
- the volume RSI
- the RVI or Volatility
Each factor is put through a least squares filter to smooth them first.
Then the factors are used to build a coefficient for an exponentially weighted average.
The chart above shows a comparison of standard average types with this script.
This is useful if you are looking for a moving average based trigger and do not wish to react to candle noise price action.

Stochastic RVIBased on the Stochastic RSI but uses RVI (Relative Volatility Index) as source. Another great tool for finding market lows and entry points. This oscillator is also good for finding accurate diversions.

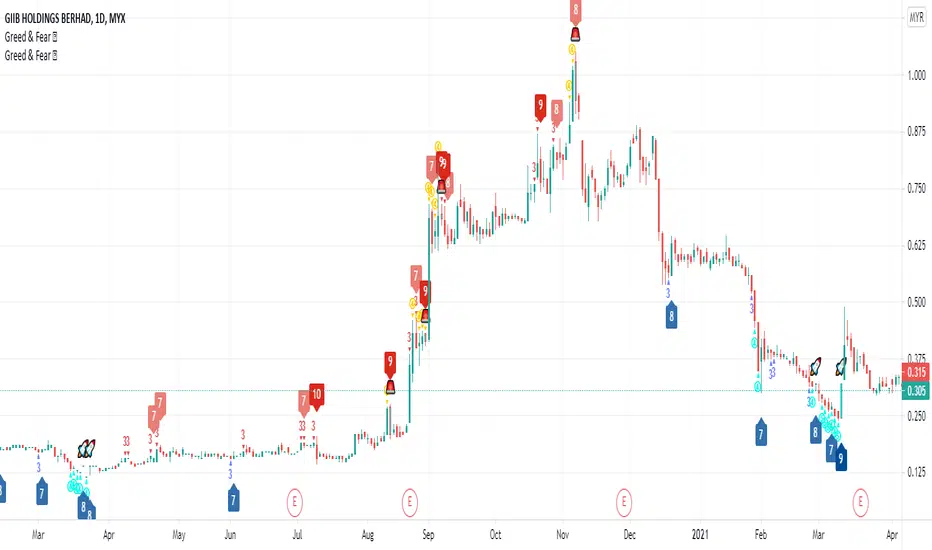
Greed and Fear ScoreHi All,
This is Greed and Fear Score script. The uses of this indicator is to let users know what is the state for each bar closed.
Warren Buffett once said that it is wise for investors to be “fearful when others are greedy, and greedy when others are fearful.
Greed & Fear Score (range from 1 - 5) has taken multiple measurements into consideration such as CCI, MFI, RSI, RVI and William %R.
The range of score is from 1 - 5 indicating weak to strong.
Red/Yellow represents Greed score.
Blue/Light Blue represents Fear score.
The Bull & Bear Transition Score (range from 1 - 10) is to measure how strong power needed to reverse the Greed or Fear State.
It is a powerful tool that incorporates CMF, MFI, CCI, MOMENTUM, OBV, RSI, RVI, WILLIAN %R, PRICE OSCILLATOR and Relative Volume.
How to use Bull & Bear Transition Score?
The higher the Bull & Bear Score, the more likely it will change from one state to another.
How to find BEST opportunity? Here comes the special symbol.
User can choose best fit combination by using filtering.
Cyber Momentum V2This Oscillator is another version of my previous Oscillator Cyber Momentum … in this version the CCI formula added to the core calculation therefore there is small differential behavior rather than Cyber Momentum because of different calculation methods …
But both of them are in the same concept; the most optimized signals are those that are in confluence of Cyber Momentum and Cyber Momentum V2 ...

[blackcat] L2 Ehlers Relative Vigor IndexLevel: 2
Background
John F. Ehlers introuced Relative Vigor Index in his "Cybernetic Analysis for Stocks and Futures" chapter 6 on 2004.
Function
Relative Vigor Index (RVI) uses concepts dating back over three decades and also uses modern filter and digital signal processing theory to realize those concepts as a practical and useful indicator. The RVI merges the old concepts with the new technologies. The basic idea of the RVI is that prices tend to close higher than
they open in up markets and tend to close lower than they open in down markets. The vigor of the move is thus established by where the prices reside at the end of the day. To normalize the index to the daily trading range, the change in price is divided by the maximum range of prices for the day.
The RVI is an oscillator, and we are therefore only concerned with the cycle modes of the market in its use. The sharpest rate of change for a cycle is at its midpoint. Therefore, in the ascending part of the cycle we would expect the difference between the close and open to be at a maximum. This is like a derivative in calculus, where the derivative of a sinewave produces a negative cosine wave. The derivative is therefore a waveform that leads the original sinewave by a quarter cycle. Also, from calculus, integration of a sinewave over a half-cycle period results in another sinewave delayed by a quarter cycle. Summing over a half cycle is basically the same as mathematically integrating, with the result that the waveshape of the sum is delayed by a quarter wavelength relative to the input. The net result of taking the differences and summing produces an oscillator output in phase with the cyclic component of the price. It is also possible to generate a leading function if the summation window is less than a half wavelength of the Dominant Cycle. If a cycle measurement is not available, you can sum the RVI components over a fixed default period. A nominal value of 8 is suggested because this is approximately half the period of most cycles of interest.
Key Signal
RVI ---> Relative Vigor Index fast line
Trigger ---> Relative Vigor Index slow line
Pros and Cons
100% John F. Ehlers definition translation of original work, even variable names are the same. This help readers who would like to use pine to read his book. If you had read his works, then you will be quite familiar with my code style.
Remarks
The 27th script for Blackcat1402 John F. Ehlers Week publication.
Readme
In real life, I am a prolific inventor. I have successfully applied for more than 60 international and regional patents in the past 12 years. But in the past two years or so, I have tried to transfer my creativity to the development of trading strategies. Tradingview is the ideal platform for me. I am selecting and contributing some of the hundreds of scripts to publish in Tradingview community. Welcome everyone to interact with me to discuss these interesting pine scripts.
The scripts posted are categorized into 5 levels according to my efforts or manhours put into these works.
Level 1 : interesting script snippets or distinctive improvement from classic indicators or strategy. Level 1 scripts can usually appear in more complex indicators as a function module or element.
Level 2 : composite indicator/strategy. By selecting or combining several independent or dependent functions or sub indicators in proper way, the composite script exhibits a resonance phenomenon which can filter out noise or fake trading signal to enhance trading confidence level.
Level 3 : comprehensive indicator/strategy. They are simple trading systems based on my strategies. They are commonly containing several or all of entry signal, close signal, stop loss, take profit, re-entry, risk management, and position sizing techniques. Even some interesting fundamental and mass psychological aspects are incorporated.
Level 4 : script snippets or functions that do not disclose source code. Interesting element that can reveal market laws and work as raw material for indicators and strategies. If you find Level 1~2 scripts are helpful, Level 4 is a private version that took me far more efforts to develop.
Level 5 : indicator/strategy that do not disclose source code. private version of Level 3 script with my accumulated script processing skills or a large number of custom functions. I had a private function library built in past two years. Level 5 scripts use many of them to achieve private trading strategy.
Ehlers Adaptive Relative Vigor Index [CC]The Adaptive Relative Vigor Index was created by John Ehlers (Cybernetic Analysis For Stocks And Futures pgs 140-141) and it does a pretty good job of capturing the peaks and valleys of the underlying data. There are several ways to read this particular indicator so for long term trades then buy when it goes above 0 and sell when it falls below 0 or for shorter term trades then buy when the indicator line turns green and sell when it turns red.
Let me know if there are other indicators you would like to see me publish or if you want something custom done!

RVI trend confirmationUses the RVI (Relative Volatility Index) to confirm trend. It focus on the direction of the RVI and not if it is above or below a certain level.
HOW to read the indicator:
Blue or value 1 = bull trend confirmation
Red or value -1 = bear trend confirmation
Gray or value 0 = choppy market
Combine this with another indicator in order to confirm whether a trend is starting.

NN Trading SystemThis indicator is an attempt to be all-in-one solution that follows the structure of NNFX Youtube channel. The components may vary from trader to trader. This is my compilation. If you have any ideas to make it better, let me know.
Brief Info about the structure:
The trader chooses best indicators for the positions described below; enters and exits positions strictly based on the consensus of the indicators. Here are components:
1. Baseline (trend line): I usually use "Regression Line" indicator that can be found in the public library. If the price is above the baseline, look for longs; if the price is below the baseline, look for shorts. This part cannot be included in this indicator since it needs the indicator to be an overlay indicator. So choose and couple with your own.
2. Entry Signal: This is the main indicator that signals opening positions. I tested lots of indicators and finally chose LazyBear's MACD Leader Indicator. This is the modified version of it. When the signal line crosses over the zero line, it's a long signal. When the signal line crosses under the zero line, it's a short signal. You may also use the peaks of the hills it creates as a signal if you think it performs better. It's up to you. I have added dots for the possible peaks using "alma" cross algorithm.
3. Confirmation Signal #1: To open a position both the confirmation signals need to give a green signal. otherwise you are not allowed to open the position. Chosen indicator for this job is ATR. Set your minimum ATR value on the settings box and if the current ATR on the current timeframe is below the ATR value, a gray line will be drawn over the entry signal line and you should not take the trade. If you are already have a position, this doesn't mean that you should close the position though. It just informs you that momentum is low. YOU NEED TO ADJUST THIS ATR LIMIT FOR EVERY ASSET AND TIMEFRAME YOU TRADE. For BTC 1min, my example limit value is 8. Find your best value.
4. Confirmation Signal #2: I have chosen Aroon indicator for trend confirmations. If the background of the indicator is green, it's suitable for longs, if it's red, it's suitable for shorts. If the color is brighter, that means the signal is stronger. Aroon is a very powerful indicator but you need to find the best settings for the timeframe you are using.
5. Exit Signal: This one is the hardest role to find an indicator for. The one i ended up choosing is "Relative Vigor Index". It doesn't give good entry signals but with the right settings, it works as an exit signal in my experience. This signal is drawn as a green and red boxes and the top and the bottom of the indicator area. If it changes color while you have a position, it's time to close the position. Find the right settings for it so that every time it signals reversal, you obey the rule and close the position.
To summarise, the components are:
* ATR
* MACDL
* ALMA CROSSOVER
* AROON
* RVGI
plus
* a trend line indicator of your choice added seperately to your chart.
My recommendation is to turn all the indicators off on the settings box and enable on by one finding the best values individually. If you found the best settings for an asset and timeframe, please share in the comments for others.
You may leave a comment for bug reports, feedback and suggestions.
Hope it works for you.
Cheers.

Hybrid Overbought/Oversold Detector + Put/Call SignalsThere are many indicators of overbought/oversold conditions out there. Some of more common ones are:
- Bollinger Bands %B
- Money Flow Index (MFI)
- Relative Strength Index (RSI)
- Stochastic
This script uses a combination of these 4 oscillators to confirm overbought/oversold and filter the signals of market reverse which could be used for trading binary options.
You may select which oscillators you want to apply and of course change the source, the length of the calculations and the overbought/oversold levels.
Also the script will draw a combined graph which is the average of the selected oscillators in the options.
Send me your ideas!

TS - Volatility ScreenerWhat is it?
Get a quick view on market volatility , helpful to avoid fakeout or to see when the bull or bears are really pushing the price.
Also detects candle outliers (represented by the squares) for individual candle volatility analysis
How do I get access?
PM me on TradingView!

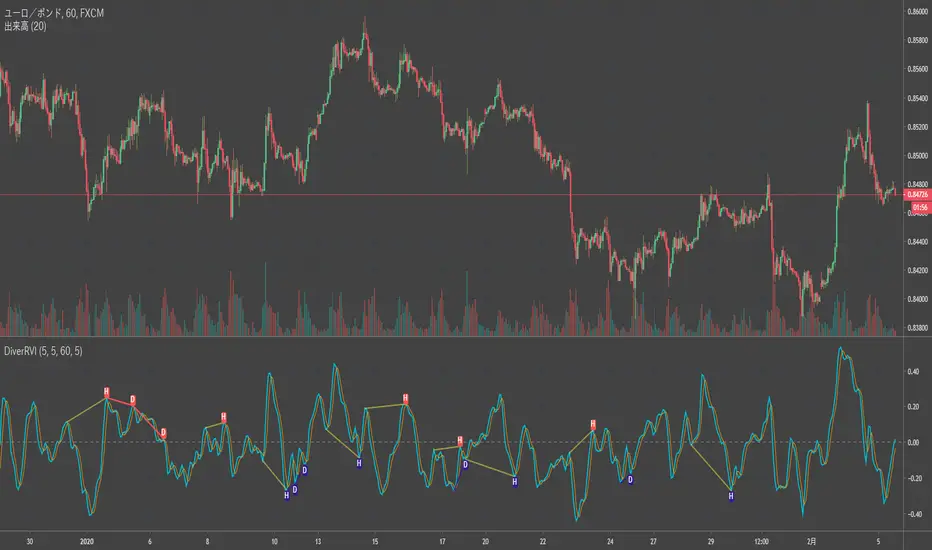
Divergence RVI[mado]Divergence screener for RVI
Regular Bullish: "D" navy label
Hidden Bullish: "H" navy label
Regular Bearish: "D" red label
Hidden Bearish: "H" red label
Stochastic RSI 3in1 & Volatility peaks + ADX by AGUDescription:
3 Lines are Stochastic RSI's, strongest move is when all crosses and moves to one direction (from top or bottom).
Orange is original Stochastic of the timeline. (Live movement of price).
Green is original Stoch x 6. (Short term movement).
Red is original Stoch x27 (Long term price movement).
Transparent columns are ADX signal.
Higher the mountain, stronger the signal. When the mountain tops, trend usually change.
And finally the volatility peaks. Green peak HIGHEST volatility , RED peak LOWEST volatility .
I use it on 1 min BTC chart. But it works on all.
TIPS >> 3HCQ41cRpxcq2MJdRUSYoq9N1RnEy98xD2

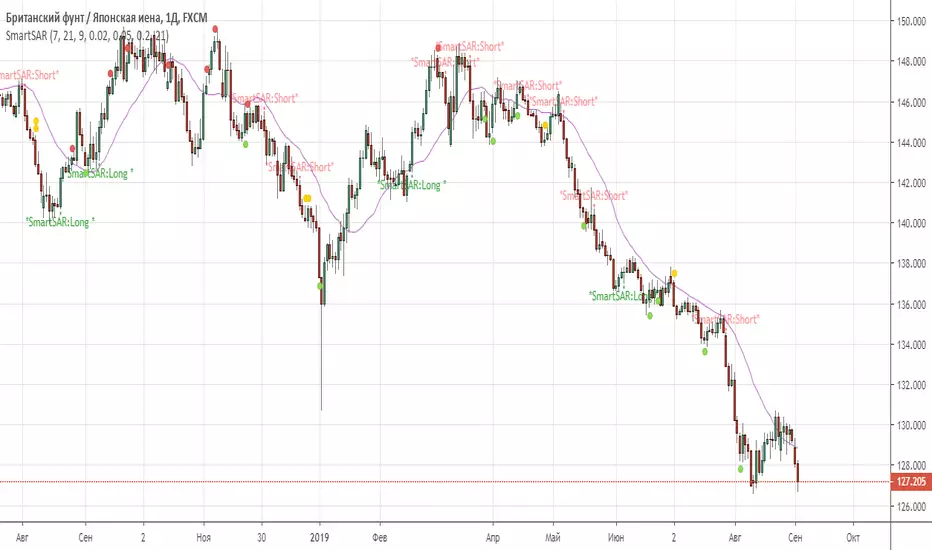
SmartSARSAR signal filtered by 3 indicators: MACD, AC, RVI.
This combination of trend indicator(SAR), 2 oscillators (MACD, RVI) , and 1 Bill Williams (AC) give us good Enter point.
Recommended timeframes: from 30 min and higher.