BTCUSD RSI + Fear & GreedA chill rsi + fear n greed indicator draft, may need some touch ups but seems to be a solid concept on paper :)
Rsisignal

Mini RSI+STOCH-RSI+RSI-DIVERGENCE @Marx_CapitalMini version of RSI + STOCHASTIC-RSI with RSI-Divergence detection - all in one, adjustable small table overlayed on your chart. The table box gives RSI and Stoch-RSI values and signals detected RSI divergences.
Uncheck 'Update only on bar close' in indicator settings if the box does not appear right away.

SNP420/RSI_GOD_KOMPLEXRSI_GOD_KOMPLEX is a multi–timeframe RSI scanner for TradingView that displays a compact table in the top-right corner of the chart. For each timeframe (1m, 5m, 15m, 30m, 1h, 4h, 1d) it tracks the fast RSI line (not the smoothed/main one) and marks BUY in green when RSI crosses up through 30 (leaving oversold territory) and SELL in red when RSI crosses down through 70 (leaving overbought territory), always using only closed candles for reliable, non-repainting signals. The indicator remembers the last valid signal per timeframe, so the table always shows the most recent directional impulse from RSI across all selected timeframes on the same instrument.
author: SNP420 + Jarvis
project: FNXS
ps: piece and love

RSI Forecast Colorful [DiFlip]RSI Forecast Colorful
Introducing one of the most complete RSI indicators available — a highly customizable analytical tool that integrates advanced prediction capabilities. RSI Forecast Colorful is an evolution of the classic RSI, designed to anticipate potential future RSI movements using linear regression. Instead of simply reacting to historical data, this indicator provides a statistical projection of the RSI’s future behavior, offering a forward-looking view of market conditions.
⯁ Real-Time RSI Forecasting
For the first time, a public RSI indicator integrates linear regression (least squares method) to forecast the RSI’s future behavior. This innovative approach allows traders to anticipate market movements based on historical trends. By applying Linear Regression to the RSI, the indicator displays a projected trendline n periods ahead, helping traders make more informed buy or sell decisions.
⯁ Highly Customizable
The indicator is fully adaptable to any trading style. Dozens of parameters can be optimized to match your system. All 28 long and short entry conditions are selectable and configurable, allowing the construction of quantitative, statistical, and automated trading models. Full control over signals ensures precise alignment with your strategy.
⯁ Innovative and Science-Based
This is the first public RSI indicator to apply least-squares predictive modeling to RSI calculations. Technically, it incorporates machine-learning logic into a classic indicator. Using Linear Regression embeds strong statistical foundations into RSI forecasting, making this tool especially valuable for traders seeking quantitative and analytical advantages.
⯁ Scientific Foundation: Linear Regression
Linear regression is a fundamental statistical method that models the relationship between a dependent variable y and one or more independent variables x. The general formula for simple linear regression is:
y = β₀ + β₁x + ε
where:
y = predicted variable (e.g., future RSI value)
x = explanatory variable (e.g., bar index or time)
β₀ = intercept (value of y when x = 0)
β₁ = slope (rate of change of y relative to x)
ε = random error term
The goal is to estimate β₀ and β₁ by minimizing the sum of squared errors. This is achieved using the least squares method, ensuring the best linear fit to historical data. Once the coefficients are calculated, the model extends the regression line forward, generating the RSI projection based on recent trends.
⯁ Least Squares Estimation
To minimize the error between predicted and observed values, we use the formulas:
β₁ = Σ((xᵢ - x̄)(yᵢ - ȳ)) / Σ((xᵢ - x̄)²)
β₀ = ȳ - β₁x̄
Σ denotes summation; x̄ and ȳ are the means of x and y; and i ranges from 1 to n (number of observations). These equations produce the best linear unbiased estimator under the Gauss–Markov assumptions — constant variance (homoscedasticity) and a linear relationship between variables.
⯁ Linear Regression in Machine Learning
Linear regression is a foundational component of supervised learning. Its simplicity and precision in numerical prediction make it essential in AI, predictive algorithms, and time-series forecasting. Applying regression to RSI is akin to embedding artificial intelligence inside a classic indicator, adding a new analytical dimension.
⯁ Visual Interpretation
Imagine a time series of RSI values like this:
Time →
RSI →
The regression line smooths these historical values and projects itself n periods forward, creating a predictive trajectory. This projected RSI line can cross the actual RSI, generating sophisticated entry and exit signals. In summary, the RSI Forecast Colorful indicator provides both the current RSI and the forecasted RSI, allowing comparison between past and future trend behavior.
⯁ Summary of Scientific Concepts Used
Linear Regression: Models relationships between variables using a straight line.
Least Squares: Minimizes squared prediction errors for optimal fit.
Time-Series Forecasting: Predicts future values from historical patterns.
Supervised Learning: Predictive modeling based on known output values.
Statistical Smoothing: Reduces noise to highlight underlying trends.
⯁ Why This Indicator Is Revolutionary
Scientifically grounded: Built on statistical and mathematical theory.
First of its kind: The first public RSI with least-squares predictive modeling.
Intelligent: Incorporates machine-learning logic into RSI interpretation.
Forward-looking: Generates predictive, not just reactive, signals.
Customizable: Exceptionally flexible for any strategic framework.
⯁ Conclusion
By combining RSI and linear regression, the RSI Forecast Colorful allows traders to predict market momentum rather than simply follow it. It's not just another indicator: it's a scientific advancement in technical analysis technology. Offering 28 configurable entry conditions and advanced signals, this open-source indicator paves the way for innovative quantitative systems.
⯁ Example of simple linear regression with one independent variable
This example demonstrates how a basic linear regression works when there is only one independent variable influencing the dependent variable. This type of model is used to identify a direct relationship between two variables.
⯁ In linear regression, observations (red) are considered the result of random deviations (green) from an underlying relationship (blue) between a dependent variable (y) and an independent variable (x)
This concept illustrates that sampled data points rarely align perfectly with the true trend line. Instead, each observed point represents the combination of the true underlying relationship and a random error component.
⯁ Visualizing heteroscedasticity in a scatterplot with 100 random fitted values using Matlab
Heteroscedasticity occurs when the variance of the errors is not constant across the range of fitted values. This visualization highlights how the spread of data can change unpredictably, which is an important factor in evaluating the validity of regression models.
⯁ The datasets in Anscombe’s quartet were designed to have nearly the same linear regression line (as well as nearly identical means, standard deviations, and correlations) but look very different when plotted
This classic example shows that summary statistics alone can be misleading. Even with identical numerical metrics, the datasets display completely different patterns, emphasizing the importance of visual inspection when interpreting a model.
⯁ Result of fitting a set of data points with a quadratic function
This example illustrates how a second-degree polynomial model can better fit certain datasets that do not follow a linear trend. The resulting curve reflects the true shape of the data more accurately than a straight line.
⯁ What Is RSI?
The RSI (Relative Strength Index) is a technical indicator developed by J. Welles Wilder. It measures the velocity and magnitude of recent price movements to identify overbought and oversold conditions. The RSI ranges from 0 to 100 and is commonly used to identify potential reversals and evaluate trend strength.
⯁ How RSI Works
RSI is calculated from average gains and losses over a set period (commonly 14 bars) and plotted on a 0–100 scale. It consists of three key zones:
Overbought: RSI above 70 may signal an overbought market.
Oversold: RSI below 30 may signal an oversold market.
Neutral Zone: RSI between 30 and 70, indicating no extreme condition.
These zones help identify potential price reversals and confirm trend strength.
⯁ Entry Conditions
All conditions below are fully customizable and allow detailed control over entry signal creation.
📈 BUY
🧲 Signal Validity: Signal remains valid for X bars.
🧲 Signal Logic: Configurable using AND or OR.
🧲 RSI > Upper
🧲 RSI < Upper
🧲 RSI > Lower
🧲 RSI < Lower
🧲 RSI > Middle
🧲 RSI < Middle
🧲 RSI > MA
🧲 RSI < MA
🧲 MA > Upper
🧲 MA < Upper
🧲 MA > Lower
🧲 MA < Lower
🧲 RSI (Crossover) Upper
🧲 RSI (Crossunder) Upper
🧲 RSI (Crossover) Lower
🧲 RSI (Crossunder) Lower
🧲 RSI (Crossover) Middle
🧲 RSI (Crossunder) Middle
🧲 RSI (Crossover) MA
🧲 RSI (Crossunder) MA
🧲 MA (Crossover)Upper
🧲 MA (Crossunder)Upper
🧲 MA (Crossover) Lower
🧲 MA (Crossunder) Lower
🧲 RSI Bullish Divergence
🧲 RSI Bearish Divergence
🔮 RSI (Crossover) Forecast MA
🔮 RSI (Crossunder) Forecast MA
📉 SELL
🧲 Signal Validity: Signal remains valid for X bars.
🧲 Signal Logic: Configurable using AND or OR.
🧲 RSI > Upper
🧲 RSI < Upper
🧲 RSI > Lower
🧲 RSI < Lower
🧲 RSI > Middle
🧲 RSI < Middle
🧲 RSI > MA
🧲 RSI < MA
🧲 MA > Upper
🧲 MA < Upper
🧲 MA > Lower
🧲 MA < Lower
🧲 RSI (Crossover) Upper
🧲 RSI (Crossunder) Upper
🧲 RSI (Crossover) Lower
🧲 RSI (Crossunder) Lower
🧲 RSI (Crossover) Middle
🧲 RSI (Crossunder) Middle
🧲 RSI (Crossover) MA
🧲 RSI (Crossunder) MA
🧲 MA (Crossover)Upper
🧲 MA (Crossunder)Upper
🧲 MA (Crossover) Lower
🧲 MA (Crossunder) Lower
🧲 RSI Bullish Divergence
🧲 RSI Bearish Divergence
🔮 RSI (Crossover) Forecast MA
🔮 RSI (Crossunder) Forecast MA
🤖 Automation
All BUY and SELL conditions can be automated using TradingView alerts. Every configurable condition can trigger alerts suitable for fully automated or semi-automated strategies.
⯁ Unique Features
Linear Regression Forecast
Signal Validity: Keep signals active for X bars
Signal Logic: AND/OR configuration
Condition Table: BUY/SELL
Condition Labels: BUY/SELL
Chart Labels: BUY/SELL markers above price
Automation & Alerts: BUY/SELL
Background Colors: bgcolor
Fill Colors: fill
Linear Regression Forecast
Signal Validity: Keep signals active for X bars
Signal Logic: AND/OR configuration
Condition Table: BUY/SELL
Condition Labels: BUY/SELL
Chart Labels: BUY/SELL markers above price
Automation & Alerts: BUY/SELL
Background Colors: bgcolor
Fill Colors: fill

Smart RSI Money Flow - Core Bands V1.01SMART RSI – Money Flow Bands (Technical Overview)
1. Background: RSI and Its Behavior on Lower Timeframes
The Relative Strength Index (RSI) originally is a momentum oscillator calculated from average gains and losses over a selected period. In its standard form, RSI is derived solely from price changes; it does not incorporate volume data or order-flow information in its formula.
Because RSI is price-based, its interpretation depends strongly on the timeframe:
• On higher timeframes, each bar aggregates more trading activity, and RSI tends to behave more smoothly.
• On lower timeframes (1-hour down to intraday scalping intervals), price fluctuations are quicker, and RSI becomes more sensitive to short-term noise.
This does not imply that RSI becomes invalid, but that its signals on fast charts can be more reactive and may benefit from additional context such as volume behavior or structural information.
2. Purpose of This Indicator
This indicator extends the classical RSI by adding information that RSI does not include:
• Mapping RSI values into price-based bands instead of the 0–100 oscillator space.
• Retrieving lower timeframe volume data and separating it into buy and sell components.
• Comparing the slope (angle) of price movement with the slope of buy and sell volume.
The goal is to provide a structural interpretation of where price sits relative to RSI conditions and how volume is behaving on a lower timeframe.
3. Technical Differences Compared to Classical RSI
A) Classical RSI
• Input: price only (usually close).
• Output: normalized oscillator between 0 and 100.
• Does not incorporate intra-bar volume distribution.
• Does not separate buy/sell volume.
B) SMART RSI – Money Flow Bands
1) RSI-to-Price Mapping
Converts RSI values into upper/lower price bands using recent price extremes.
2) Lower Timeframe Volume Decomposition
Retrieves LTF data and splits each bar’s volume into buy (close>open) and sell (close

RSI Divergence Strategy v6 What this does
Detects regular and hidden divergences between price and RSI using confirmed RSI pivots. Adds RSI@pivot entry gates, a normalized strength + volume filter, optional volume gate, delayed entries, and transparent risk management with rigid SL and activatable trailing. Visuals are throttled for clarity and include a gap-free horizontal RSI gradient.
How it works (simple)
🧮 RSI is calculated on your selected source/period.
📌 RSI pivots are confirmed with left/right lookbacks (lbL/lbR). A pivot becomes final only after lbR bars; before that, it can move (expected).
🔎 The latest confirmed pivot is compared against the previous confirmed pivot within your bar window:
• Regular Bullish = price lower low + RSI higher low
• Hidden Bullish = price higher low + RSI lower low
• Regular Bearish = price higher high + RSI lower high
• Hidden Bearish = price lower high + RSI higher high
💪 Each divergence gets a strength score that multiplies price % change, RSI change, and a volume ratio (Volume SMA / Baseline Volume SMA).
• Set Min divergence strength to filter tiny/noisy signals.
• Turn on the volume gate to require volume ratio ≥ your threshold (e.g., 1.0).
🎯 RSI@pivot gating:
• Longs only if RSI at the bullish pivot ≤ 30 (default).
• Shorts only if RSI at the bearish pivot ≥ 70 (default).
⏱ Entry timing:
• Immediate: on divergence confirm (delay = 0).
• Delayed: after N bars if RSI is still valid.
• RSI-only mode: ignore divergences; use RSI thresholds only.
🛡 Risk:
• Rigid SL is placed from average entry.
• Trailing activates only after unrealized gain ≥ threshold; it re-anchors on new highs (long) or new lows (short).
What’s NEW here (vs. the reference) — and why you may care
• Improved pivots + bar window → fewer early/misaligned signals; cleaner drawings.
• RSI@pivot gates → entries aligned with true oversold/overbought at the exact decision bar.
• Normalized strength + volume gate → ignore weak or low-volume divergences.
• Delayed entries → require the signal to persist N bars if you want more confirmation.
• Rigid SL + activatable trailing → trailing engages only after a cushion, so it’s less noisy.
• Clutter control + gradient → readable chart with a smooth RSI band look.
Suggested starting values (clear ranges)
• RSI@pivot thresholds: LONG ≤ 30 (oversold), SHORT ≥ 70 (overbought).
• Min divergence strength:
0.0 = off
3–6 = moderate filter
7–12 = strict filter for noisy LTFs
• Volume gate (ratio):
1.0 = at least baseline volume
1.2–1.5 = strong-volume only (fewer but cleaner signals)
• Pivot lookbacks:
lbL 1–2, lbR 3–4 (raise lbR to confirm later and reduce noise)
• Bar window (between pivots):
Min 5–10, Max 30–60 (increase Min if you see micro-pivots; increase Max for wider structures)
• Risk:
Rigid SL 2–5% on liquid majors; 5–10% on higher-volatility symbols
Trailing activation 1–3%, trailing 0.5–1.5% are common intraday starts
Plain-text examples
• BTCUSDT 1h → RSI 9, lbL 1, lbR 3, Min strength 5.0, Volume gate 1.0, SL 4.5%, Trail on 2.0%, Trail 1.0%.
• SPY 15m → RSI 8, lbL 1, lbR 3, Min strength 7.0, Volume gate 1.2, SL 3.0%, Trail on 1.5%, Trail 0.8%.
• EURUSD 4h → RSI 14, lbL 2, lbR 4, Min strength 4.0, Volume gate 1.0, SL 2.5%, Trail on 1.0%, Trail 0.5%.
Notes & limitations
• Pivot confirmation means the newest candidate pivot can move until lbR confirms it (expected).
• Results vary by timeframe/symbol/settings; always forward-test.
• Educational tool — no performance or profit claims.
Credits
• RSI by J. Welles Wilder Jr. (1978).
• Reference divergence script by eemani123:
• This version by tagstrading 2025 adds: improved pivot engine, RSI@pivot gating, normalized strength + optional volume gate, delayed entries, rigid SL and activatable trailing, and a gap-free RSI gradient.

BayesStack RSI [CHE]BayesStack RSI — Stacked RSI with Bayesian outcome stats and gradient visualization
Summary
BayesStack RSI builds a four-length RSI stack and evaluates it with a simple Bayesian success model over a rolling window. It highlights bull and bear stack regimes, colors price with magnitude-based gradients, and reports per-regime counts, wins, and estimated win rate in a compact table. Signals seek to be more robust through explicit ordering tolerance, optional midline gating, and outcome evaluation that waits for events to mature by a fixed horizon. The design focuses on readable structure, conservative confirmation, and actionable context rather than raw oscillator flips.
Motivation: Why this design?
Classical RSI signals flip frequently in volatile phases and drift in calm regimes. Pure threshold rules often misclassify shallow pullbacks and stacked momentum phases. The core idea here is ordered, spaced RSI layers combined with outcome tracking. By requiring a consistent order with a tolerance and optionally gating by the midline, regime identification becomes clearer. A horizon-based maturation check and smoothed win-rate estimate provide pragmatic feedback about how often a given stack has recently worked.
What’s different vs. standard approaches?
Reference baseline: Traditional single-length RSI with overbought and oversold rules or simple crossovers.
Architecture differences:
Four fixed RSI lengths with strict ordering and a spacing tolerance.
Optional requirement that all RSI values stay above or below the midline for bull or bear regimes.
Outcome evaluation after a fixed horizon, then rolling counts and a prior-smoothed win rate.
Dispersion measurement across the four RSIs with a percent-rank diagnostic.
Gradient coloring of candles and wicks driven by stack magnitude.
A last-bar statistics table with counts, wins, win rate, dispersion, and priors.
Practical effect: Charts emphasize sustained momentum alignment instead of single-length crosses. Users see when regimes start, how strong alignment is, and how that regime has recently performed for the chosen horizon.
How it works (technical)
The script computes RSI on four lengths and forms a “stack” when they are strictly ordered with at least the chosen tolerance between adjacent lengths. A bull stack requires a descending set from long to short with positive spacing. A bear stack requires the opposite. Optional gating further requires all RSI values to sit above or below the midline.
For evaluation, each detected stack is checked again after the horizon has fully elapsed. A bull event is a success if price is higher than it was at event time after the horizon has passed. A bear event succeeds if price is lower under the same rule. Rolling sums over the training window track counts and successes; a pair of priors stabilizes the win-rate estimate when sample sizes are small.
Dispersion across the four RSIs is measured and converted to a percent rank over a configurable window. Gradients for bars and wicks are normalized over a lookback, then shaped by gamma controls to emphasize strong regimes. A statistics table is created once and updated on the last bar to minimize overhead. Overlay markers and wick coloring are rendered to the price chart even though the indicator runs in a separate pane.
Parameter Guide
Source — Input series for RSI. Default: close. Tips: Use typical price or hlc3 for smoother behavior.
Overbought / Oversold — Guide levels for context. Defaults: seventy and thirty. Bounds: fifty to one hundred, zero to fifty. Tips: Narrow the band for faster feedback.
Stacking tolerance (epsilon) — Minimum spacing between adjacent RSIs to qualify as a stack. Default: zero point twenty-five RSI points. Trade-off: Higher values reduce false stacks but delay entries.
Horizon H — Bars ahead for outcome evaluation. Default: three. Trade-off: Longer horizons reduce noise but delay success attribution.
Rolling window — Lookback for counts and wins. Default: five hundred. Trade-off: Longer windows stabilize the win rate but adapt more slowly.
Alpha prior / Beta prior — Priors used to stabilize the win-rate estimate. Defaults: one and one. Trade-off: Larger priors reduce variance with sparse samples.
Show RSI 8/13/21/34 — Toggle raw RSI lines. Default: on.
Show consensus RSI — Weighted combination of the four RSIs. Default: on.
Show OB/OS zones — Draw overbought, oversold, and midline. Default: on.
Background regime — Pane background tint during bull or bear stacks. Default: on.
Overlay regime markers — Entry markers on price when a stack forms. Default: on.
Show statistics table — Last-bar table with counts, wins, win rate, dispersion, priors, and window. Default: on.
Bull requires all above fifty / Bear requires all below fifty — Midline gate. Defaults: both on. Trade-off: Stricter regimes, fewer but cleaner signals.
Enable gradient barcolor / wick coloring — Gradient visuals mapped to stack magnitude. Defaults: on. Trade-off: Clearer regime strength vs. extra rendering cost.
Collection period — Normalization window for gradients. Default: one hundred. Trade-off: Shorter values react faster but fluctuate more.
Gamma bars and shapes / Gamma plots — Curve shaping for gradients. Defaults: zero point seven and zero point eight. Trade-off: Higher values compress weak signals and emphasize strong ones.
Gradient and wick transparency — Visual opacity controls. Defaults: zero.
Up/Down colors (dark and neon) — Gradient endpoints. Defaults: green and red pairs.
Fallback neutral candles — Directional coloring when gradients are off. Default: off.
Show last candles — Limit for gradient squares rendering. Default: three hundred thirty-three.
Dispersion percent-rank length / High and Low thresholds — Window and cutoffs for dispersion diagnostics. Defaults: two hundred fifty, eighty, and twenty.
Table X/Y, Dark theme, Text size — Table anchor, theme, and typography. Defaults: right, top, dark, small.
Reading & Interpretation
RSI stack lines: Alignment and spacing convey regime quality. Wider spacing suggests stronger alignment.
Consensus RSI: A single line that summarizes the four lengths; use as a smoother reference.
Zones: Overbought, oversold, and midline provide context rather than standalone triggers.
Background tint: Indicates active bull or bear stack.
Markers: “Bull Stack Enter” or “Bear Stack Enter” appears when the stack first forms.
Gradients: Brighter tones suggest stronger stack magnitude; dull tones suggest weak alignment.
Table: Count and Wins show sample size and successes over the window. P(win) is a prior-stabilized estimate. Dispersion percent rank near the high threshold flags stretched alignment; near the low threshold flags tight clustering.
Practical Workflows & Combinations
Trend following: Enter only on new stack markers aligned with structure such as higher highs and higher lows for bull, or lower lows and lower highs for bear. Use the consensus RSI to avoid chasing into overbought or oversold extremes.
Exits and stops: Consider reducing exposure when dispersion percent rank reaches the high threshold or when the stack loses ordering. Use the table’s P(win) as a context check rather than a direct signal.
Multi-asset and multi-timeframe: Defaults travel well on liquid assets from intraday to daily. Combine with higher-timeframe structure or moving averages for regime confirmation. The script itself does not fetch higher-timeframe data.
Behavior, Constraints & Performance
Repaint and confirmation: Stack markers evaluate on the live bar and can flip until close. Alert behavior follows TradingView settings. Outcome evaluation uses matured events and does not look into the future.
HTF and security: Not used. Repaint paths from higher-timeframe aggregation are avoided by design.
Resources: max bars back is two thousand. The script uses rolling sums, percent rank, gradient rendering, and a last-bar table update. Shapes and colored wicks add draw overhead.
Known limits: Lag can appear after sharp turns. Very small windows can overfit recent noise. P(win) is sensitive to sample size and priors. Dispersion normalization depends on the collection period.
Sensible Defaults & Quick Tuning
Start with the shipped defaults.
Too many flips: Increase stacking tolerance, enable midline gates, or lengthen the collection period.
Too sluggish: Reduce stacking tolerance, shorten the collection period, or relax midline gates.
Sparse samples: Extend the rolling window or increase priors to stabilize P(win).
Visual overload: Disable gradient squares or wick coloring, or raise transparency.
What this indicator is—and isn’t
This is a visualization and context layer for RSI stack regimes with simple outcome statistics. It is not a complete trading system, not predictive, and not a signal generator on its own. Use it with market structure, risk controls, and position management that fit your process.
Metadata
- Pine version: v6
- Overlay: false (price overlays are drawn via forced overlay where applicable)
- Primary outputs: Four RSI lines, consensus line, OB/OS guides, background tint, entry markers, gradient bars and wicks, statistics table
- Inputs with defaults: See Parameter Guide
- Metrics and functions used: RSI, rolling sums, percent rank, dispersion across RSI set, gradient color mapping, table rendering, alerts
- Special techniques: Ordered RSI stacking with tolerance, optional midline gating, horizon-based outcome maturation, prior-stabilized win rate, gradient normalization with gamma shaping
- Performance and constraints: max bars back two thousand, rendering of shapes and table on last bar, no higher-timeframe data, no security calls
- Recommended use-cases: Regime confirmation, momentum alignment, post-entry management with dispersion and recent outcome context
- Compatibility: Works across assets and timeframes that support RSI
- Limitations and risks: Sensitive to parameter choices and market regime changes; not a standalone strategy
- Diagnostics: Statistics table, dispersion percent rank, gradient intensity
Disclaimer
The content provided, including all code and materials, is strictly for educational and informational purposes only. It is not intended as, and should not be interpreted as, financial advice, a recommendation to buy or sell any financial instrument, or an offer of any financial product or service. All strategies, tools, and examples discussed are provided for illustrative purposes to demonstrate coding techniques and the functionality of Pine Script within a trading context.
Any results from strategies or tools provided are hypothetical, and past performance is not indicative of future results. Trading and investing involve high risk, including the potential loss of principal, and may not be suitable for all individuals. Before making any trading decisions, please consult with a qualified financial professional to understand the risks involved.
By using this script, you acknowledge and agree that any trading decisions are made solely at your discretion and risk.
Best regards and happy trading
Chervolino.
Do not use this indicator on Heikin-Ashi, Renko, Kagi, Point-and-Figure, or Range charts, as these chart types can produce unrealistic results for signal markers and alerts.

Reversal IndicatorWhat does this indicator do?
This indicator is designed to help traders spot potential reversal points in the market by combining multiple conditions:
✅ Multi-Timeframe RSI – Checks RSI on a lower timeframe (like 5m) to see if the market is oversold or overbought.
✅ Higher Timeframe SMA Filter – Uses a higher timeframe SMA (like 1h) as a trend filter, so signals only trigger in the direction of the bigger trend.
✅ Candle Pattern Confirmation – Looks for bullish or bearish engulfing candles to confirm price exhaustion before signaling a reversal.
When all these conditions align, the indicator plots a triangle under/above the candle to highlight a possible reversal.
Why is this useful?
Many traders struggle with false RSI signals or candle patterns that fail because they don’t respect the larger trend.
This indicator filters out weak setups by requiring alignment between:
A lower timeframe RSI oversold/overbought condition,
A higher timeframe trend filter (SMA),
And a strong candle reversal pattern.
This multi-layer approach helps avoid chasing every RSI dip and focuses only on high-probability reversal zones.
How does it work?
Bullish reversal signal → appears when RSI on the lower TF is oversold, price is still above the higher TF SMA (trend still intact), AND a bullish engulfing candle forms.
Bearish reversal signal → appears when RSI on the lower TF is overbought, price is below the higher TF SMA, AND a bearish engulfing candle forms.
When all conditions match, the indicator plots a triangle under the candle for bullish signals and above the candle for bearish signals.
How to use it?
Choose your timeframes:
A timeframe for trend filtering (e.g. 1h).
A timeframe for RSI (e.g. 4h).
NOTICE: THE RSI TIMEFRAME SHOULD BE GREATER THEN THE TIMEFRAME FOR THE SMA
Otherwise it will not generate that much signals.
Watch for signals ONLY in the direction of the higher trend.
Use the signals as potential reversal points, not as guaranteed entries. Combine with your own confluence.
Optionally set alerts for bullish or bearish reversal conditions so you never miss a setup.
Customization
✅ Choose your RSI length & overbought/oversold levels.
✅ Select which timeframes you want for SMA & RSI.
✅ Toggle the higher TF SMA display on/off.
✅ Adjust signal appearance (triangles).
Important Notes
⚠️ This is not a standalone trading system. It’s a tool to help spot possible reversal areas. Always confirm with price action, support/resistance, or your own strategy

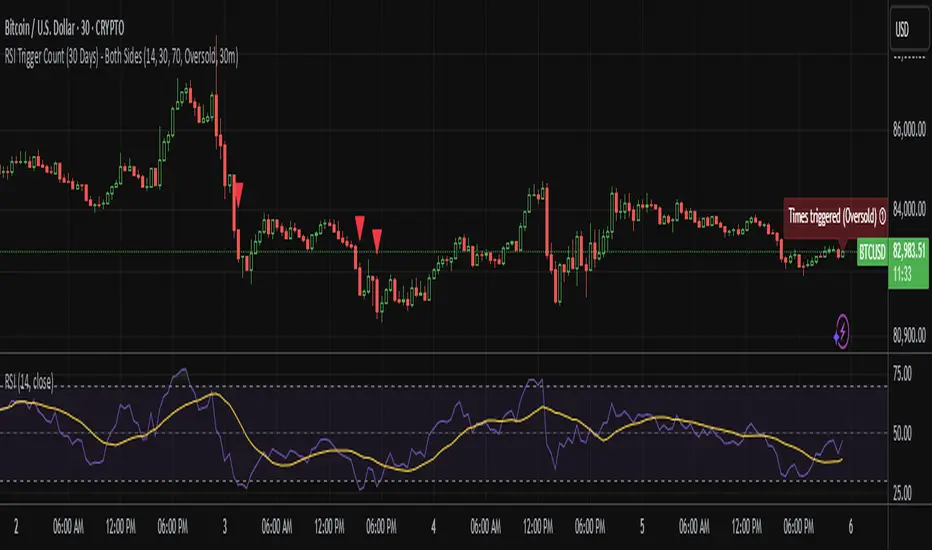
RSI Trigger Count (30 Days) - Both SidesRSI Dual Trigger Counter (30 Days)
This indicator tracks both oversold ( crossunder ) and overbought ( crossover ) RSI events on a 30-minute chart, featuring:
Dual-Mode Selector:
Counts either RSI < 30 (oversold) or RSI > 70 (overbought) crossings
Toggle between modes via input menu
30-Day Rolling Count:
Displays total triggers in the last 30 days (e.g., "Times triggered (Oversold) ① 19")
Visual Alerts:
Red triangles ↓ for oversold crossunders
Green triangles ↑ for overbought crossovers
Customizable:
Adjustable RSI length (2-100) and thresholds (1-100)
Works on any timeframe (auto-scales calculations)
Purpose: Identifies frequent reversal signals for both buying dips (oversold) and selling rallies (overbought).
RSI BB StdDev SignalOverview
The RSI BB StdDev Signal Indicator is a powerful tool designed to enhance your trading strategy by combining the Relative Strength Index (RSI) with Bollinger Bands (BB). This unique combination allows traders to identify potential buy and sell signals more accurately by leveraging the strengths of both indicators. The RSI helps in identifying overbought and oversold conditions, while the Bollinger Bands provide a dynamic range to assess volatility and potential price reversals.
Key Features
— RSI Calculation: The indicator calculates the RSI based on user-defined parameters, allowing for customization to fit different trading styles.
— Bollinger Bands Integration: The RSI values are smoothed using a moving average, and Bollinger Bands are applied to this smoothed RSI to generate buy and sell signals.
— Divergence Detection: The indicator includes an optional feature to detect and alert on bullish and bearish divergences between the RSI and price action.
— Customizable Alerts: Users can set up alerts for buy and sell signals, as well as for divergences, ensuring they never miss a trading opportunity.
— Visual Aids: The indicator plots the RSI, Bollinger Bands, and signals on the chart, making it easy to visualize and interpret the data.
How It Works
1. RSI Calculation:
— The RSI is calculated using the change in the source input (default is close price) over a specified period.
— The RSI values are then plotted on the chart with customizable overbought and oversold levels.
2. Smoothing and Bollinger Bands:
— The RSI values are smoothed using a moving average (SMA, EMA, SMMA, WMA, VWMA) selected by the user.
— Bollinger Bands are applied to the smoothed RSI to create dynamic upper and lower bands.
3. Signal Generation:
—Buy signals are generated when the RSI crosses above the lower Bollinger Band.
—Sell signals are generated when the RSI crosses below the upper Bollinger Band.
—These signals are plotted on both the RSI pane and the main price chart for easy reference.
4. Divergence Detection:
— The indicator can detect and alert on regular bullish and bearish divergences between the RSI and price action.
— Bullish divergences occur when the price makes a lower low, but the RSI makes a higher low.
— Bearish divergences occur when the price makes a higher high, but the RSI makes a lower high.
Usage
1. Setting Up:
— Add the indicator to your TradingView chart.
— Customize the RSI length, source, and other parameters in the settings panel.
— Enable or disable the divergence detection based on your trading strategy.
2. Interpreting Signals:
— Use the buy and sell signals generated by the RSI crossing the Bollinger Bands as potential entry and exit points.
— Pay attention to divergences for additional confirmation of trend reversals.
3. Alerts:
— Set up alerts for buy and sell signals to receive notifications in real-time.
— Enable divergence alerts to be notified of potential trend reversals.
Conclusion
The RSI BB StdDev Signal Indicator is a comprehensive tool that combines the strengths of the RSI and Bollinger Bands to provide traders with more accurate and reliable signals. Whether you are a beginner or an experienced trader, this indicator can enhance your trading strategy by offering clear visual cues and customizable alerts.
Note
This indicator is provided with open-source code, allowing users to understand its logic and customize it further if needed. The detailed description and customizable settings ensure that traders of all levels can benefit from its unique features.
