TDZZ ETH 15min Vault: No-Loss Martin Gale StrategyStrategy Overview
The ETH 15min Vault is an enhanced, high-frequency Martin Gale strategy designed specifically for Ethereum on the 15-minute chart. Its core innovation lies in integrating pre-calculated margin management with a multi-layer exit system, transforming the traditional high-risk Martingale approach into a controlled, calculated growth engine. The strategy aims for sustainable compound growth of small capitals (e.g., 1000U) in ranging markets while systematically eliminating the risk of account blow-up.
Core Concept: The "No-Loss" Guarantee
Unlike conventional Martingale systems that risk infinite losses, this strategy pre-calculates and logically reserves the total margin required for all potential layers (configurable, e.g., up to 30) at the initial entry. This ensures sufficient capital is always available for the next averaging order, preventing liquidation due to margin shortage. Combined with intelligent, proactive take-profit and safety-net closures, it creates a theoretically "No-Loss" framework for the Martin Gale method.
Key Mechanisms
1、Smart Position Averaging:
Averaging distances expand geometrically (configurable multiplier), preventing rapid layer depletion during sharp drops.
Averaging order size increases progressively (configurable multiplier) to effectively lower the break-even point.
2、Dynamic Multi-Stage Exit Logic:
Rebound TP: Partially closes a position when price rebounds a certain percentage from its entry, locking in profits early during oscillations.
Cycle TP: Closes the remaining position upon reaching the primary profit target, which is dynamically recalculated after each average to reflect the new aggregate cost.
Safety-Net Close (Defense Mode): Activates after a defined number of averages. Triggers a full exit if price: a) rallies significantly from the lowest point, b) retraces from a recent high, or c) fails to make a new low within a set time. This forms the final protective layer for capital preservation.
Main Advantages
✅ True Risk Isolation: Transforms Martingale's "unlimited risk" into a "defined and manageable drawdown" via pre-calculated margins and safety-net exits.
✅ Active Profit Capture: The "Rebound TP" mechanism increases win rate and capital efficiency in ranging markets.
✅ Adaptive to Volatility: Adjustable parameters for averaging distance and size allow tuning for different market conditions.
✅ High-Frequency Compounding Potential: Operates on the 15-min timeframe, offering numerous opportunities to complete profit cycles in consolidating phases.
Configuration & Parameters
Key adjustable inputs include: Initial Capital %, Averaging Distance % and Multiplier, Order Size Multiplier, Max Layers, Take-Profit %, Rebound Close %, and all Defense Mode thresholds.
This strategy significantly reduces liquidation risk through its design but does not eliminate trading risk. Substantial drawdowns can occur during strong, sustained trends. "No-Loss" refers to prevention of margin-call liquidation, not guaranteed profitability. Always conduct thorough backtesting and forward testing in a simulated environment before committing real capital. Past performance is not indicative of future results. Trade responsibly.
Risk!!!

ALT Risk Metric StrategyHere's a professional write-up for your ALT Risk Strategy script:
ALT/BTC Risk Strategy - Multi-Crypto DCA with Bitcoin Correlation Analysis
Overview
This strategy uses Bitcoin correlation as a risk indicator to time entries and exits for altcoins. By analyzing how your chosen altcoin performs relative to Bitcoin, the strategy identifies optimal accumulation periods (when alt/BTC is oversold) and profit-taking opportunities (when alt/BTC is overbought). Perfect for traders who want to outperform Bitcoin by strategically timing altcoin positions.
Key Innovation: Why Alt/BTC Matters
Most traders focus solely on USD price, but Alt/BTC ratios reveal true altcoin strength:
When Alt/BTC is low → Altcoin is undervalued relative to Bitcoin (buy opportunity)
When Alt/BTC is high → Altcoin has outperformed Bitcoin (take profits)
This approach captures the rotation between BTC and alts that drives crypto cycles
Key Features
📊 Advanced Technical Analysis
RSI (60% weight): Primary momentum indicator on weekly timeframe
Long-term MA Deviation (35% weight): Measures distance from 150-period baseline
MACD (5% weight): Minor confirmation signal
EMA Smoothing: Filters noise while maintaining responsiveness
All calculations performed on Alt/BTC pairs for superior market timing
💰 3-Tier DCA System
Level 1 (Risk ≤ 70): Conservative entry, base allocation
Level 2 (Risk ≤ 50): Increased allocation, strong opportunity
Level 3 (Risk ≤ 30): Maximum allocation, extreme undervaluation
Continuous buying: Executes every bar while below threshold for true DCA behavior
Cumulative sizing: L3 triggers = L1 + L2 + L3 amounts combined
📈 Smart Profit Management
Sequential selling: Must complete L1 before L2, L2 before L3
Percentage-based exits: Sell portions of position, not fixed amounts
Auto-reset on re-entry: New buy signals reset sell progression
Prevents premature full exits during volatile conditions
🤖 3Commas Automation
Pre-configured JSON webhooks for Custom Signal Bots
Multi-exchange support: Binance, Coinbase, Kraken, Bitfinex, Bybit
Flexible quote currency: USD, USDT, or BUSD
Dynamic order sizing: Automatically adjusts to your tier thresholds
Full webhook documentation compliance
🎨 Multi-Asset Support
Pre-configured for popular altcoins:
ETH (Ethereum)
SOL (Solana)
ADA (Cardano)
LINK (Chainlink)
UNI (Uniswap)
XRP (Ripple)
DOGE
RENDER
Custom option for any other crypto
How It Works
Risk Metric Calculation (0-100 scale):
Fetches weekly Alt/BTC price data for stability
Calculates RSI, MACD, and deviation from 150-period MA
Normalizes MACD to 0-100 range using 500-bar lookback
Combines weighted components: (MACD × 0.05) + (RSI × 0.60) + (Deviation × 0.35)
Applies 5-period EMA smoothing for cleaner signals
Color-Coded Risk Zones:
Green (0-30): Extreme buying opportunity - Alt heavily oversold vs BTC
Lime/Yellow (30-70): Accumulation range - favorable risk/reward
Orange (70-85): Caution zone - consider taking initial profits
Red/Maroon (85-100+): Euphoria zone - aggressive profit-taking
Entry Logic:
Buys execute every candle when risk is below threshold
As risk decreases, position sizing automatically scales up
Example: If risk drops from 60→25, you'll be buying at L1 rate until it hits 50, then L2 rate, then L3 rate
Exit Logic:
Sells only trigger when in profit AND risk exceeds thresholds
Sequential execution ensures partial profit-taking
If new buy signal occurs before all sells complete, sell levels reset to L1
Configuration Guide
Choosing Your Altcoin:
Select crypto from dropdown (or use CUSTOM for unlisted coins)
Pick your exchange
Choose quote currency (USD, USDT, BUSD)
Risk Metric Tuning:
Long Term MA (default 150): Higher = more extreme signals, Lower = more frequent
RSI Length (default 10): Lower = more volatile, Higher = smoother
Smoothing (default 5): Increase for less noise, decrease for faster reaction
Buy Settings (Aggressive DCA Example):
L1 Threshold: 70 | Amount: $5
L2 Threshold: 50 | Amount: $6
L3 Threshold: 30 | Amount: $7
Total L3 buy = $18 per candle when deeply oversold
Sell Settings (Balanced Exit Example):
L1: 70 threshold, 25% position
L2: 85 threshold, 35% position
L3: 100 threshold, 40% position (final exit)
3Commas Setup
Bot Configuration:
Create Custom Signal Bot in 3Commas
Set trading pair to your altcoin/USD (e.g., ETH/USD, SOL/USDT)
Order size: Select "Send in webhook, quote" to use strategy's dollar amounts
Copy Bot UUID and Secret Token
Script Configuration:
Paste credentials into 3Commas section inputs
Check "Enable 3Commas Alerts"
Save and apply to chart
TradingView Alert:
Create Alert → Condition: "alert() function calls only"
Webhook URL: api.3commas.io
Enable "Webhook URL" checkbox
Expiration: Open-ended
Strategy Advantages
✅ Outperform Bitcoin: Designed specifically to beat BTC by timing alt rotations
✅ Capture Alt Seasons: Automatically accumulates when alts lag, sells when they pump
✅ Risk-Adjusted Sizing: Buys more when cheaper (better risk/reward)
✅ Emotional Discipline: Systematic approach removes fear and FOMO
✅ Multi-Asset: Run same strategy across multiple altcoins simultaneously
✅ Proven Indicators: Combines RSI, MACD, and MA deviation - battle-tested tools
Backtesting Insights
Optimal Timeframes:
Daily chart: Best for backtesting and signal generation
Weekly data is fetched internally regardless of display timeframe
Historical Performance Characteristics:
Accumulates heavily during bear markets and BTC dominance periods
Captures explosive altcoin rallies when BTC stagnates
Sequential selling preserves capital during extended downtrends
Works best on established altcoins with multi-year history
Risk Considerations:
Requires capital reserves for extended accumulation periods
Some altcoins may never recover if fundamentals deteriorate
Past correlation patterns may not predict future performance
Always size positions according to personal risk tolerance
Visual Interface
Indicator Panel Displays:
Dynamic color line: Green→Lime→Yellow→Orange→Red as risk increases
Horizontal threshold lines: Dashed lines mark your buy/sell levels
Entry/Exit labels: Green labels for buys, Orange/Red/Maroon for sells
Real-time risk value: Numerical display on price scale
Customization:
All threshold lines are adjustable via inputs
Color scheme clearly differentiates buy zones (green spectrum) from sell zones (red spectrum)
Line weights emphasize most extreme thresholds (L3 buy and L3 sell)
Strategy Philosophy
This strategy is built on the principle that altcoins move in cycles relative to Bitcoin. During Bitcoin rallies, alts often bleed against BTC (high sell, accumulate). When Bitcoin consolidates, alts pump (take profits). By measuring risk on the Alt/BTC chart instead of USD price, we time these rotations with precision.
The 3-tier system ensures you're always averaging in at better prices and scaling out at better prices, maximizing your Bitcoin-denominated returns.
Advanced Tips
Multi-Bot Strategy:
Run this on 5-10 different altcoins simultaneously to:
Diversify correlation risk
Capture whichever alt is pumping
Smooth equity curve through rotation
Pairing with BTC Strategy:
Use alongside the BTC DCA Risk Strategy for complete portfolio coverage:
BTC strategy for core holdings
ALT strategies for alpha generation
Rebalance between them based on BTC dominance
Threshold Calibration:
Check 2-3 years of historical data for your chosen alt
Note where risk metric sat during major bottoms (set buy thresholds)
Note where it peaked during euphoria (set sell thresholds)
Adjust for your risk tolerance and holding period
Credits
Strategy Development & 3Commas Integration: Claude AI (Anthropic)
Technical Analysis Framework: RSI, MACD, Moving Average theory
Implementation: pommesUNDwurst
Disclaimer
This strategy is for educational purposes only. Cryptocurrency trading involves substantial risk of loss. Altcoins are especially volatile and many fail completely. The strategy assumes liquid markets and reliable Alt/BTC price data. Always do your own research, understand the fundamentals of any asset you trade, and never risk more than you can afford to lose. Past performance does not guarantee future results. The authors are not financial advisors and assume no liability for trading decisions.
Additional Warning: Using leverage or trading illiquid altcoins amplifies risk significantly. This strategy is designed for spot trading of established cryptocurrencies with deep liquidity.
Tags: Altcoin, Alt/BTC, DCA, Risk Metric, Dollar Cost Averaging, 3Commas, ETH, SOL, Crypto Rotation, Bitcoin Correlation, Automated Trading, Alt Season
Feel free to modify any sections to better match your style or add specific backtesting results you've observed! 🚀Claude is AI and can make mistakes. Please double-check responses. Sonnet 4.5

BTC DCA Risk Metric StrategyBTC DCA Risk Strategy - Automated Dollar Cost Averaging with 3Commas Integration
Overview
This strategy combines the proven Oakley Wood Risk Metric with an intelligent tiered Dollar Cost Averaging (DCA) system, designed to help traders systematically accumulate Bitcoin during periods of low risk and take profits during high-risk conditions.
Key Features
📊 Multi-Component Risk Assessment
4-Year SMA Deviation: Measures Bitcoin's distance from its long-term mean
20-Week MA Analysis: Tracks medium-term momentum shifts
50-Day/50-Week MA Ratio: Captures short-to-medium term trend strength
All metrics are normalized by time to account for Bitcoin's maturing market dynamics
💰 3-Tier DCA Buy System
Level 1 (Low Risk): Conservative entry with base allocation
Level 2 (Lower Risk): Increased allocation as opportunity improves
Level 3 (Extreme Low Risk): Maximum allocation during rare buying opportunities
Buys execute every bar while risk remains below thresholds, enabling true DCA accumulation
📈 Progressive Profit Taking
Sell Level 1: Take initial profits as risk increases
Sell Level 2: Scale out further positions during elevated risk
Sell Level 3: Final exit during extreme market conditions
Sell levels automatically reset when new buy signals occur, allowing flexible re-entry
🤖 3Commas Integration
Fully automated webhook alerts for Custom Signal Bots
JSON payloads formatted per 3Commas API specifications
Supports multiple exchanges (Binance, Coinbase, Kraken, Gemini, Bybit)
Configurable quote currency (USD, USDT, BUSD)
How It Works
The strategy calculates a composite risk metric (0-1 scale):
0.0-0.2: Extreme buying opportunity (green zone)
0.2-0.5: Favorable accumulation range (yellow zone)
0.5-0.8: Neutral to cautious territory (orange zone)
0.8-1.0+: High risk, profit-taking zone (red zone)
Buy Logic: As risk decreases, position sizes increase automatically. If risk drops from L1 to L3 threshold, the strategy combines all three tier allocations for maximum exposure.
Sell Logic: Sequential profit-taking ensures you capture gains progressively. The system won't advance to Sell L2 until L1 completes, preventing premature full exits.
Configuration
Risk Metric Parameters:
All calculations use Bitcoin price data (any BTC chart works)
Time-normalized formulas adapt to market maturity
No manual parameter tuning required
Buy Settings:
Set risk thresholds for each tier (default: 0.20, 0.10, 0.00)
Define dollar amounts per tier (default: $10, $15, $20)
Fully customizable to your risk tolerance and capital
Sell Settings:
Configure risk thresholds for profit-taking (default: 1.00, 1.50, 2.00)
Set percentage of position to sell at each level (default: 25%, 35%, 40%)
3Commas Setup:
Create a Custom Signal Bot in 3Commas
Copy Bot UUID and Secret Token into strategy inputs
Enable 3Commas Alerts checkbox
Create TradingView alert: Condition → "alert() function calls only", Webhook → api.3commas.io
Backtesting Results
Strengths:
Systematically buys dips without emotion
Averages down during extended bear markets
Captures explosive bull run profits through tiered exits
Pyramiding (1000 max orders) allows true DCA behavior
Considerations:
Requires sufficient capital for multiple buys during prolonged downtrends
Backtest on Daily timeframe for most reliable signals
Past performance does not guarantee future results
Visual Design
The indicator pane displays:
Color-coded risk metric line: Changes from white→red→orange→yellow→green as risk decreases
Background zones: Green (buy), yellow (hold), red (sell) areas
Dashed threshold lines: Clear visual markers for each buy/sell level
Entry/Exit labels: Green buy labels and orange/red sell labels mark all trades
Credits
Original Risk Metric: Oakley Wood
Strategy Development & 3Commas Integration: Claude AI (Anthropic)
Modifications: pommesUNDwurst
Disclaimer
This strategy is for educational and informational purposes only. Cryptocurrency trading carries substantial risk of loss. Always conduct your own research and never invest more than you can afford to lose. The authors are not financial advisors and assume no responsibility for trading decisions made using this tool.

Hash Ratings EngineHash Ratings Engine - Technical Consensus Strategy
A systematic trading strategy that harnesses TradingView's Technical Ratings to generate high-conviction entries with institutional-grade risk management.
What It Does
This strategy aggregates the consensus of 26+ technical indicators (RSI, MACD, Stochastics, multiple Moving Averages, etc.) into a single actionable signal. When enough indicators align bullish or bearish, the engine triggers an entry. Built-in trend filtering and ATR-based exits keep you on the right side of the market.
Key Features
Trend Filter - Only takes longs in uptrends, shorts in downtrends. This single filter typically improves results by 20-40% by avoiding counter-trend trades.
ATR-Based Risk Management - Stop loss and trailing stops adapt to current market volatility. Tight stops in calm markets, wider stops in volatile conditions.
Cooldown System - After a losing trade, the strategy waits before re-entering. This prevents the consecutive loss streaks that destroy accounts.
Clean Visuals - Fluorescent entry/exit signals with price level references. See exactly where you got in and out.
Settings Guide
Indicator Timeframe: Leave blank for current chart. Use higher timeframe for fewer, higher-quality signals.
Rating Source: "All" for balanced approach. "MAs" for trend-following. "Oscillators" for mean-reversion.
Entry Thresholds
Strong Signal Threshold: Higher = fewer trades but better conviction. Start at 0.5, test 0.4-0.6.
Risk Management
ATR Period: 12 is responsive, 14 is standard, 20+ is smoother.
Stop Loss: 2-3x ATR for tight stops, 3.5-4x for moderate, 5x+ for wide.
Trail Activation: How far price must move in profit before trailing begins.
Trail Offset: How closely the trail follows price.
Trend Filter
EMA Length: 150 works well on 4H charts. Use 100 for lower timeframes, 200 for daily.
Trade Timing
Cooldown: Keep enabled. 5 bars is a good starting point.
Best Practices
Start with default settings and backtest on your preferred instrument. Adjust the Strong Signal Threshold first - this has the biggest impact on trade frequency. Then tune the EMA length to match your timeframe. Finally, optimize the ATR multipliers for your risk tolerance.
Works on any liquid market - crypto, forex, stocks, futures. Higher timeframes (4H, Daily) tend to produce cleaner signals than lower timeframes.
Disclaimer
Past performance does not guarantee future results. Always backtest thoroughly and use proper position sizing. This strategy is for educational purposes - trade at your own risk.

XAU BUY/SELL Scalping Strategy M5 PROFX:XAUUSD
This XAU/USD Pro Scalping Strategy is tailored specifically for the M5 timeframe , designed to capture rapid Gold price movements. Instead of relying on lagging indicators, this system utilizes advanced Price Action and Market Structure analysis to identify high-probability entry zones.
The core strength of this strategy lies in its built-in Money Management engine and Multi-threaded Trailing Stop system, ensuring capital preservation and profit maximization.
🚀 Key Features:
1. Smart Price Action Recognition:
The algorithm scans for specific market scenarios to apply dynamic Risk:Reward ratios (ranging from 1:1 to 1:3).
Filters out noise and false breakouts using multi-candle analysis.
Auto Position Sizing:
Calculates trade quantity automatically based on your defined Risk % per Trade .
Ensures consistent risk management regardless of the Stop Loss distance.
Intelligent Trailing Stop:
Uses a dynamic trailing mechanism based on "R" multiples (Risk Units).
Automatically secures profits by moving SL based on the specific setup type ("Case") of each trade.
Safety Filters:
Min SL and Max SL inputs prevent trades during periods of extremely low volatility or excessive risk.
⚙️ Settings:
Risk % per Trade: The percentage of equity to risk per trade (Recommended: 1.0% - 2.0%).
Min/Max SL Points: Dynamic boundaries for Stop Loss to adapt to current market volatility.
💡 Recommendations:
Symbol: XAUUSD / Gold - FXCM.
Timeframe: M5.
Best performance during London and New York sessions.

Stochastic Hash Strat [Hash Capital Research]# Stochastic Hash Strategy by Hash Capital Research
## 🎯 What Is This Strategy?
The **Stochastic Slow Strategy** is a momentum-based trading system that identifies oversold and overbought market conditions to capture mean-reversion opportunities. Think of it as a "buy low, sell high" approach with smart mathematical filters that remove emotion from your trading decisions.
Unlike fast-moving indicators that generate excessive noise, this strategy uses **smoothed stochastic oscillators** to identify only the highest-probability setups when momentum truly shifts.
---
## 💡 Why This Strategy Works
Most traders fail because they:
- **Chase prices** after big moves (buying high, selling low)
- **Overtrade** in choppy, directionless markets
- **Exit too early** or hold losses too long
This strategy solves all three problems:
1. **Entry Discipline**: Only trades when the stochastic oscillator crosses in extreme zones (oversold for longs, overbought for shorts)
2. **Cooldown Filter**: Prevents revenge trading by forcing a waiting period after each trade
3. **Fixed Risk/Reward**: Pre-defined stop-loss and take-profit levels ensure consistent risk management
**The Math Behind It**: The stochastic oscillator measures where the current price sits relative to its recent high-low range. When it's below 25, the market is oversold (time to buy). When above 70, it's overbought (time to sell). The crossover with its moving average confirms momentum is shifting.
---
## 📊 Best Markets & Timeframes
### ⭐ OPTIMAL PERFORMANCE:
**Crude Oil (WTI) - 12H Timeframe**
- **Why it works**: Oil markets have predictable volatility patterns and respect technical levels
**AAVE/USD - 4H to 12H Timeframe**
- **Why it works**: DeFi tokens exhibit strong momentum cycles with clear extremes
### ✅ Also Works Well On:
- **BTC/USD** (12H, Daily) - Lower frequency but high win rate
- **ETH/USD** (8H, 12H) - Balanced volatility and liquidity
- **Gold (XAU/USD)** (Daily) - Classic mean-reversion asset
- **EUR/USD** (4H, 8H) - Lower volatility, requires patience
### ❌ Avoid Using On:
- Timeframes below 4H (too much noise)
- Low-liquidity altcoins (wide spreads kill performance)
- Strongly trending markets without pullbacks (Bitcoin in 2021)
- News-driven instruments during major events
---
## 🎛️ Understanding The Settings
### Core Stochastic Parameters
**Stochastic Length (Default: 16)**
- Controls the lookback period for price comparison
- Lower = faster reactions, more signals (10-14 for volatile markets)
- Higher = smoother signals, fewer trades (16-21 for stable markets)
- **Pro tip**: Use 10 for crypto 4H, 16 for commodities 12H
**Overbought Level (Default: 70)**
- Threshold for short entries
- Lower values (65-70) = more trades, earlier entries
- Higher values (75-80) = fewer but higher-conviction trades
- **Sweet spot**: 70 works for most assets
**Oversold Level (Default: 25)**
- Threshold for long entries
- Higher values (25-30) = more trades, earlier entries
- Lower values (15-20) = fewer but stronger bounce setups
- **Sweet spot**: 20-25 depending on market conditions
**Smooth K & Smooth D (Default: 7 & 3)**
- Additional smoothing to filter out whipsaws
- K=7 makes the indicator slower and more reliable
- D=3 is the signal line that confirms the trend
- **Don't change these unless you know what you're doing**
---
### Risk Management
**Stop Loss % (Default: 2.2%)**
- Automatically exits losing trades
- Should be 1.5x to 2x your average market volatility
- Too tight = death by a thousand cuts
- Too wide = uncontrolled losses
- **Calibration**: Check ATR indicator and set SL slightly above it
**Take Profit % (Default: 7%)**
- Automatically exits winning trades
- Should be 2.5x to 3x your stop loss (reward-to-risk ratio)
- This default gives 7% / 2.2% = 3.18:1 R:R
- **The golden rule**: Never have R:R below 2:1
---
### Trade Filters
**Bar Cooldown Filter (Default: ON, 3 bars)**
- **What it does**: Forces you to wait X bars after closing a trade before entering a new one
- **Why it matters**: Prevents emotional revenge trading and overtrading in choppy markets
- **Settings guide**:
- 3 bars = Standard (good for most cases)
- 5-7 bars = Conservative (oil, slow-moving assets)
- 1-2 bars = Aggressive (only for experienced traders)
**Exit on Opposite Extreme (Default: ON)**
- Closes your long when stochastic hits overbought (and vice versa)
- Acts as an early profit-taking mechanism
- **Leave this ON** unless you're testing other exit strategies
**Divergence Filter (Default: OFF)**
- Looks for price/momentum divergences for additional confirmation
- **When to enable**: Trending markets where you want fewer but higher-quality trades
- **Keep OFF for**: Mean-reverting markets (oil, forex, most of the time)
---
## 🚀 Quick Start Guide
### Step 1: Set Up in TradingView
1. Open TradingView and navigate to your chart
2. Click "Pine Editor" at the bottom
3. Copy and paste the strategy code
4. Click "Add to Chart"
5. The strategy will appear in a separate pane below your price chart
### Step 2: Choose Your Market
**If you're trading Crude Oil:**
- Timeframe: 12H
- Keep all default settings
- Watch for signals during London/NY overlap (8am-11am EST)
**If you're trading AAVE or crypto:**
- Timeframe: 4H or 12H
- Consider these adjustments:
- Stochastic Length: 10-14 (faster)
- Oversold: 20 (more aggressive)
- Take Profit: 8-10% (higher targets)
### Step 3: Wait for Your First Signal
**LONG Entry** (Green circle appears):
- Stochastic crosses up below oversold level (25)
- Price likely near recent lows
- System places limit order at take profit and stop loss
**SHORT Entry** (Red circle appears):
- Stochastic crosses down above overbought level (70)
- Price likely near recent highs
- System places limit order at take profit and stop loss
**EXIT** (Orange circle):
- Position closes either at stop, target, or opposite extreme
- Cooldown period begins
### Step 4: Let It Run
The biggest mistake? **Interfering with the system.**
- Don't close trades early because you're scared
- Don't skip signals because you "have a feeling"
- Don't increase position size after a big win
- Don't revenge trade after a loss
**Follow the system or don't use it at all.**
---
### Important Risks:
1. **Drawdown Pain**: You WILL experience losing streaks of 5-7 trades. This is mathematically normal.
2. **Whipsaw Markets**: Choppy, range-bound conditions can trigger multiple small losses.
3. **Gap Risk**: Overnight gaps can cause your actual fill to be worse than the stop loss.
4. **Slippage**: Real execution prices differ from backtested prices (factor in 0.1-0.2% slippage).
---
## 🔧 Optimization Guide
### When to Adjust Settings:
**Market Volatility Increased?**
- Widen stop loss by 0.5-1%
- Increase take profit proportionally
- Consider increasing cooldown to 5-7 bars
**Getting Too Few Signals?**
- Decrease stochastic length to 10-12
- Increase oversold to 30, decrease overbought to 65
- Reduce cooldown to 2 bars
**Getting Too Many Losses?**
- Increase stochastic length to 18-21 (slower, smoother)
- Enable divergence filter
- Increase cooldown to 5+ bars
- Verify you're on the right timeframe
### A/B Testing Method:
1. **Run default settings for 50 trades** on your chosen market
2. Document: Win rate, profit factor, max drawdown, emotional tolerance
3. **Change ONE variable** (e.g., oversold from 25 to 20)
4. Run another 50 trades
5. Compare results
6. Keep the better version
**Never change multiple settings at once** or you won't know what worked.
---
## 📚 Educational Resources
### Key Concepts to Learn:
**Stochastic Oscillator**
- Developed by George Lane in the 1950s
- Measures momentum by comparing closing price to price range
- Formula: %K = (Close - Low) / (High - Low) × 100
- Similar to RSI but more sensitive to price movements
**Mean Reversion vs. Trend Following**
- This is a **mean reversion** strategy (price returns to average)
- Works best in ranging markets with defined support/resistance
- Fails in strong trending markets (2017 Bitcoin, 2020 Tech stocks)
- Complement with trend filters for better results
**Risk:Reward Ratio**
- The cornerstone of profitable trading
- Winning 40% of trades with 3:1 R:R = profitable
- Winning 60% of trades with 1:1 R:R = breakeven (after fees)
- **This strategy aims for 45% win rate with 2.5-3:1 R:R**
### Recommended Reading:
- *"Trading Systems and Methods"* by Perry Kaufman (Chapter on Oscillators)
- *"Mean Reversion Trading Systems"* by Howard Bandy
- *"The New Trading for a Living"* by Dr. Alexander Elder
---
## 🛠️ Troubleshooting
### "I'm not seeing any signals!"
**Check:**
- Is your timeframe 4H or higher?
- Is the stochastic actually reaching extreme levels (check if your asset is stuck in middle range)?
- Is cooldown still active from a previous trade?
- Are you on a low-liquidity pair?
**Solution**: Switch to a more volatile asset or lower the overbought/oversold thresholds.
---
### "The strategy keeps losing money!"
**Check:**
- What's your win rate? (Below 35% is concerning)
- What's your profit factor? (Below 0.8 means serious issues)
- Are you trading during major news events?
- Is the market in a strong trend?
**Solution**:
1. Verify you're using recommended markets/timeframes
2. Increase cooldown period to avoid choppy markets
3. Reduce position size to 5% while you diagnose
4. Consider switching to daily timeframe for less noise
---
### "My stop losses keep getting hit!"
**Check:**
- Is your stop loss tighter than the average ATR?
- Are you trading during high-volatility sessions?
- Is slippage eating into your buffer?
**Solution**:
1. Calculate the 14-period ATR
2. Set stop loss to 1.5x the ATR value
3. Avoid trading right after market open or major news
4. Factor in 0.2% slippage for crypto, 0.1% for oil
---
## 💪 Pro Tips from the Trenches
### Psychological Discipline
**The Three Deadly Sins:**
1. **Skipping signals** - "This one doesn't feel right"
2. **Early exits** - "I'll just take profit here to be safe"
3. **Revenge trading** - "I need to make back that loss NOW"
**The Solution:** Treat your strategy like a business system. Would McDonald's skip making fries because the cashier "doesn't feel like it today"? No. Systems work because of consistency.
---
### Position Management
**Scaling In/Out** (Advanced)
- Enter 50% position at signal
- Add 50% if stochastic reaches 10 (oversold) or 90 (overbought)
- Exit 50% at 1.5x take profit, let the rest run
**This is NOT for beginners.** Master the basic system first.
---
### Market Awareness
**Oil Traders:**
- OPEC meetings = volatility spikes (avoid or widen stops)
- US inventory reports (Wed 10:30am EST) = avoid trading 2 hours before/after
- Summer driving season = different patterns than winter
**Crypto Traders:**
- Monday-Tuesday = typically lower volatility (fewer signals)
- Thursday-Sunday = higher volatility (more signals)
- Avoid trading during exchange maintenance windows
---
## ⚖️ Legal Disclaimer
This trading strategy is provided for **educational purposes only**.
- Past performance does not guarantee future results
- Trading involves substantial risk of loss
- Only trade with capital you can afford to lose
- No one associated with this strategy is a licensed financial advisor
- You are solely responsible for your trading decisions
**By using this strategy, you acknowledge that you understand and accept these risks.**
---
## 🙏 Acknowledgments
Strategy development inspired by:
- George Lane's original Stochastic Oscillator work
- Modern quantitative trading research
- Community feedback from hundreds of backtests
Built with ❤️ for retail traders who want systematic, disciplined approaches to the markets.
---
**Good luck, stay disciplined, and trade the system, not your emotions.**

TradeShields Strategy Builder🛡 WHAT IS TRADESHIELDS?
This no-code strategy builder is designed for traders on TradingView, offering an intuitive platform to create, backtest, and automate trading strategies. While identifying signals is often straightforward, the real challenge in trading lies in managing risk and knowing when not to trade. It equips users with advanced tools to address this challenge, promoting disciplined decision-making and structured trading practices.
This is not just a collection of indicators but a comprehensive toolkit that helps identify high-quality opportunities while placing risk management at the core of every strategy. By integrating customizable filters, robust controls, and automation capabilities, it empowers traders to align their strategies with their unique objectives and risk tolerance.
_____________________________________
🛡 THE GOAL: SHIELD YOUR STRATEGY
The mission is simple: to shield your strategy from bad trades . Whether you're a seasoned trader or just starting, the hardest part of trading isn’t finding signals—it’s avoiding trades that can harm your account. This framework prioritizes quality over quantity , helping filter out suboptimal setups and encouraging disciplined execution.
With tools to manage risk, avoid overtrading, and adapt to changing market conditions, it protects your strategy against impulsive decisions and market volatility.
_____________________________________
🛡 HOW TO USE IT
1. Apply Higher Timeframe Filters
Begin by analyzing broader market trends using tools like the 200 EMA, Ichimoku Cloud, or Supertrend on higher timeframes (e.g., daily or 4-hour charts).
- Example: Ensure the price is above the 200 EMA on the daily chart for long trades or below it for short trades.
2. Identify the Appropriate Entry Signal
Choose an entry signal that aligns with your model and the asset you're trading. Options include:
Supertrend changes for trend reversals.
Bollinger Band touches for mean-reversion trades.
RSI strength/weakness for overbought or oversold conditions.
Breakouts of key levels (e.g., daily or weekly highs/lows) for momentum trades.
MACD and TSI flips.
3. Determine Take-Profit and Stop-Loss Levels
Set clear exit strategies to protect your capital and lock in profits:
Use single, dual, or triple take-profit levels based on percentages or price levels.
Choose a stop-loss type, such as fixed percentage, ATR-based, or trailing stops.
Optionally, set breakeven adjustments after hitting your first take-profit target.
4. Apply Risk Management Filters
Incorporate risk controls to ensure disciplined execution:
Limit the number of trades per day, week, or month to avoid overtrading.
Use time-based filters to trade during specific sessions or custom windows.
Avoid trading around high-impact news events with region-specific filters.
5. Automate and Execute
Leverage the advanced automation features to streamline execution. Alerts are tailored specifically for each supported platform, ensuring seamless integration with tools like PineConnector, 3Commas, Zapier, and more.
_____________________________________
🛡 CORE FOCUS: RISK MANAGEMENT, AUTOMATION, AND DISCIPLINED TRADING
This builder emphasizes quality over quantity, encouraging traders to approach markets with structure and control. Its innovative tools for risk management and automation help optimize performance while reducing effort, fostering consistency and long-term success.
_____________________________________
🛡 KEY FEATURES
General Settings
Theme Customization : Light and dark themes for a tailored interface.
Timezone Adjustment : Align session times and news schedules with your local timezone.
Position Sizing : Define lot sizes to manage risk effectively.
Directional Control : Choose between long-only, short-only, or both directions for trading.
Time Filters
Day-of-Week Selection : Enable or disable trading on specific days.
Session-Based Trading : Restrict trades to major market sessions (Asia, London, New York) or custom windows.
Custom Time Windows : Precisely control the timeframes for trade execution.
Risk Management Tools
Trade Limits : Maximum trades per day, week, or month to avoid overtrading.
Automatic Trade Closures : End-of-session, end-of-day, or end-of-week options.
Duration-Based Filters : Close trades if take-profit isn’t reached within a set timeframe or if they remain unprofitable beyond a specific duration.
Stop-Loss and Take-Profit Options : Fixed percentage or ATR-based stop-losses, single/dual/triple take-profit levels, and breakeven stop adjustments.
Economic News Filters
Region-Specific Filters : Exclude trades around major news events in regions like the USA, UK, Europe, Asia, or Oceania.
News Avoidance Windows : Pause trades before and after high-impact events or automatically close trades ahead of scheduled news releases.
Higher Timeframe Filters
Multi-Timeframe Tools : Leverage EMAs, Supertrend, or Ichimoku Cloud on higher timeframes (Daily, 4-hour, etc.) for trend alignment.
Chart Timeframe Filters
Precision Filtering : Apply EMA or ADX-based conditions to refine trade setups on current chart timeframes.
Entry Signals
Customizable Options : Choose from signals like Supertrend, Bollinger Bands, RSI, MACD, Ichimoku Cloud, or EMA pullbacks.
Indicator Parameter Overrides : Fine-tune default settings for specific signals.
Exit Settings
Flexible Take-Profit Targets : Single, dual, or triple targets. Exit at significant levels like daily/weekly highs or lows.
Stop-Loss Variability : Fixed, ATR-based, or trailing stop-loss options.
Alerts and Automation
Third-Party Integrations : Seamlessly connect with platforms like PineConnector, 3Commas, Zapier, and Capitalise.ai.
Precision-Formatted Alerts : Alerts are tailored specifically for each platform, ensuring seamless execution. For example:
- PineConnector alerts include risk-per-trade parameters.
- 3Commas alerts contain bot-specific configurations.
_____________________________________
🛡 PUBLISHED CHART SETTINGS: 15m COMEX:GC1!
Time Filters : Trades are enabled from Tuesday to Friday, as Mondays often lack sufficient data coming off the weekend, and weekends are excluded due to market closures. Custom time sessions are turned off by default, allowing trades throughout the day.
Risk Filters : Risk is tightly controlled by limiting trades to a maximum of 2 per day and enabling a mechanism to close trades if they remain open too long and are unprofitable. Weekly trade closures ensure that no positions are carried over unnecessarily.
Economic News Filters : By default, trades are allowed during economic news periods, giving traders flexibility to decide how to handle volatility manually. It is recommended to enable these filters if you are creating strategies on lower timeframes.
Higher Timeframe Filters : The setup incorporates confluence from higher timeframe indicators. For example, the 200 EMA on the daily timeframe is used to establish trend direction, while the Ichimoku cloud on the 30-minute timeframe adds additional confirmation.
Entry Signals : The strategy triggers trades based on changes in the Supertrend indicator.
Exit Settings : Trades are configured to take partial profits at three levels (1%, 2%, and 3%) and use a fixed stop loss of 2%. Stops are moved to breakeven after reaching the first take profit level.
_____________________________________
🛡 WHY CHOOSE THIS STRATEGY BUILDER?
This tool transforms trading from reactive to proactive, focusing on risk management and automation as the foundation of every strategy. By helping users avoid unnecessary trades, implement robust controls, and automate execution, it fosters disciplined trading.

Risk Reward Calculator [lovealgotrading]
OVERVIEW:
This Risk Reward Calculator strategy can help you maximize your RR value with help of algorithmic trading.
INDICATOR:
I wanted to setup my trades more easier with this indicator, I didn't want to calculate everytime before orders, with help this indicator we can calculate R:R value, avarage price, stoploss price, take-profit price, order prices, all position cost and more ...
Our strategy is a risk revard calculation indicator that is made easy to use by using visualized lines and panels, and also has algorithmic trading support.
With the help of this indicator, we can quickly and easily calculate our risk reward values and enter the positions.
If we want to ensure that our balance grows regularly while trading in the stock market, we need to manage the risks and rewards otherwise we may fall below our initial balance at the end of the day, even if we seem to be winning.
What is the Risk-Reward value ?
This value is a value that shows how many times the amount of risk we take when entering the position is successful, we will earn.
- For example, you risked $100 while entering the trade, so if your trade stops, you will lose 100 $.
Your Risk-Reward(RR) value is 2 means that if your position is successful, you will have 200 $ in your pocket.
A trader's success is determined by the amount of R he earns monthly or yearly, not how much money he makes.
What is different in this indicator ?
I want to say thank you to © EvoCrypto. His Calculator (weighted) – evo indicator helped me when I was developed my indicator.
I want to explain what I have improved:
1-In this strategy, we can determine the time period in which we want to open our positions.
2-We can open a maximum of 4 positions in the same direction and close our positions at a single level. StopLoss or TakeProfit
3-This indicator, which works in the form of a strategy, shows where our positions have been opened or closed. With the help of this, it helps us to determine our strategy in our future positions more accurately.
4-The most important improvement is that we do not miss our positions with the help of alarms (WEB HOOK). if we want, we receive by quickly connecting all these positions to our robot, the software can enter and exit the position while we are busy.
IMPLEMENTATION DETAILS – SETTINGS:
1 - We can set the start and end dates of the positions we will take.
2- We can set our take profit, stoploss levels.
3- If your trade is stopped, we can determine the amount of the trade that we will lose.
4- We can adjust our entry levels to positions and our position sizes at entry levels.
(Sum of positions weight must be 100%)
5- We can receive our positions even if we are busy with the help of algorithmic trading. For this, we must paste our Jshon codes into the fields specified in the settings panel.
6- Finally, we can change the settings we want and don't want to have in our visual elements.
Let's make a LONG side example together
We have determined our positions to enter stoploss, take profit and long positions. We did not forget to set the start time of our strategy
Our strategy appear on the graph as follows.
Our strategy has calculated the total position size, our R-R value, the distance of the current price to the stop and take profit levels, in short, a lot of things we could look visually.
Notes:
If you're going to connect this bot to an automatic Long or Short direction,
Don’t forget! you need to Webhook URL,
Don’t miss paste this code to your message window {{strategy.order.alert_message}}
ALSO:
If you have any ideas what to add to my work to add more sources or make calculations cooler, feel free to write me.

Super 8 - 30M BTCWelcome to Super 8, the ultimate automatic trading script for Pine!
This bad boy is designed to go both long and short, and it's equipped with all the tools you need to maximize your profits. Whether you're looking to take profit, set a trailing stop, or protect yourself with a stop loss, Super 8 has you covered.
But that's not all! Super 8 is also loaded with 8 powerful indicators to help you make informed decisions. We've got the EMA, ADX, SAR, MACD, VOLUME, BOLLINGER BANDS, DONCHIAN, and ATR all working together to give you the best possible trading experience.
And if you want to take it to the next level, Super 8 also has a feature that lets you use stepped entries in normal mode or incremental 1,2,3,... to improve your average price. Plus, if you're using trailing stop, you can activate the Backtest precision to use lower timeframes.
But what's in a name? Super 8 is called that because it's just that... super! It's tailored specifically for the OKX:BTCUSDT.P pair, so you know you're getting the best possible results. it's highly adjustable and can be used with any other pair. So no matter what market you're trading in, Super 8 has got you covered.
So if you want to level up your trading game, give Super 8 a try. You won't be disappointed.
Certain Risks of Live Algorithmic Trading:
Backtesting Cannot Assure Actual Results.
The relevant market might fail or behave unexpectedly.
Your broker may experience failures in its infrastructure, fail to execute your orders in a correct or timely fashion or reject your orders.
The system you use for generating trading orders, communicating those orders to your broker, and receiving queries and trading results from your broker may fail.
Time lag at various point in live trading might cause unexpected behavior.
The systems of third parties in addition to those of the provider from which we obtain various services, your broker, and the applicable securities market may fail or malfunction.

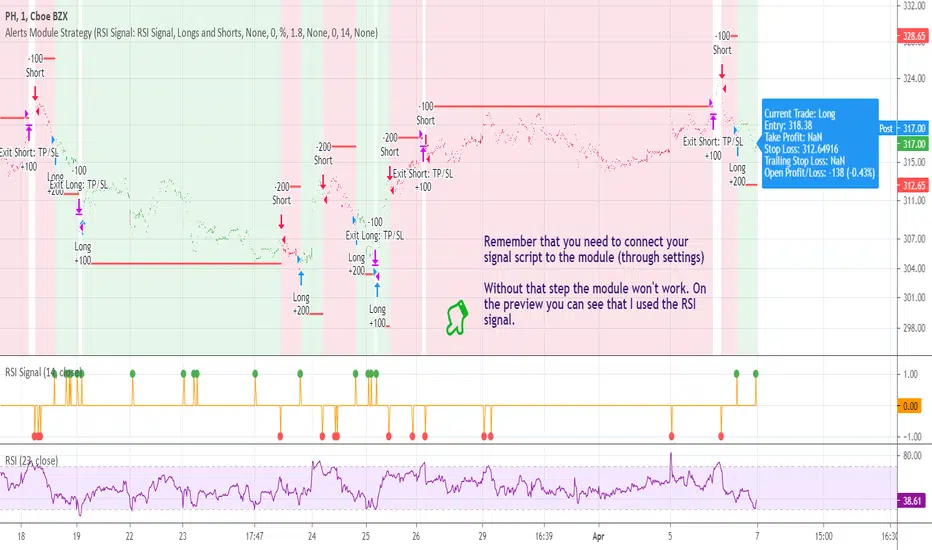
[STRATEGY] Buy/Sell/TP/SL/TSL Alerts ModuleA strategy version of the Buy/Sell/TP/SL/TSL Alerts Module .
It works the same way:
1) You choose a specific indicator and apply it to your chart
2) You create a special signal form of that indicator
3) You connect that form to the module
4) Bob's your uncle
If you have any questions don't hesitate to ask and contact me either via private messages on TradingView or via Telegram.
Thanks!
Simple and efficient swing RSI systemHello there,
I am glad to bring you another simple and efficient algorithm.
Its made purely from RSI which can be used directly or inversed. Its suited for swing trading 15 min chart or more minimum.
Can be adapted to all types of financial markets.
Rules for entry are easy : First we have the stop loss and take profits levels. Based on SL , we have the risk % of our equity, where the minimum lot we can trade its setted on 0.1 lots , can be modified tho.
For entries, we have the overbought and oversold levels.
Whenever we cross one of them we enter the trade . We close the trade whenever we reach sl/tp or inverse crosses.
Although its has a low win rate, its a very good system to catch big trends, so there you can recover all the small losses that you had in a untrend market .
Aswell it requires a lot of patience, since a position can be kept for weeks, even months.
Hope you enjoyed it .

Systematic Momentum strategy v 1.0Systematic Momentum strategy v 1.0
This is a long-only strategy optimized taking into consideration the underlying's momentum and volatily.
Long story short it opens positions when the momentum is highest and the risk is lowest and closes the same position when the risk-to-reward is no longer optimal.
How to use:
-> To be used on an Index or a tracker ETF
-> Position sizing should be set up to 100% of the portfolio

Reticulata Enhanced - StrategyThis script is the backtesting for Reticulata Enhanced.
Building on our core script - Reticulata, the enhanced version features several requested extras to give you more flexibility with your trading style.
What is Reticulata Enhanced?
The Reticulata core leverages a blend of MA/RSI strategies mixed with the Bull Bear Bots optimised logic for risk management. This enhanced version takes it a step further with additional risk management features:
Trailing Stop
Fixed Stop
Fixed Stop, but move at TP
Trend confirmation
Usage
Using the indicator is as simple as:
1. Select the strategy, or combination of strategies you want to use
2. If desired, select one or more of the available trend filters
3. Adjust your stop options
4. Review backtest results
Markets
Like the core, the enhanced algo also supports a range of markets and timeframes, including the majors (EURUSD, etc...) in Forex and a variety of Cryptocurrencies including Bitcoin (BTC/XBT etc...).
All of our scripts are designed for manual traders but are ready to use with automated trading bots.
