Retail Sentiment Indicator - Multi-Asset CFD & Fear/Greed IndexRetail Sentiment Indicator - Multi-Asset CFD & Fear/Greed Index
Overview
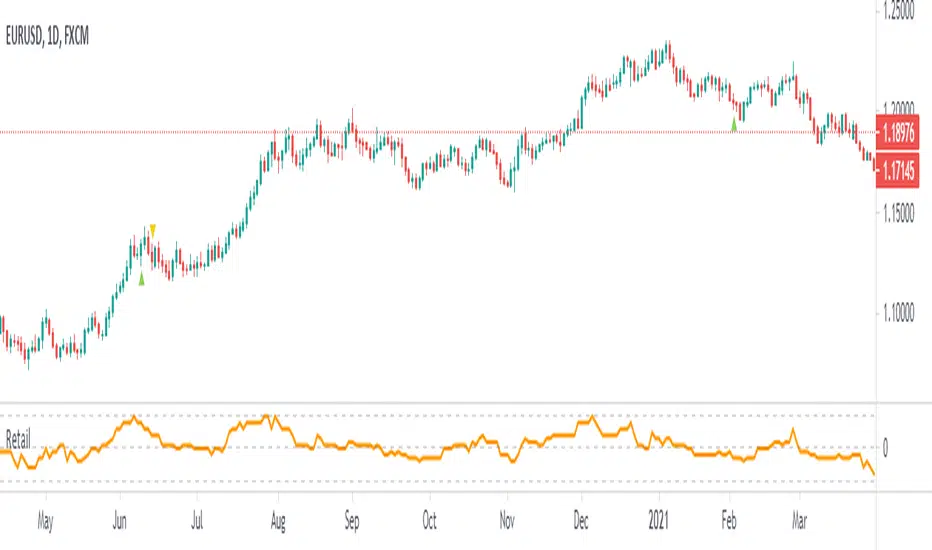
The Retail Sentiment Indicator provides real-time sentiment data for major financial instruments including stocks, forex, commodities, and cryptocurrencies. This indicator displays retail trader positioning and market sentiment using CFD data and fear/greed indices.
Methodology and Scale Calculation
This indicator operates on a **-50 to +50 scale** with zero representing perfect market equilibrium.
Scale Interpretation:
- **Zero (0)**: Market balance - exactly 50% of investors buying, 50% selling
- **Positive values**: Majority buying pressure
- Example: If 63% of investors are buying, the indicator shows +13 (63 - 50 = +13)
- **Negative values**: Majority selling pressure
- Example: If 92% of investors are selling, the indicator shows -42 (50 - 92 = -42)
BTC Fear & Greed Index Scaling:
The original `BTC FEAR&GREED` index is natively scaled from 0-100 by its creator. In our indicator, this data has been rescaled to also fit the -50 to +50 range for consistency with other sentiment data sources.
This unified scaling approach allows for direct comparison across all instruments and data sources within the indicator.
-Important Data Source Selection-
Bitcoin (BTC) Data Sources
When viewing Bitcoin charts, the indicator offers **two different data sources**:
1. **Default Auto-Mode**: `BTCUSD Retail CFD` - Retail CFD traders sentiment data (automatically loaded).
2. **Manual Selection**: `BTC FEAR&GREED` - Fear & Greed Index from website: alternative dot me
**To access BTC Fear & Greed Index**: Input settings -> disable checkbox "Auto-load Sentiment Data" -> manually select "BTC FEAR&GREED" from the dropdown menu.
US Stock Market Data Sources
For US stocks and indices (S&P 500, NASDAQ, Dow Jones), there are **two data source options**:
1. **Default Auto-Mode**: Individual retail CFD sentiment data for each instrument
2. **Manual Selection**: `SNN FEAR&GREED` - SNN's Fear & Greed Index covering the overall US market sentiment. SNN was used as the name to avoid any potential trademark infringement.
**To access SNN Fear & Greed Index**: When viewing US market charts, disable in input settings checkbox "Auto-load Sentiment Data" and manually select "SNN FEAR&GREED" from the dropdown menu.
This distinction allows traders to choose between **instrument-specific retail sentiment** (auto-mode) or **broader market sentiment indices** (manual selection).
Features
- **Auto-Detection**: Automatically loads sentiment data based on the current chart symbol
- **Manual Selection**: Choose from 40+ supported instruments when auto-detection is unavailable
- **Multiple Data Sources**: Combines retail CFD sentiment with Fear & Greed indices
- **Visual Zones**: Clear greed/fear zones with color-coded backgrounds
- **Real-time Updates**: Live sentiment data from merged data sources
Supported Instruments
Major Indices
- S&P 500, NASDAQ, Dow Jones 30, DAX
Forex Pairs
- Major pairs: EURUSD, GBPUSD, USDJPY, USDCHF, USDCAD
- Cross pairs: EURJPY, GBPJPY, AUDUSD, NZDUSD, and 20+ others
Commodities
- Precious metals: Gold (XAUUSD), Silver (XAGUSD)
- Energy: WTI Oil
- Agricultural: Wheat, Coffee
- Industrial: Copper
Cryptocurrencies
- Bitcoin (BTC) sentiment data
- BTC & SNN Fear & Greed indices
How to Use
1. **Auto Mode** (Default): Enable "Auto-load Sentiment Data" to automatically display sentiment for the current chart symbol
2. **Manual Mode**: Disable auto-load and select from the dropdown menu for specific instruments
3. **Interpretation**:
- Values above 0 (green) indicate retail greed/bullish sentiment
- Values below 0 (red) indicate retail fear/bearish sentiment
- Fear & Greed indices use 0-100 scale (50 is neutral)
Data Sources
This indicator uses curated sentiment data from retail CFD providers and established fear/greed indices. Data is updated regularly and sourced from reputable financial data providers.
Trading Strategy & Market Philosophy
Contrarian Trading Approach
The primary purpose of this indicator is based on the fundamental market principle that **the majority of retail investors are often wrong**, and markets typically move opposite to the positions held by the majority of market participants.
Key Strategy Guidelines:
- **Contrarian Signal**: When the majority of users are positioned on one side of the market, there is statistically greater market advantage in taking positions in the opposite direction
- **Trend Exhaustion Signal**: An interesting observed phenomenon occurs when, during a long-lasting trend where the majority of investors have consistently been on the wrong side, the Sentiment indicator suddenly shows that the majority has flipped and opened positions in the direction of that long-running trend. This is often a signal of fuel exhaustion for further movement in that direction
Interpretation Examples
- High greed readings (majority bullish) → Consider bearish opportunities
- High fear readings (majority bearish) → Consider bullish opportunities
- Sudden sentiment flip during established trends → Potential trend reversal signal
Technical Notes
- Built with PineScript v6
- Dynamic symbol detection with fallback options
- Optimized for performance with minimal resource usage
- Color-coded visualization with customizable zones
Data Sources & Expansion
Acknowledgments
We extend our gratitude to **TradingView** for enabling the use of custom data feeds based on GitHub repositories, making this comprehensive sentiment analysis possible.
Data Expansion Opportunities
As the operator of this indicator, I am **open to suggestions for new data sources** that could be integrated and published. If you have ideas for additional instruments or sentiment data:
How to Submit Suggestions:
1. Send a **private message** with your proposal
2. Include: **instrument/data type**, **source**, and **brief description**
3. If technically feasible, we will work to import and publish the data
Data Infrastructure Status
Current Data Upload Process:
Please note that sentiment data uploads may occasionally experience minor interruptions. However, this should not pose significant issues as sentiment data typically changes gradually rather than rapidly.
Infrastructure Development:
We are actively working on establishing permanent cloud-based infrastructure to ensure continuous, automated data collection and upload processes. This will provide more reliable and consistent data availability in the future.
Disclaimer
This indicator is for educational and informational purposes only. Sentiment data should be used as part of a comprehensive trading strategy and not as the sole basis for trading decisions. Past performance does not guarantee future results. The contrarian approach described is a market theory and may not always produce profitable results.
Pine Script® Indikator