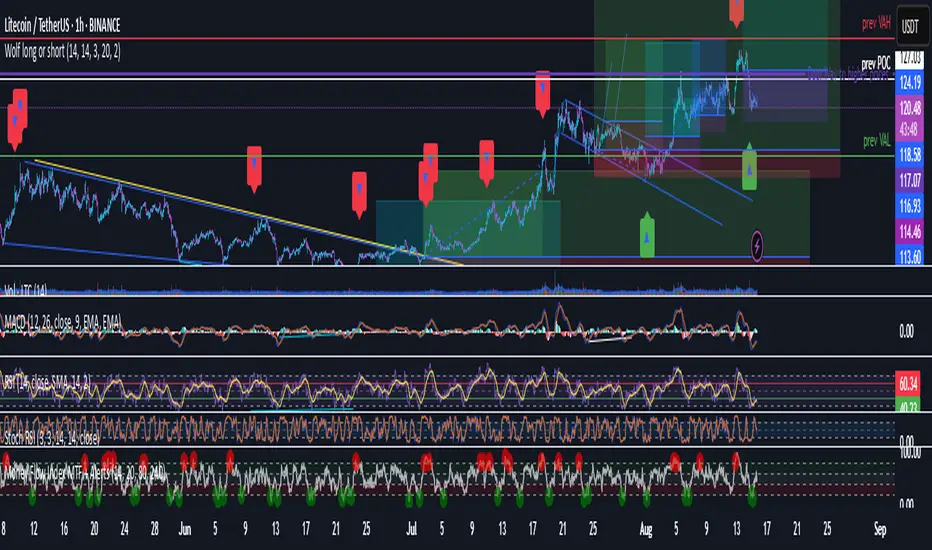
Wolf long or short this indicator is based on RSI, Stoch, BB , this indicator is giving a better understanding of short or long combined with 3 indicator
Relative Strength Index (RSI)
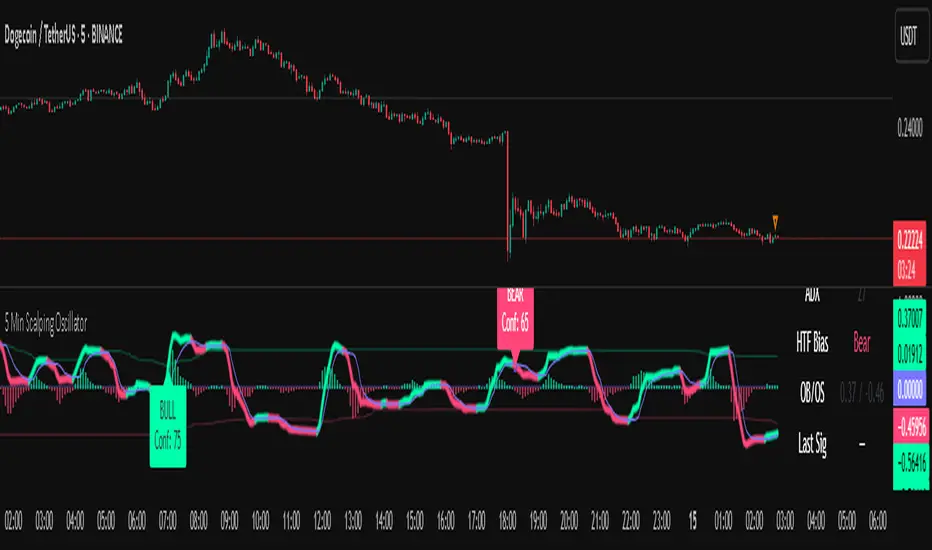
5 Min Scalping Oscillator### Overview
The 5 Min Scalping Oscillator is a custom oscillator designed to provide traders with a unified momentum signal by fusing normalized versions of the Relative Strength Index (RSI), Stochastic RSI, and Commodity Channel Index (CCI). This combination creates a more balanced view of market momentum, overbought/oversold conditions, and potential reversals, while incorporating adaptive smoothing, dynamic thresholds, and market condition filters to reduce noise and false signals. Unlike standalone oscillators, the 5 Min Scalping Oscillator adapts to trending or sideways regimes, volatility levels, and higher timeframe biases, making it particularly suited for short-term charts like 5-minute timeframes where quick, filtered signals are valuable.
### Purpose and Originality of the Fusion
Traditional oscillators like RSI measure momentum but can lag in volatile markets; Stochastic RSI adds sensitivity to RSI extremes but often generates excessive noise; and CCI identifies cyclical deviations but may overreact to minor price swings. The 5 Min Scalping Oscillator addresses these limitations by weighting and blending their normalized outputs (RSI at 45%, Stochastic RSI at 35%, and CCI at 20%) into a single raw oscillator value. This weighted fusion creates a hybrid signal that balances lag reduction with noise filtering, resulting in a more robust indicator for identifying reversal opportunities.
The originality lies in extending this fusion with:
- **Adaptive Smoothing via KAMA (Kaufman's Adaptive Moving Average):** Adjusts responsiveness based on market efficiency, speeding up in trends and slowing in ranges—unlike fixed EMAs, this helps preserve signal integrity without over-smoothing.
- **Dynamic Overbought/Oversold Thresholds:** Calculated using rolling percentiles over a user-defined lookback (default 200+ periods), these levels adapt to recent oscillator behavior rather than relying on static values like 70/30, making the indicator more responsive to asset-specific volatility.
- **Multi-Factor Filters:** Integrates ADX for trend detection, ATR percentiles for volatility confirmation, and optional higher timeframe RSI bias to ensure signals align with broader market context. This layered approach reduces false positives (e.g., ignoring low-volatility crossovers) and adds a confidence score based on filter alignment, which is not typically found in simple mashups.
This design justifies the combination: it's not a mere overlay of indicators but a purposeful integration that enhances usefulness by providing context-aware signals, helping traders avoid common pitfalls like trading against the trend or in low-volatility chop. The result is an original tool that performs better in diverse conditions, especially on 5-minute charts for intraday trading, where rapid adaptations are key.
### How It Works
The 5 Min Scalping Oscillator processes price data through these steps:
1. **Normalization and Fusion:**
- RSI (default length 10) is normalized to a -1 to +1 scale using a tanh transformation for bounded output.
- Stochastic RSI (default length 14) is derived from RSI highs/lows and scaled similarly.
- CCI (default length 14) is tanh-normalized to align with the others.
- These are weighted and summed into a raw value, emphasizing RSI for core momentum while using Stochastic RSI for edge sensitivity and CCI for cycle detection.
2. **Smoothing and Signal Line:**
- The raw value is smoothed (default KAMA with fast/slow periods 2/30 and efficiency length 10) to reduce whipsaws.
- A shorter signal line (half the smoothing length) is added for crossover detections.
3. **Filters and Enhancements:**
- **Trend Regime:** ADX (default length 14, threshold 20) classifies markets as trending (ADX > threshold) or sideways, allowing signals in both but prioritizing alignment.
- **Volatility Check:** ATR (default length 14) percentile (default 85%) ensures signals only trigger in above-average volatility, filtering out flat markets.
- **Higher Timeframe Bias:** Optional RSI (default length 14 on 60-minute timeframe) provides bull/neutral/bear bias (above 55, 45-55, below 45), requiring signal alignment (e.g., bullish signals only if bias is neutral or bull).
- **Dynamic Levels:** Percentiles (default OB 85%, OS 15%) over recent oscillator values set adaptive overbought/oversold lines.
4. **Signal Generation:**
- Bullish (B) signals on upward crossovers of the smoothed line over the signal line, filtered by conditions.
- Bearish (S) signals on downward crossunders.
- Each signal includes a confidence score (0-100) based on factors like trend alignment (25 points), volatility (15 points), and bias (20 points if strong, 10 if neutral).
The output includes a glowing oscillator line, histogram for divergence spotting, dynamic levels, shapes/labels for signals, and a dashboard table summarizing regime, ADX, bias, levels, and last signal.
### How to Use It
This indicator is easy to apply and interpret, even for beginners:
- **Adding to Chart:** Apply the 5 Min Scalping Oscillator to a clean chart (no other indicators unless explained). It's non-overlay, so it appears in a separate pane. For 5-minute timeframes, keep defaults or tweak lengths shorter for faster response (e.g., RSI 8-12).
- **Interpreting Signals:**
- Look for green upward triangles labeled "B" (bullish) at the bottom for potential entry opportunities in uptrends or reversals.
- Red downward triangles labeled "S" (bearish) at the top signal potential exits or shorts.
- Higher confidence scores (e.g., 70+) indicate stronger alignment—use these for priority trades.
- Watch the histogram for divergences (e.g., price higher highs but histogram lower highs suggest weakening momentum).
- Dynamic OB (green line) and OS (red line) help gauge extremes; signals near these are more reliable.
- **Dashboard:** At the bottom-right, it shows real-time info like "Trending" or "Sideways" regime, ADX value, HTF bias (Bull/Neutral/Bear), OB/OS levels, and last signal—use this for quick context.
- **Customization:** Adjust inputs via the settings panel:
- Toggle KAMA for adaptive vs. EMA smoothing.
- Set HTF to "60" for 1-hour bias on 5-min charts.
- Increase ADX threshold to 25 for stricter trend filtering.
- **Best Practices:** Combine with price action (e.g., support/resistance) or volume for confirmation. On 5-min charts, pair with a 1-hour HTF for intraday scalping. Always use stop-losses and risk no more than 1-2% per trade.
### Default Settings Explanation
Defaults are optimized for 5-minute charts on volatile assets like stocks or forex:
- RSI/Stoch/CCI lengths (10/14/14): Shorter for quick momentum capture.
- Signal smoothing (5): Responsive without excessive lag.
- ADX threshold (20): Balances trend detection.
- ATR percentile (0.85): Filters ~15% of low-vol signals.
- HTF RSI (14 on 60-min): Aligns with hourly trends.
- Percentiles (OB 85%, OS 15%): Adaptive to recent data.
If changing, test on historical data to ensure fit—e.g., longer lengths for less noisy assets.
### Disclaimer
The 5 Min Scalping Oscillator is an educational tool to visualize momentum and does not guarantee profits or predict future performance. All signals are based on historical calculations and should not be used as standalone trading advice. Past results are not indicative of future outcomes. Traders must conduct their own analysis, use proper risk management, and consider market conditions. No claims are made about accuracy, reliability, or performance.
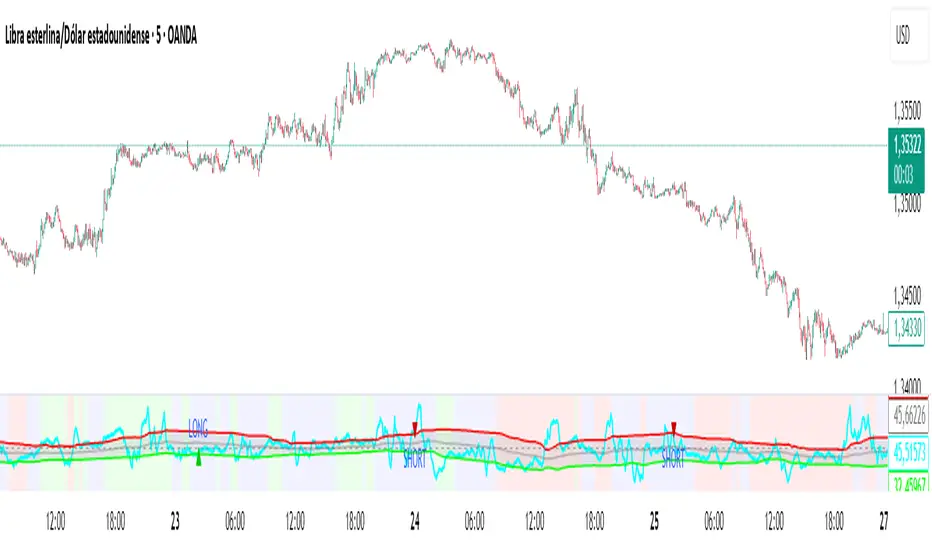
New RSI📌 New RSI
The New RSI is a modern, enhanced version of the classic RSI created in 1978 — redesigned for today’s fast-moving markets, where algorithmic trading and AI dominate price action.
This indicator combines:
Adaptive RSI: Adjusts its calculation length in real time based on market volatility, making it more responsive during high volatility and smoother during calm periods.
Dynamic Bands: Upper and lower bands calculated from historical RSI volatility, helping you spot overbought/oversold conditions with greater accuracy.
Trend & Regime Filters: EMA and ADX-based detection to confirm signals only in favorable market conditions.
Volume Confirmation: Signals appear only when high trading volume supports the move — green volume for bullish setups and red volume for bearish setups — filtering out weak and unreliable trades.
💡 How it works:
A LONG signal appears when RSI crosses above the lower band and the volume is high with a bullish candle.
A SHORT signal appears when RSI crosses below the upper band and the volume is high with a bearish candle.
Trend and higher timeframe filters (optional) can help improve precision and adapt to different trading styles.
✅ Best Use Cases:
Identify high-probability reversals or pullbacks with strong momentum confirmation.
Avoid false signals by trading only when volume validates the move.
Combine with your own support/resistance or price action strategy for even higher accuracy.
⚙️ Fully Customizable:
Adjustable RSI settings (length, volatility adaptation, smoothing)
Dynamic band sensitivity
Volume threshold multiplier
Higher timeframe RSI filter
Color-coded background for market regime visualization
This is not just another RSI — it’s a complete, next-gen momentum tool designed for traders who want accuracy, adaptability, and confirmation in every signal.
Cnagda Trading ToolCnagda Trading Tools - complete set of intraday trading
1. Trendline breakout based On ATR.
2. Live RSI, volume/candle average 20 Periods, trend direction last 34 periods, and some useful dashboard features.
3. Ma Scalp Line provide trend support and resistance + Where Line More Flat Previous Time You Also Use That Range As Support And Resistance
4. RSI based POC ( Point Of Control) indicate high Volume Area like fixed Range Volume profile
5. London session breakout with buy/sell Signal and NewYork session opening half hour range breakout with Buy/sell signal
Ma Scalp Buy And Sell Signal For Short term Scalping ( 5 Min Timeframe) Based on Ema And Wma Crossover
I hope these tools will improve your trading, but you should trade only after proper research, this indicator is not responsible for any loss.

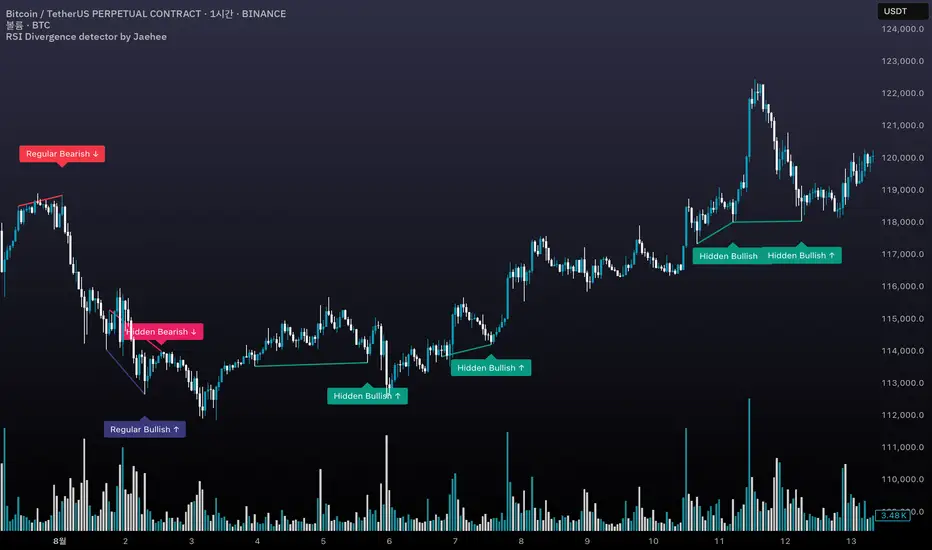
RSI Divergence detector by Jaehee📌 RSI DIVERGENCE DETECTOR — Instant Detection of Regular & Hidden Divergences with Color-Coded Labels
🔍 WHAT IT IS
• Detects regular and hidden divergences between price and RSI instantly, without the delay common in other divergence indicators
• Displays divergences directly on the chart with color-coded labels and connecting lines for instant visual recognition
• Uses different label colors for each divergence type so traders can identify setups at a glance
⚙️ HOW IT WORKS
• RSI Calculation — RSI is computed from a chosen price source with adjustable length
• Immediate Pivot Detection — Identifies pivots just one bar after formation for minimal delay
• RSI Delta Filter — Requires a minimum RSI difference to reduce noise and false signals
• Divergence Logic
Regular Bullish: Price lower low • RSI higher low
Regular Bearish: Price higher high • RSI lower high
Hidden Bullish: Price higher low • RSI lower low
Hidden Bearish: Price lower high • RSI higher high
• Visual Output — Connects pivot points with lines and adds labels above/below bars in colors you set
💡 WHY THIS COMBINATION
• Instant feedback — Acts faster than typical divergence tools that wait for multiple bar confirmations
• All-in-one detection — Regular and hidden divergences in the same tool
• Visual clarity — Distinct label colors make type recognition immediate
• Customizable — Adjust RSI length, pivot sensitivity, color scheme, and filtering to your style
🆚 HOW IT DIFFERS FROM COMMON DIVERGENCE INDICATORS
• Displays divergence the moment a pivot forms
• Detects both regular and hidden divergences in real time
• Applies RSI difference filtering for better quality
• Offers full color customization for each divergence type
📖 HOW TO READ IT (CONTEXT, NOT SIGNALS)
• Regular Bullish ↑ — Possible upward reversal or trend continuation after pullback
• Regular Bearish ↓ — Possible downward reversal or continuation after rally
• Hidden Bullish ↑ — Often a trend continuation signal in uptrends
• Hidden Bearish ↓ — Often a trend continuation signal in downtrends
• Always confirm with trend, momentum, or volume tools before trading
🛠 INPUTS
• RSI source and length
• Pivot lookback bars (left/right)
• Minimum RSI difference
• Custom colors for each divergence type
🎨 DESIGN NOTES
• Overlay on price chart for context
• Lines connect relevant pivots for clarity
• Labels placed near pivot highs/lows for easy spotting
• Customizable colors for personal visual preferences
⚠️ LIMITATIONS AND GOOD PRACTICE
• Divergence is not a guaranteed reversal signal
• Strong trends may override divergence setups
• False signals can occur in low volume or choppy markets
• Best used with a complete trading system and risk management
📂 DEFAULTS AND SCOPE
• Works on all OHLCV instruments and timeframes
• No repainting after pivot confirmation
💬 AUTHOR’S NOTE FOR REVIEW
This script is not a repackaging of existing tools. It integrates immediate divergence detection, hidden divergence analysis, and visual type separation into a single, customizable package. All features interact to deliver faster, clearer market context without generating trade signals or making performance claims.
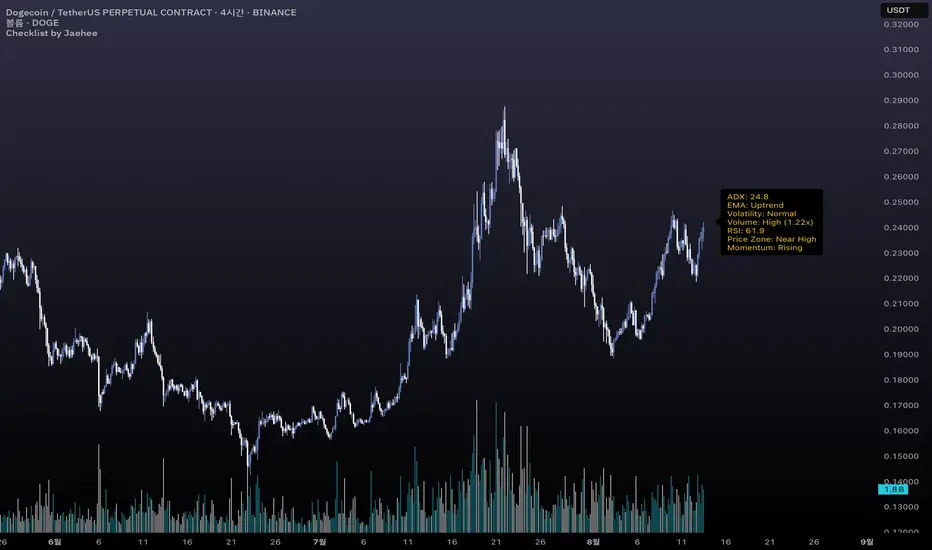
Checklist by JaeheeThe checklist is a market context tool that consolidates seven key metrics into a single on-chart panel, helping traders quickly gauge market conditions without switching between multiple indicators.
1. Display Panel (7 metrics):
ADX: Trend intensity (Above 20 often indicates a stronger, more reliable trend)
EMA Structure: 5/20/60/120/240 EMA alignment (Uptrend, Downtrend, or Mixed state)
Volatility: ATR regime classification (High volatility may require wider stops)
Volume State: Relative to 20-bar SMA with spike multiple (High volume often confirms price moves)
RSI: Current RSI(14) value (Above 70 = overbought zone, below 30 = oversold zone)
Price Zone: Location within the last 20-bar range (Near High, Mid, or Near Low)
Momentum Slope: MACD histogram slope (Rising suggests building momentum; Falling suggests fading momentum)
2. Purpose & Use:
Designed for traders—especially beginners—who want to speed up market scanning.
Keeps a concise, standardized “checklist” visible on the right side of the chart.
Use as a contextual reference, not as an entry/exit signal.
3. Features:
Compact label HUD anchored to the chart’s right margin.
Automatic refresh on each bar close with only one label to avoid clutter.
Works on any timeframe and symbol that supports OHLCV data.
RSI Z-score | Lemniscuss🧠 Introducing RSI Z-Score (RSI-Z) by Lemniscuss
🛠️ Overview
RSI Z-Score (RSI-Z) is a momentum-based market condition detector that transforms the classic Relative Strength Index (RSI) into a standardized volatility framework.
By applying Z-Score normalization to the RSI, this tool allows traders to identify statistically significant deviations in momentum — cutting through noise and highlighting high-probability turning points.
RSI-Z is optimized for trend inflection detection and overextension spotting, providing both visual clarity and actionable trade signals with dynamic labeling and optional bar coloring.
🔍 How It Works
1️⃣ RSI Foundation
The system starts with a standard RSI calculation on a user-defined source and length (default: 45).
2️⃣ Z-Score Normalization
The RSI values are standardized by subtracting their mean and dividing by the standard deviation over the same lookback.
This converts RSI into a statistical measure — revealing how many standard deviations current momentum is from its mean.
3️⃣ Threshold Logic
Two customizable thresholds define actionable zones:
• Long Threshold → Signals bullish momentum shifts when crossed upward
• Short Threshold → Signals bearish momentum shifts when crossed downward
4️⃣ Signal State Tracking
A state variable locks in a bias (Long / Short / Neutral) until an opposing trigger appears, ensuring clear and consistent market bias mapping.
✨ Key Features
🔹 Statistically Driven Momentum Detection — Moves beyond fixed RSI overbought/oversold levels by using standard deviations for adaptive accuracy.
🔹 Customizable Thresholds — Fine-tune long/short triggers for different volatility environments.
🔹 Clear Visual Feedback — Candle coloring and signal labels make trade setups instantly recognizable.
🔹 Overlay-Friendly — Works directly on your main chart or in a separate pane.
⚙️ Custom Settings
• Source: Price stream for RSI calculation (default: close)
• RSI Length: Lookback period for RSI & Z-Score (default: 45)
• Long Threshold: Z-score value for bullish signal (default: 1)
• Short Threshold: Z-score value for bearish signal (default: -1.9)
• Long/Cash Signal Labels: Toggle for "Long"/"Short" markers
• Bar Coloring: Toggle for trend-based candle coloring
📌 Trading Applications
✅ Trend Reversals → Spot statistically significant shifts in momentum before traditional RSI signals trigger
✅ Overextension Monitoring → Identify when momentum has deviated too far from the mean
✅ Mean Reversion Setups → Use extreme Z-score values as potential reversion points
✅ Bias Confirmation → Combine with trend tools for higher conviction entries/exits
📌 Conclusion
RSI-Z by Lemniscuss offers a clean, statistics-backed upgrade to the classic RSI.
By framing momentum in standard deviation terms, it empowers traders to separate normal fluctuations from truly significant market moves — making it a valuable tool for both trend traders and mean reversion specialists.
🔹 Summary Highlights
1️⃣ Statistical upgrade to RSI for higher-quality signals
2️⃣ Threshold-based, customizable long/short triggers
3️⃣ Visual candle coloring & signal labels for clarity
4️⃣ Adaptable to trend, swing, or intraday strategies
📌 Disclaimer: Past performance is not indicative of future results. No indicator guarantees profitability — always test and manage risk appropriately.

Minimalist RSI - Nasdaq (14) with Volume Filter and AlertsDescription:
This indicator shows the standard RSI (period 14) adapted for Nasdaq, with a clean and minimalist design. It adds visual levels for overbought (75) and oversold (25), plus an optional centerline 50 to better interpret momentum.
It incorporates a high volume visual filter to confirm signals and avoid false entries in low-interest conditions. Buy and sell signals are based on RSI crosses in extreme zones, optionally filtered by volume to improve reliability.
You can enable automatic alerts to receive notifications when important signals occur.
How to use:
Watch the RSI and its position relative to overbought/oversold zones and the 50 line.
Wait for high volume confirmation for greater reliability (you can disable this filter if preferred).
Use buy and sell signals alongside your price action and overall context analysis to make decisions.
Set alerts to not miss opportunities.
Important Notice:
This indicator is a support tool, not a complete strategy. Trading involves risks and no guarantees. Always use risk management and test the indicator on a demo before using it live.
Personal note:
This is my first script and I would love to receive constructive feedback to improve and offer better tools to the community. Thanks for trying it!
Motivational phrase:
“No risk, no reward.”
RSI Momentum Divergence Zones [ChartPrime]⯁ OVERVIEW
RSI Momentum Divergence Zones is a hybrid oscillator and chart overlay tool that detects RSI-based momentum divergences and projects them as key zones on the chart. By combining RSI divergence logic with horizontal level plotting, this indicator reveals high-probability support and resistance areas where price has historically reacted to hidden or classic divergences.
⯁ KEY FEATURES
Momentum-Based RSI Source:
Instead of the classic RSI input, this tool uses the momentum of price as the RSI source:
rsiSrc = ta.mom(close, 10)
This emphasizes acceleration and deceleration of price moves, sharpening divergence signals and making them more responsive to early shifts in momentum.
Automatic Divergence Detection (Optional):
When enabled, the indicator continuously scans for:
— Bullish Divergence : Price makes a Lower Low while RSI forms a Higher Low
— Bearish Divergence : Price makes a Higher High while RSI forms a Lower High
It ensures divergence is valid by checking the spacing between pivots (min 5, max 50 bars).
Divergence Labels & Markers (RSI Pane + Chart):
When a valid divergence is detected:
— On RSI pane:
Labels appear at HL/LH points (“Bull” / “Bear”)
Colored lines show pivot structures
— On price chart:
Labels (“▲ Bull” / “Bear ▼”) mark price pivot that triggered the divergence
Lines highlight the exact price level at the divergence origin
Divergence Zones / Levels (Toggleable):
The indicator projects horizontal zones across the chart based on confirmed divergence points.
These levels dynamically extend as long as price respects them, and auto-expire once broken.
They act as S/R levels created by market imbalance caused by divergence reactions.
Dynamic Zone Extension Logic:
Once plotted, divergence levels will extend to the right:
— If price respects the level, the zone keeps growing
— If broken in the opposite direction, the level stops extending and turns dashed (visually showing break)
Zone Layering and Limit Control:
You can limit the number of simultaneous zones shown on the chart (e.g., 10 most recent).
Old zones automatically expire and are removed to keep the chart clean and focused.
Color Customization and Intensity:
Different colors for bullish and bearish zones let you easily distinguish trend direction.
Background fill, line width, and transparency are all adjustable.
Clean Zone Management with Arrays:
Behind the scenes, the script uses custom divLevel type arrays to manage plotted levels, ensuring they stay up-to-date, extend correctly, and delete once invalidated.
⯁ USAGE
Use bullish divergence zones as potential demand areas and bearish ones as supply zones.
Combine RSI pane labels with price-level zones to confirm strength of reversal.
Watch for price approaching a divergence level to anticipate reactions or breakouts.
Use divergence levels as trade triggers, stop-loss guides, or take-profit markers.
Limit signal count using the “Qty Divergence Zones” setting to reduce chart clutter.
Enable divergence detection only when you want to focus on key structural zones — ideal for swing or positional setups.
⯁ CONCLUSION
RSI Momentum Divergence Zones blends oscillator divergence logic with price action structure to uncover hidden strength or weakness in the market. With flexible zone plotting and clean visual signals, this tool empowers traders to identify where momentum turns into structure — turning hidden signals into tradable edges.

Multi-Timeframe RSIRSI Divergence (Time-Based Engine)
This script is a powerful and highly customizable tool designed to automatically detect and display RSI divergences from up to three independent, user-defined timeframes directly on your chart. It eliminates the need to manually switch between timeframes to find these critical trading signals, allowing you to see long-term and short-term divergences all in one place.
The engine is built to be flexible, supporting both regular (reversal) divergences and hidden (trend-continuation) divergences. It's designed for traders who rely on divergence analysis as a core part of their strategy.
Key Features
Multi-Timeframe (MTF) Analysis: Configure and display divergences from up to three different timeframes simultaneously (e.g., show 4-Hour, Daily, and Weekly divergences on your 1-Hour chart). Each timeframe operates independently with its own settings.
Regular & Hidden Divergence: The script can detect both standard regular divergences that signal potential reversals and hidden divergences that suggest a trend may continue.
Configurable Pivot Strength: You have full control over the sensitivity of pivot detection. The 'Left Strength' and 'Right Strength' settings allow you to define what qualifies as a significant price pivot, filtering out market noise.
Bar Count Filter: Refine your signals by setting the minimum and maximum number of bars allowed between two pivots. This ensures you only see divergences that fit your specific strategic timeframe.
Dedicated Alerts: Each of the three timeframes has its own "Enable Alerts" toggle. When a new divergence line is drawn on the chart for a specific timeframe, a corresponding alert can be triggered, ensuring you never miss a potential setup.
Full Visual Customization: Tailor the look and feel of the indicator to your preference. Each timeframe has unique color settings for its bullish and bearish lines, allowing for easy visual identification. You can also toggle the visibility of various chart markers to keep your view clean.
How to Use
1. Add the indicator to your chart.
2. Open the Settings panel.
3. For each timeframe you wish to use (1, 2, or 3), check the "Enable Timeframe" box.
4. Select the desired Timeframe, RSI Length, and Pivot Strength for each active engine.
5. Adjust the Min/Max Bars filter to match your trading style.
6. If you want to receive notifications, check the "Enable Alerts" box for the desired timeframe(s). Then, create an alert using TradingView's alert manager, selecting the indicator and choosing the "Any alert() function call" option.

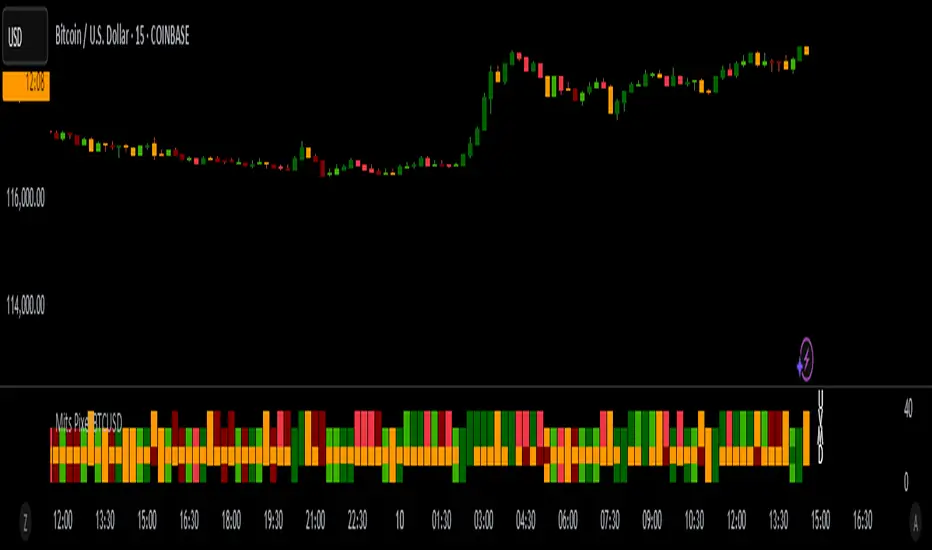
Mits Pixel BTCUSDStrategy
Using Rsi Stochastic, Hull Moving Average, Price Action and volume differences to get signals
HOW IT WORKS
Pixel parts :
- (U) The first pixel is a pixel that shows a trend during an uptrend, a trend when the market is considered bullish (above the MA line)
- (V) The second pixel is the volume pixel, showing the up and down movement of the buy / sell volume .
- (M) The third pixel is the momentum pixel, showing the market momentum whether it is overbought or oversold.
- (D) The fourth pixel is a pixel that shows a trend during a downtrend, a trend when the market is considered bearish (below the MA line)
When the price opens above the MA line, 3 pixels will appear, namely the first Pixel which is called the Trend up Pixel, Pixel Volume , and also the Momentum Pixel.
When the price opens below the MA line, 3 pixels will appear, namely Pixel Volume , Pixel Momentum, and the bottom one is the Pixel Down Trend.
* Pixel up trend (appears when the open is above the MA line)
- The pixel will show a solid green color when a gap up is opened or volume up, then the close price is greater than the open price.
- The pixel will show a light green color if there is normal strengthening (the close is bigger than the previous day's close without creating a gap up), then the close price is bigger than the open price.
- Pixel will show yellow color if it meets several criteria, for example, close is equal to open or close is bigger than the previous close but close is smaller than open.
- The pixel will show a dark red color when there is attenuation and a Gap down is created, then the close price is smaller than the open price.
- Pixel will show red color if there is normal weakening (close is smaller than the close of the previous day without creating a gap down), then the close price is smaller than the open price.
* Pixel down trend (appears when the open is below the Moving Average)
The pixel color indication is the same as the Trend up Pixel
* Volume Pixel
- The pixel is dark green when there is an increase and a gap up is created and the volume for that day is bigger than the volume of the previous day.
- The pixel will be green if there is a normal strengthening and also the volume for that day is greater than the volume of the previous day, or there is a gap up but the volume is smaller than the volume of the previous day.
- The pixel is yellow if it meets several conditions, for example, the volume of the day is the same as the volume of the previous day.
- The pixel is dark red when there is weakness and a Gap down is created and also the volume of the day's weakness is greater than the volume of the previous day.
- The pixel is red if there is normal weakening and also the volume of the day's weakness is bigger than the previous day's volume , or if there is a gap down but the volume is smaller than the previous day's volume .
* Momentum Pixel (basically StochRSI combined with other HMA , TopBox (Resistance), BottomBox(Support)).
- The pixel is dark green when it meets several conditions, for example the golden cross is below 50.
- The pixel is green if it meets several conditions, for example a golden cross below 50 without Gap up.
- Pixel will be yellow if it meets several conditions, for example k is greater than d and k has entered the overbought area (greater than 80).
- Pixel is dark red when it meets several conditions, for example k is smaller than d and k has entered the overbought area.
- Pixel is red when it meets several conditions, for example k is smaller than d and k is greater than 50 and k is less than 80.
Bar Color
Dark Green : Price Up + Volume Up
Green : Price Up + Volume Down
Dark Red : Price Down + Volume Up
Red : Price Down + Volume Down
Too many details that cannot be detailed one by one , but in broad outline as explained above.
HOW TO USE
* Signals Buy
- Strong Buy : All pixels are green, and Momentum Pixel is dark green.
- Normal Buy : All pixels are green or two dark green (one of them must momentum pixel) and one yellow.
- Spek Buy : * Two green pixels (one of them must momentum pixel) and one yellow or 1 green/dark green in momentum pixel, and other pixels yellow
* Signals Sell
- Strong Sell : All pixels are red, and Momentum Pixel is dark red.
- Normal Sell : All pixels are either red or two dark red (one of them must momentum pixel) and one yellow.
- Spek Sell : Two red pixels (one of them must momentum pixel) and one yellow or 1 dark red in momentum pixel, and other pixels yellow
- Warning Sell : Momentum pixels are dark red, regardless of the color of the other pixels.
* Best use for trading in BTCUSD markets
* Change from just an invitation script to a protected script for publication.
* Final Release
Thanks for Moderators
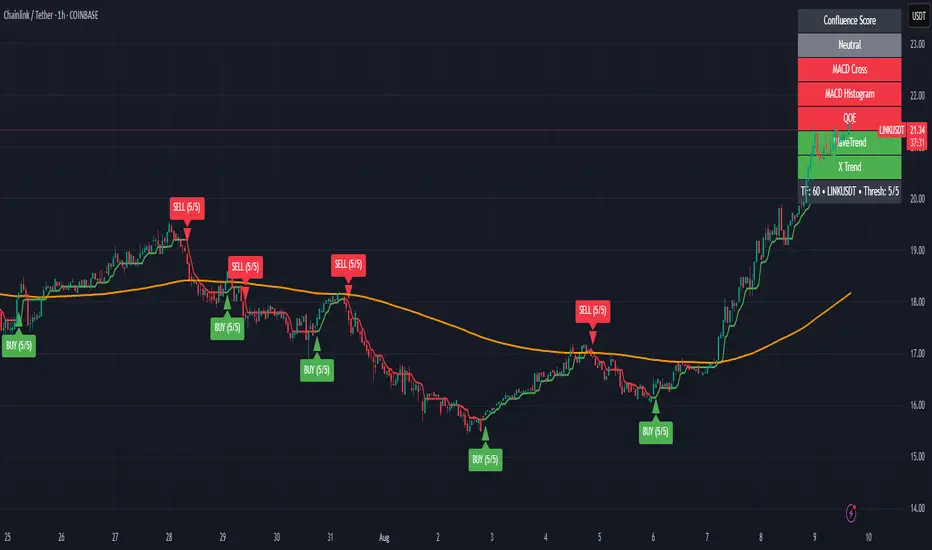
Zabbo Confluence Indicator + DashboardDescription
This script combines the power of multiple proven swing trend indicators into a single, unified confluence system. A trade signal is generated when the specified number of indicators align in the same bullish or bearish direction, helping traders identify high-probability long or short opportunities.
The script includes an on-chart dashboard that displays the current status of each individual indicator, along with the overall confluence score, allowing you to visually track trend alignment as market conditions evolve.
Included Indicators:
Xtreme Trend – View Script
MACD (12-26-9) – View Script
MACD (144-34-9) Histogram – View Script
WaveTrend Oscillator – View Script
QQE MT4 (Glaz-Modified by JustUncleL) – View Script
Signal Conditions:
A BUY signal is triggered when:
Xtreme Trend is Bullish
MACD (12-26-9) shows a bullish cross
MACD (144-34-9) histogram is increasing
WaveTrend Oscillator is bullish
QQE MT4 line crosses above its signal
A SELL signal is triggered when:
Xtreme Trend is Bearish
MACD (12-26-9) shows a bearish cross
MACD (144-34-9) histogram is decreasing
WaveTrend Oscillator is bearish
QQE MT4 line crosses below its signal
Users can enable or disable individual indicators in the settings and adjust the confluence threshold (from 1 to 5) to suit their trading style. They also have the ability to toggle off the Xtrend indicator, the 200 EMA, and the confluence dashboard.
Best Use
Performs best on higher timeframes such as 1H, 4H, and Daily.
Lower timeframes (<1H) and choppy, sideways markets may produce frequent signals with smaller spreads.
Increasing the confluence requirement reduces the number of signals, but increases the reliability of potential market tops and bottoms.
Key Features
Five popular trend/trading indicators in one script
Adjustable confluence threshold (1–5)
On-chart dashboard for quick signal confirmation
Customizable indicator inclusion/exclusion
Works across any market (forex, crypto, stocks, commodities)
Clean Multi-Indicator Alignment System
Overview
A sophisticated multi-indicator alignment system designed for 24/7 trading across all markets, with pure signal-based exits and no time restrictions. Perfect for futures, forex, and crypto markets that operate around the clock.
Key Features
🎯 Multi-Indicator Confluence System
EMA Cross Strategy: Fast EMA (5) and Slow EMA (10) for precise trend direction
VWAP Integration: Institution-level price positioning analysis
RSI Momentum: 7-period RSI for momentum confirmation and reversal detection
MACD Signals: Optimized 8/17/5 configuration for scalping responsiveness
Volume Confirmation: Customizable volume multiplier (default 1.6x) for signal validation
🚀 Advanced Entry Logic
Initial Full Alignment: Requires all 5 indicators + volume confirmation
Smart Continuation Entries: EMA9 pullback entries when trend momentum remains intact
Flexible Time Controls: Optional session filtering or 24/7 operation
🎪 Pure Signal-Based Exits
No Forced Closes: Positions exit only on technical signal reversals
Dual Exit Conditions: EMA9 breakdown + RSI flip OR MACD cross + EMA20 breakdown
Trend Following: Allows profitable trends to run their full course
Perfect for Swing Scalping: Ideal for multi-session position holding
📊 Visual Interface
Real-Time Status Dashboard: Live alignment monitoring for all indicators
Color-Coded Candles: Instant visual confirmation of entry/exit signals
Clean Chart Display: Toggle-able EMAs and VWAP with professional styling
Signal Differentiation: Clear labels for entries, X-crosses for exits
🔔 Alert System
Entry Notifications: Separate alerts for buy/sell signals
Exit Warnings: Technical breakdown alerts for position management
Mobile Ready: Push notifications to TradingView mobile app
Market Applications
Perfect For:
Gold Futures (GC): 24-hour precious metals trading
NASDAQ Futures (NQ): High-volatility index scalping
Forex Markets: Currency pairs with continuous operation
Crypto Trading: 24/7 cryptocurrency momentum plays
Energy Futures: Oil, gas, and commodity swing trades
Optimal Timeframes:
1-5 Minutes: Ultra-fast scalping during high volatility
5-15 Minutes: Balanced approach for most markets
15-30 Minutes: Swing scalping for trend following
🧠 Smart Position Management
Tracks implied position direction
Prevents conflicting signals
Allows trend continuation entries
State-aware exit logic
⚡ Scalping Optimized
Fast-reacting indicators with shorter periods
Volume-based confirmation reduces false signals
Clean entry/exit visualization
Minimal lag for time-sensitive trades
Configuration Options
All parameters fully customizable:
EMA Lengths: Adjustable from 1-30 periods
RSI Period: 1-14 range for different market conditions
MACD Settings: Fast (1-15), Slow (1-30), Signal (1-10)
Volume Confirmation: 0.5-5.0x multiplier range
Visual Preferences: Colors, displays, and table options
Risk Management Features
Clear visual exit signals prevent emotion-based decisions
Volume confirmation reduces false breakouts
Multi-indicator confluence improves signal quality
Optional time filtering for session-specific strategies
Best Use Cases
Futures Scalping: NQ, ES, GC during active sessions
Forex Swing Trading: Major pairs during overlap periods
Crypto Momentum: Bitcoin, Ethereum trend following
24/7 Automated Systems: Algorithmic trading implementation
Multi-Market Scanning: Portfolio-wide signal monitoring

Market Regime Matrix [Alpha Extract]A sophisticated market regime classification system that combines multiple technical analysis components into an intelligent scoring framework to identify and track dominant market conditions. Utilizing advanced ADX-based trend detection, EMA directional analysis, volatility assessment, and crash protection protocols, the Market Regime Matrix delivers institutional-grade regime classification with BULL, BEAR, and CHOP states. The system features intelligent scoring with smoothing algorithms, duration filters for stability, and structure-based conviction adjustments to provide traders with clear, actionable market context.
🔶 Multi-Component Regime Engine Integrates five core analytical components: ADX trend strength detection, EMA-200 directional bias, ROC momentum analysis, Bollinger Band volatility measurement, and zig-zag structure verification. Each component contributes to a sophisticated scoring system that evaluates market conditions across multiple dimensions, ensuring comprehensive regime assessment with institutional precision.
// Gate Keeper: ADX determines market type
is_trending = adx_value > adx_trend_threshold
is_ranging = adx_value <= adx_trend_threshold
is_maximum_chop = adx_value <= adx_chop_threshold
// BULL CONDITIONS with Structure Veto
if price_above_ema and di_bullish
if use_structure_filter and isBullStructure
raw_bullScore := 5.0 // MAXIMUM CONVICTION: Strong signals + Bull structure
else if use_structure_filter and not isBullStructure
raw_bullScore := 3.0 // REDUCED: Strong signals but broken structure
🔶 Intelligent Scoring System Employs a dynamic 0-5 scale scoring mechanism for each regime type (BULL/BEAR/CHOP) with adaptive conviction levels. The system automatically adjusts scores based on signal alignment, market structure confirmation, and volatility conditions. Features decision margin requirements to prevent false regime changes and includes maximum conviction thresholds for high-probability setups.
🔶 Advanced Structure Filter Implements zig-zag based market structure analysis using configurable deviation thresholds to identify significant pivot points. The system tracks Higher Highs/Higher Lows (HH/HL) for bullish structure and Lower Lows/Lower Highs (LL/LH) for bearish structure, applying structure veto logic that reduces conviction when price action contradicts the underlying trend framework.
// Define Market Structure (Bull = HH/HL, Bear = LL/LH)
isBullStructure = not na(last_significant_high) and not na(prev_significant_high) and
not na(last_significant_low) and not na(prev_significant_low) and
last_significant_high > prev_significant_high and last_significant_low > prev_significant_low
isBearStructure = not na(last_significant_high) and not na(prev_significant_high) and
not na(last_significant_low) and not na(prev_significant_low) and
last_significant_low < prev_significant_low and last_significant_high < prev_significant_high
🔶 Superior Engine Components Features dual-layer regime stabilization through score smoothing and duration filtering. The score smoothing component reduces noise by averaging raw scores over configurable periods, while the duration filter requires minimum regime persistence before confirming changes. This eliminates whipsaws and ensures regime transitions represent genuine market shifts rather than temporary fluctuations.
🔶 Crash Detection & Active Penalties Incorporates sophisticated crash detection using Rate of Change (ROC) analysis with severity classification. When crash conditions are detected, the system applies active penalties (-5.0) to BULL and CHOP scores while boosting BEAR conviction based on crash severity. This ensures immediate regime response to major market dislocations and drawdown events.
// === CRASH OVERRIDE (Active Penalties) ===
is_crash = roc_value < crash_threshold
if is_crash
// Calculate crash severity
crash_severity = math.abs(roc_value / crash_threshold)
crash_bonus = 4.0 + (crash_severity - 1.0) * 2.0
// ACTIVE PENALTIES: Force bear dominance
raw_bearScore := math.max(raw_bearScore, crash_bonus)
raw_bullScore := -5.0 // ACTIVE PENALTY
raw_chopScore := -5.0 // ACTIVE PENALTY
❓How It Works
🔶 ADX-Based Market Classification The Market Regime Matrix uses ADX (Average Directional Index) as the primary gatekeeper to distinguish between trending and ranging market conditions. When ADX exceeds the trend threshold, the system activates BULL/BEAR regime logic using DI+/DI- crossovers and EMA positioning. When ADX falls below the ranging threshold, CHOP regime logic takes precedence, with maximum conviction assigned during ultra-low ADX periods.
🔶 Dynamic Conviction Scaling Each regime receives conviction ratings from UNCERTAIN to MAXIMUM based on signal alignment and score magnitude. MAXIMUM conviction (5.0 score) requires perfect signal alignment plus favorable market structure. The system progressively reduces conviction when signals conflict or structure breaks, ensuring traders understand the reliability of each regime classification.
🔶 Regime Transition Management Implements decision margin requirements where new regimes must exceed existing regimes by configurable thresholds before transitions occur. Combined with duration filtering, this prevents premature regime changes and maintains stability during consolidation periods. The system tracks both raw regime signals and final regime output for complete transparency.
🔶 Visual Regime Mapping Provides comprehensive visual feedback through colored candle overlays, background regime highlighting, and real-time information tables. The system displays regime history, conviction levels, structure status, and key metrics in an organized dashboard format. Regime changes trigger immediate visual alerts with detailed transition information.
🔶 Performance Optimization Features efficient array management for zig-zag calculations, smart variable updating to prevent recomputation, and configurable debug modes for strategy development. The system maintains optimal performance across all timeframes while providing institutional-grade analytical depth.
Why Choose Market Regime Matrix ?
The Market Regime Matrix represents the evolution of market regime analysis, combining traditional technical indicators with modern algorithmic decision-making frameworks. By integrating multiple analytical dimensions with intelligent scoring, structure verification, and crash protection, it provides traders with institutional-quality market context that adapts to changing conditions. The sophisticated filtering system eliminates noise while preserving responsiveness, making it an essential tool for traders seeking to align their strategies with dominant market regimes and avoid adverse market environments.

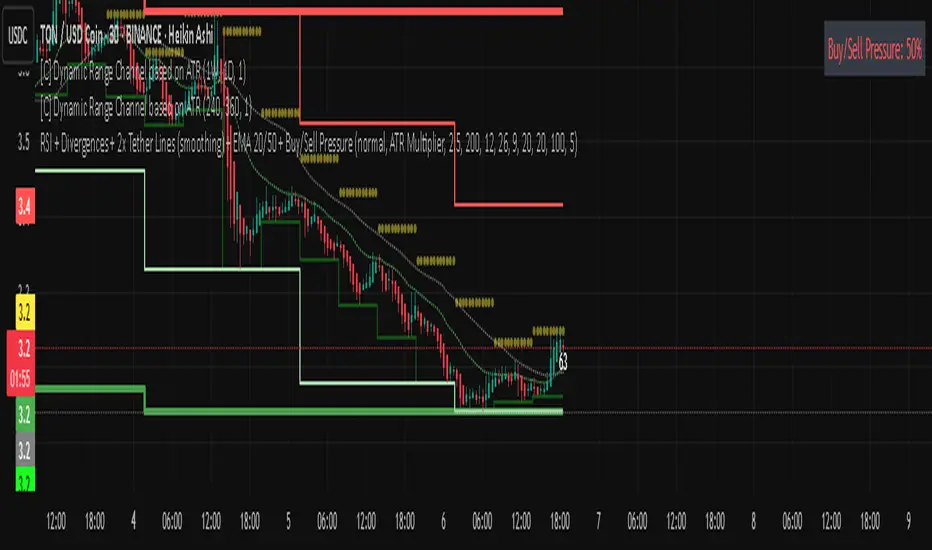
平滑周期RSI带中间线和交叉 (cRSI交叉) Cyclic RSI with Midline and Cross “平滑周期RSI带中间线和交叉”是一个基于周期平滑的RSI指标,结合长期和短期cRSI线生成金叉/死叉信号,帮助识别趋势反转。指标包括动态上下限、动态中间线和静态超买/超卖线(30/70),适合捕捉市场周期性波动。主要功能:长期/短期 cRSI:长期cRSI(紫红色)与短期cRSI(橙色,可调周期)形成金叉(看涨)/死叉(看跌)信号。
动态中间线:黄色中间线(上下限均值),作为趋势中性参考。
动态上下限:自适应上下限(青色),反映市场波动范围。
信号过滤:可选中间线过滤,减少噪音信号。
用户可调:支持调整短期周期长度、颜色及信号过滤开关。
警报支持:内置金叉/死叉警报,方便交易通知。
更新说明:
现已升级至 Pine Script 第6版,优化语法、修复兼容性问题(如透明度处理),并新增动态标签提示推荐短期周期长度。用户可通过设置面板自由调整参数,适应不同市场和时间框架。使用建议:默认参数:主导周期=20,短期周期=5(建议为长期周期一半)。
结合金叉/死叉、中间线和动态上下限,确认买卖信号。
在TradingView警报中启用金叉/死叉通知。
欢迎社区用户测试并提供反馈!
结合KDJ指标使用,叠加均线,简直不要太好,在关键位置,出现关键信号,祝各位在使用中能多多反馈。
Overview:
The "Smoothed Cyclic RSI with Midline and Cross" is a cycle-smoothed RSI indicator that generates Golden Cross (bullish) and Death Cross (bearish) signals using long-term and short-term cRSI lines, aiding in trend reversal identification. It includes dynamic upper/lower bands, a dynamic midline, and static overbought/oversold levels (30/70), ideal for capturing market cyclic fluctuations.Key Features:Long/Short cRSI: Long-term cRSI (fuchsia) and short-term cRSI (orange, adjustable period) form Golden Cross (bullish) and Death Cross (bearish) signals.
Dynamic Midline: Yellow midline (average of upper/lower bands) serves as a neutral trend reference.
Dynamic Bands: Adaptive upper/lower bands (aqua) reflect market volatility range.
Signal Filtering: Optional midline-based filtering to reduce noise.
User Adjustable: Supports customization of short-term period, color, and filtering toggle.
Alert Support: Built-in alerts for Golden/Death Cross signals for convenient trade notifications.
Update Notes:
Now upgraded to Pine Script Version 6, with optimized syntax, fixed compatibility issues (e.g., transparency handling), and added dynamic label to suggest optimal short-term period. Users can freely adjust parameters via the settings panel to suit various markets and timeframes.Usage Tips:Default Parameters: Dominant cycle = 20, short-term cycle = 5 (suggested as half of long-term cycle).
Combine Golden/Death Cross, midline, and dynamic bands for trade signal confirmation.
Enable Golden/Death Cross alerts in TradingView for notifications.
Community Note:
This indicator has been updated to Pine Script Version 6, resolving all known issues (e.g., input.int and transparency). It now includes adjustable short-term cRSI period/color and dynamic period suggestion labels. Please test across markets and timeframes and share your feedback!Pro Tip: Pair with the KDJ indicator and overlay moving averages for enhanced performance. At key levels with critical signals, this combo is unbeatable. Happy trading, and please share your feedback with the community!

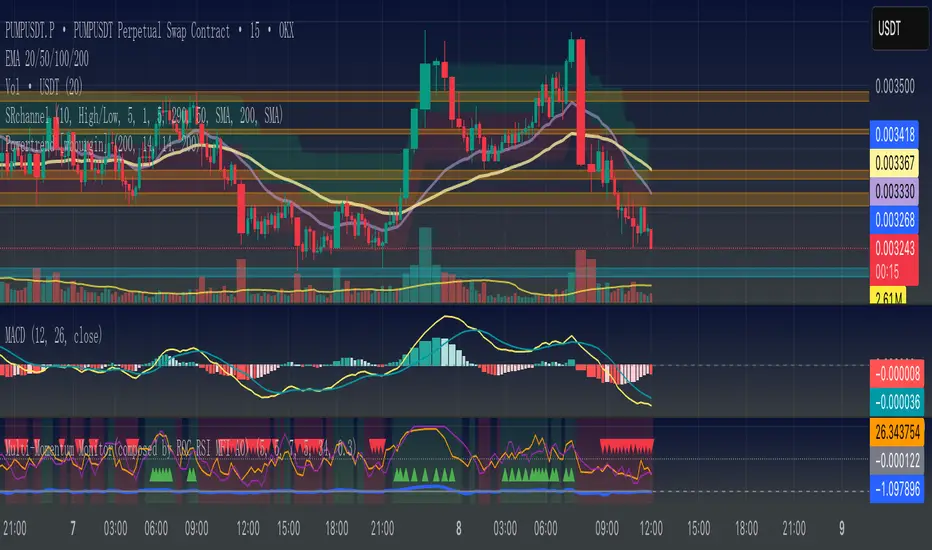
Multi-Momentum Monitor(composed by ROC RSI MFI AO)Multi-Momentum Monitor (Multi-Momentum Monitor) instructions for use
Version: v6 revised version
Applicable objects: currency circle, stock market, futures short-term/swing trader
effect:
Integrate ROC (momentum rate of change), RSI (relative strength), MFI (capital flow), and AO (oscillator) together
Judge the direction and intensity of the current market momentum through “multi-index resonance”
Low latency, easy to configure, suitable for market tracking to assist in judging “pullback vs reversal”
1、Overview of indicator functions
Legend description:
Background color: Green = Strong kinetic energy of multiple parties (≥3/4 of the indicators are in the same direction), red = strong kinetic energy of the empty party (≤1/4 of the indicators are in the same direction)
Triangle mark: The green triangle at the bottom = all long signals of the 4/4 indicator; the red triangle at the top = all short signals of the 4/4 indicator
Four curves:
Blue = ROC (%)
Orange = RSI
Purple = MFI
Gray = AO
2、Explanation of the four core indicators (simple and easy-to-understand version)
Key points of interpretation of the role of indicators
The ROC price momentum rate of change reflects the speed of price rise/fall. ROC is greater than the threshold = long acceleration, less than the-threshold = short acceleration
RSI relative strength index RSI > 50 is too much, RSI <50 is empty
The MFI capital flow indicator combines transaction volume and price. MFI>50 indicates the net inflow of funds, and <50 indicates the net outflow of funds.
AO Super Oscillator fast line average price-slow line average price, greater than 0 is too much, less than 0 is too short
3、Parameter configuration guide
Explanation of common parameters:
ROC cycle /threshold: ROC calculation cycle and kinetic energy sensitivity. Short cycle + low threshold = sensitive (but noisy)
RSI cycle: the shorter the more sensitive, the longer the more stable
MFI cycle: it is recommended to be close to the RSI cycle
AO fast/slow cycle: commonly used 5/34, 5/21 is also available
Background color resonance judgment: ≥3 indicators in the same direction, time scale background
4、How to read the signal
Background color signal (distinguish between trend strength and weakness)
Green background: at least 3 indicators, long positions → multi-party dominance
Red background: At least 3 indicators, bears → bears dominate
No background: the kinetic energy is chaotic, and the probability of shock is large
Triangle mark (extremely strong signal)
Green triangle at the bottom: 4/4 multi-head → super multi-party kinetic energy
Red triangle at the top: 4/4 bears → Super empty kinetic energy
5、Actual usage cases
Short-term breakthrough trading
Observe the picture for 15 minutes, when the background turns green + a green triangle mark appears
There is no obvious empty signal at the upper level (1H)
Follow up at the breaking point and put the stop loss at the lowest
Distinction between callback and reversal
Pullback: The price has fallen but the background is still green, and many indicators have not all turned over.
Reversal: The price drops and the background turns red, and a red triangle appears at the same time
6、Precautions
The signal is not 100% accurate, it must be combined with multiple factors such as price structure, support and resistance.
⏳ Stronger resonance at different cycle levels (such as 15min warning + 1H confirmation)
⚠ The misjudgment rate of the volatile market is high, it is recommended to filter it in combination with the trend direction
Indicators are only an aid, not a substitute, please cooperate with your personal strategy and risk control
📊 多动能监控器(Multi-Momentum Monitor)使用说明
版本:v6 修正版
适用对象:币圈、股市、期货短线/波段交易者
作用:
把 ROC(动量变化率)、RSI(相对强弱)、MFI(资金流量)、AO(震荡指标)整合在一起
通过“多指标共振”判断当前市场动能的方向和强度
低延迟、易配置,适合盯盘辅助判断“回调 vs 反转”
0️⃣ 指标核心组成
ROC 动能速度 衡量价格变化速度,反应趋势衰竭最直接 周期(默认 5)
RSI 短周期 衡量上涨动能比例 周期(默认 5)+ 阈值(50)
MFI 短周期 加入成交量权重的 RSI 周期(默认 7)+ 阈值(50)
AO 方向强弱 快速可视化趋势动能方向 快线周期(默认 5)、慢线周期(默认 34)
1️⃣ 指标功能概览
图例说明:
背景色:绿色 = 多方动能强(≥3/4指标同向),红色 = 空方动能强(≤1/4指标同向)
三角标记:底部绿色三角 = 4/4指标全部多头信号;顶部红色三角 = 4/4指标全部空头信号
四条曲线:
蓝色 = ROC (%)
橙色 = RSI
紫色 = MFI
灰色 = AO
2️⃣ 四大核心指标解释(简单易懂版)
指标 作用 解读关键点
ROC 价格动量变化率 反映价格上涨/下跌的速度,ROC大于阈值=多头加速,小于-阈值=空头加速
RSI 相对强弱指标 RSI > 50 偏多,RSI < 50 偏空
MFI 资金流量指标 结合成交量和价格,MFI > 50 表示资金净流入,< 50 表示资金净流出
AO 超级震荡指标 快线均价 - 慢线均价,大于0偏多,小于0偏空
3️⃣ 参数配置指南
常用参数解释:
ROC 周期 / 阈值:ROC计算周期和动能敏感度。短周期 + 低阈值 = 灵敏(但噪音多)
RSI 周期:越短越敏感,越长越稳
MFI 周期:建议与RSI周期接近
AO快/慢周期:常用5/34,也可5/21
背景色共振判断:≥3个指标同方向时标背景
4️⃣ 如何读信号
📌 背景色信号(趋势强弱区分)
绿色背景:至少3个指标多头 → 多方主导
红色背景:至少3个指标空头 → 空方主导
无背景:动能混乱,震荡概率大
📌 三角标记(极强信号)
底部绿色三角:4/4 多头 → 超强多方动能
顶部红色三角:4/4 空头 → 超强空方动能
5️⃣ 实战用法案例
短线突破交易
观察15分钟图,当背景转绿 + 出现绿色三角标记
上级别(1H)无明显空方信号
在突破点跟进,止损放在前低
回调与反转区分
回调:价格回落但背景仍为绿色,多指标未全部翻空
反转:价格回落并背景翻红,同时出现红色三角
6️⃣ 注意事项
📉 信号不是100%准确,要结合价格结构、支撑阻力等多因素
⏳ 不同周期级别共振更强(如15min预警 + 1H确认)
⚠ 震荡市误判率高,建议结合趋势方向过滤
💡 指标只是辅助,不是替代品,请配合个人策略与风险控制
Rsi bar, divergences, tether line, ema 20,50 -Ema 20,50
-Tether Line dominance
-Buy/sell pressure
-Rsi last candle
-byu sell signal
-rsi divergence
-macd divergence
-Coloured candles 25,30 rsi and 70 rsi
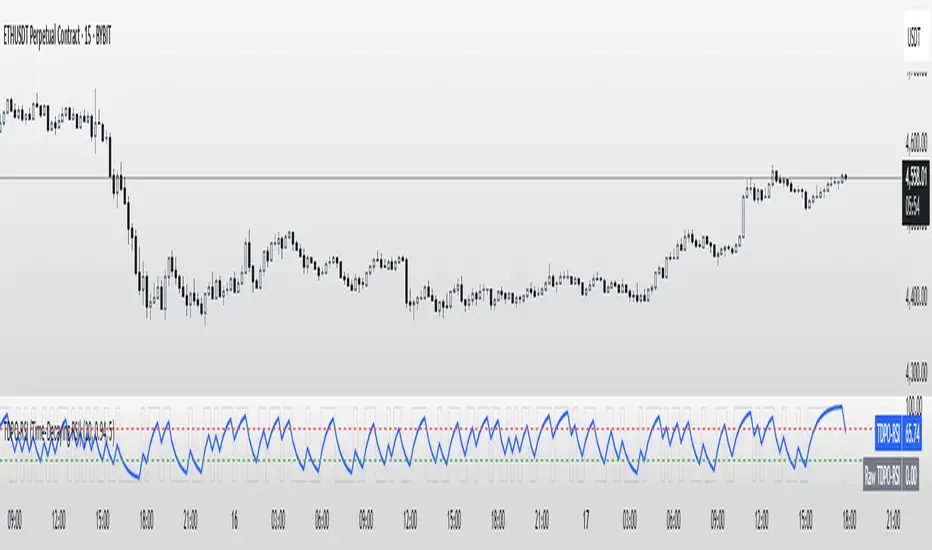
TDPO-RSI (Time-Decaying Percentile RSI)TDPO-RSI (Time-Decaying Percentile RSI)
TDPO-RSI is a modern, statistically-enhanced momentum indicator that improves on traditional RSI by using percentile-based analysis with exponential time decay. Instead of averaging gains and losses equally, this indicator ranks them by size and weights recent data more heavily—resulting in a more responsive and noise-resistant signal.
How it works:
Calculates percentile rank of gains and losses over a lookback window
Applies a decay factor (lambda) to give more weight to recent price action
Outputs a percentile-based RSI value between 0 and 100
Optional smoothing via EMA for clearer crossover signals
Key Uses:
Identify overbought/oversold zones (default: 70/30)
Use raw vs. smoothed RSI crossovers for entries
Detect momentum shifts earlier than traditional RSI
Suitable for scalping, trend continuation, and reversal setups
Inputs:
Lookback Length: Number of bars used for percentile calculation
Decay Factor (lambda): How quickly older data fades in influence (0.80–0.99)
Smoothing EMA: Smooths the final output to reduce noise
Tip: Combine with price structure and volume for best results. Higher timeframes can be used for trend context, while lower timeframes help with precise entries.
This tool is ideal for traders who want adaptive momentum analysis rooted in statistical behavior.
Trader's Club IndicatorTrader’s Club Indicator
The Trader’s Club Indicator is an advanced confluence-based tool combining Bollinger Bands , Relative Strength Index (RSI) , VWAP with multi-band overlays , and an intelligent chained divergence detection engine. It identifies potential buy/sell setups by aligning price extremes with momentum shifts and volume-weighted trends. The “E” signal highlights enhanced entry opportunities based on RSI divergence and price candle behaviour — offering a timing edge for informed traders.
TRADING METHOD
This indicator works best on 1-Minute candles. Tested it successfully on XAUUSD.
Buy signal: 'E' in a Blue box.
Sell signal: 'E' in a Red box.
Chained Divergence: White dot on the top or bottom of a candle. This shows possibility of a reversal from that zone.
Use the Buy/Sell signals in conjunction with the VWAP levels. If the Buy/Sell Signals form at VWAP and a key support/resistance level, that is an additional confluence.
Disclaimer
This indicator is for informational and educational purposes only. Trading involves risk, and you are solely responsible for your decisions. Do not rely solely on the buy/sell ‘E’ signals — it’s crucial to use additional confirmation, context, and personal judgment before placing trades. Always practice proper risk management and consider combining this indicator with broader technical or fundamental confluences.


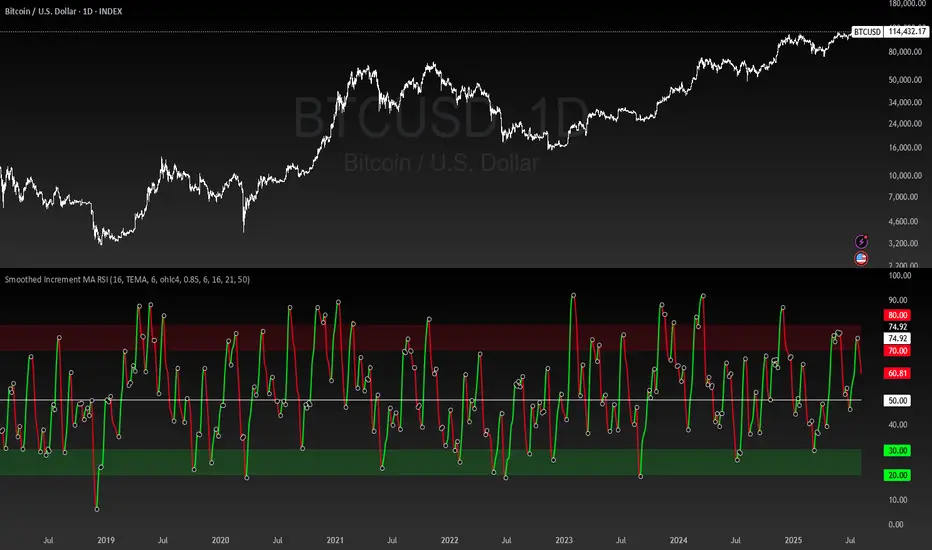
Smoothed Increment MA RSI | MisinkoMasterThe Smoothed Increment MA RSI is my latest creation, being a versatile tool allowing traders and investors not only to catch reversals in Trend, but also catch high value and low value zones, working both as a Trend Following and Mean Reverting indicator for everyone's usage.
Use Cases:
1. Mean Reversion/Value Spotting:
This indicator, because of being based on the RSI, can catch high value and low value zones,
and if you experiment with conditions like:
Entry - values in the green zone
Exit - values in the red zone and downtrend
You will find very good trades:
2. Trend Reversals:
The main usage of this indicator, this is for what it has been intended, so it must excell at it!
When the line is green a reversal up is happening, when red, reversal down.
This indicator will provide you with fast reversals, no matter the asset - it will always do it's job.
Change the asset? No problem!
COINBASE:ETHUSD
But it also works on meme coins like CRYPTOCAP:DOGE
How it works?
The Smoothed Increment MA RSI works like so:
1. Calculate the RSI/Relative Strength Index, which will be the core of this all
2. Calculate the increment, this will be used by comparing the Moving Average, ATR/Average True Range and Volume values now to past values with different weights
3. Now it is time to check the RSI's ROC and apply the increment to it, making a much more volatile RSI
4. Now we just smooth the values using multiple Moving Averages over a smoothing period at base set to 6, but can be adjusted
5. Trend logic, this one depends on everyone, some may set it to crossing the value of 50, some may set it to something else, but for the purpose of this indicator I found the best working case to be just comparing if the value of the RSI has grown or decreased.
There will be also black dots with white borders plotted, this is for easier spotting of reversals.
This indicator also uses volume, so you have to check this on something with volume available.
I left all the settings available for changing, so you can adjust it to whatever you like and get the best out of this!
Mayfair Fx Scalper✅ Mayfair FX Scalper — By EastWave Capital
The Mayfair FX Scalper is a precision-focused, closed-source indicator designed for short-term intraday trading, particularly scalping on lower timeframes such as 1-minute, 3-minute, and 5-minute charts. This tool is developed by EastWave Capital and is based on a combination of Relative Strength Index (RSI) extremes and specific candlestick structure patterns to detect potential exhaustion and reversal points in the market.
🔍 How It Works:
The algorithm operates by evaluating three core elements:
RSI Extremes:
RSI is calculated using default settings.
Buy signals are considered only when the RSI on the previous candle is below 22 (oversold), and the current candle is bullish, while the previous one was bearish.
Sell signals are considered when the RSI on the previous candle is above 78 (overbought), and the current candle is bearish, while the previous one was bullish.
Candle Confirmation Logic:
The system waits for candle confirmation (e.g., shift in bullish/bearish structure) rather than triggering signals based on RSI alone.
This avoids false triggers in strong trends and filters weak entries.
SL/TP Estimation (Visual):
While not automatically placing orders, the indicator can optionally display lines or small labels showing a Stop Loss at the previous swing high/low (±0.5) and TP levels at 1R, 2R, and 3R based on that stop.
These visual aids help traders plan risk/reward and exits manually.
📈 How to Use:
Timeframes: Best suited for 1M, 3M, and 5M charts
Markets: Works well on Gold (XAU/USD), Forex majors, Indices, and Crypto
Session: Performs best during high volatility sessions (London & NY)
Use Case:
Wait for a signal label to appear after a clear momentum move.
Confirm price action and trend context.
Use provided visual SL/TP labels or apply your manual RR planning.
Combine with structure breaks, FVG zones, or liquidity sweeps for confluence.
⚠️ Important Notes:
This indicator does not repaint.
No automatic trades are executed. Signals are visual.
Not intended for use in isolation; best when combined with proper trade management and confirmation tools.
Past performance does not guarantee future results. Always manage risk appropriately

RSI de Loquy H4 (HMA + ALMA + Régression)📌 Indicator Name: RSI de Loquy H4 (HMA + ALMA + Regression)
🧠 Description:
This custom indicator is designed for H4 (4-hour) timeframes and combines advanced smoothing techniques to refine RSI analysis:
✅ HMA (Hull Moving Average) is applied to the price before computing the RSI. This helps reduce noise and respond faster to price action compared to traditional moving averages.
✅ The resulting RSI is recalibrated to a symmetrical range from -100 to +100, making trend bias more visually intuitive.
✅ A second smoothing using ALMA (Arnaud Legoux Moving Average) is applied to the recalibrated RSI for enhanced signal clarity.
✅ A linear regression line is plotted on the recalibrated RSI to help detect directional momentum and trend shifts.
📈 Visual Features:
Cyan line: RSI mapped from -100 to +100
Orange line: ALMA smoothed RSI
White line: Linear regression of RSI
Reference zones:
+70: Potential oversold (buy watch)
0: Neutral line
–70: Potential overbought (sell watch)
⚙️ Optimized for H4 timeframe, but adaptable for other timeframes with parameter tuning.
