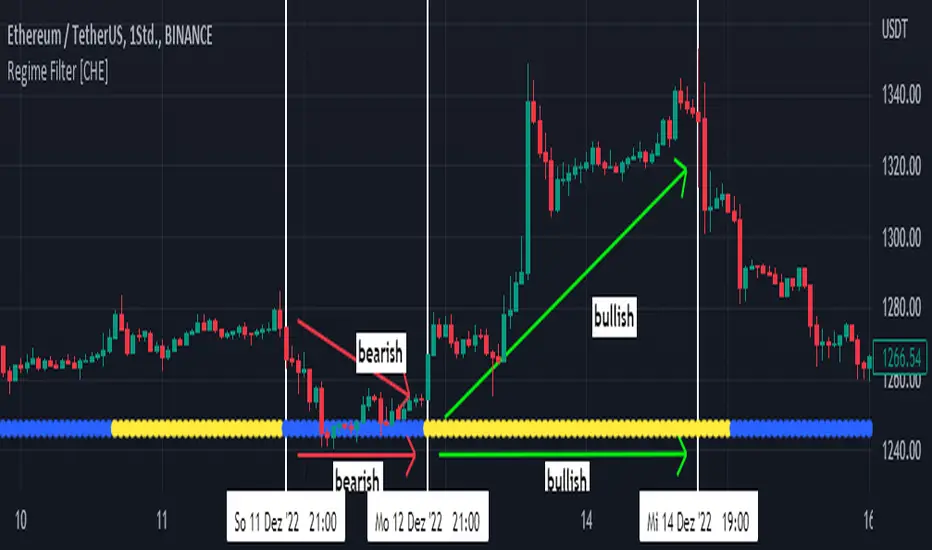
Regime Filter [CHE]About:
A market regime filter is a tool used by traders and investors to identify the current state or "regime" of the market and adjust their investment strategies accordingly. This can involve identifying trends in market behavior, such as bullish or bearish trends, and using that information to make decisions about which assets to buy or sell.
Market regime filters can be based on a variety of factors, including economic indicators, market sentiment, and technical analysis. They are often used in conjunction with other trading strategies and can help traders and investors manage risk and optimize their returns.
It's important to note that market regime filters are not always accurate and can change over time, so it's important for traders and investors to regularly review and update their filters to ensure that they are relevant and effective.
Understanding the use of a regime filter in trading:
The importance of a trading filter cannot be overemphasized. As a matter of fact, the chances of any trading system making consistent returns over the long term depends on it trading in the right market environment — buying when the market is bullish and selling when the market is bearish. Some traders may want to stay out of the market when the conditions are unfavorable.
The heard of this Regime Filter is the well kown Andean Oscillator. The proposed indicator aims to measure the degree of variations of individual up-trends and down-trends in the price, thus allowing to highlight the direction and amplitude of a current trend.
Settings
Length : Determines the significance of the trends degree of variations measured by the indicator.
Signal Length : Moving average period of the signal line.
The regime filter uses the color yellow and blue, yellow stands for bullish and blue for bearish.
In daily use I have found that it makes sense to use it in different timeframes to identify meaningful trends.
best regards and I hope you enjoy this new indicator
Chervolino
Regime
Qube [AstrideUnicorn]Qube is an indicator that shows market regimes. It is able to detect medium and long term trends and ranging markets. If the indicator bars are colored blue and are between the two blue lines, it means that the market is in sideways movement or consolidation. If indicator bars cross the upper boundary and are colored green, it means that the market is in an uptrend. Red bars crossing the lower blue line indicate a downward trend. The red or green columns are further referred as signal bars.
The indicator is based on the normalized momentum oscillator raised to the third power. This is done to increase the sensitivity of the indicator and to emphasize the difference between the market modes.
The indicator can be used in different ways. One of them is determining the trend direction based on the last signal bar. Even if the current indicator bar is blue (showing range or consolidation), the user should consider the longer-term market mode as upward if the last signal bar is green. And vice versa, if the last signal bar is red, the current market bias is downward. One other way to use the indicator is to catch active price impulses, when columns of the same color (red or green) appear consecutively.

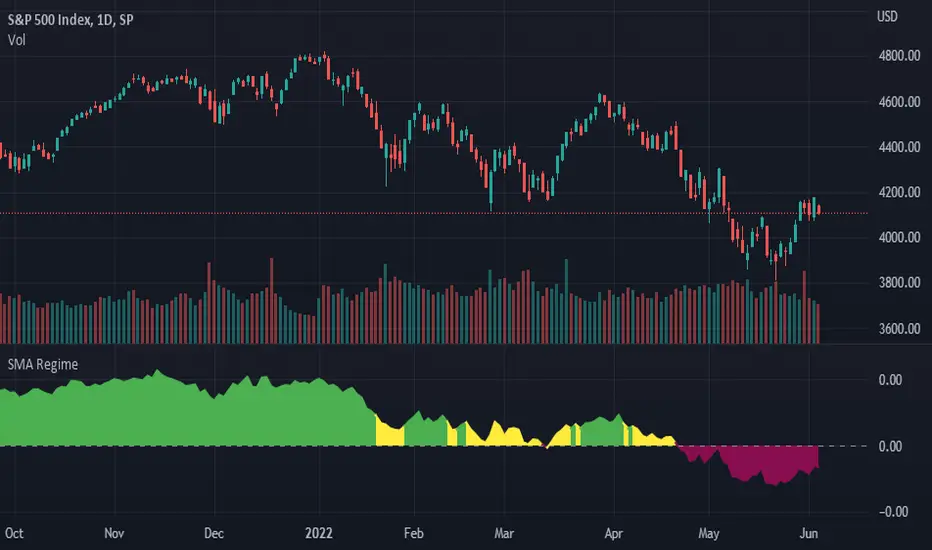
SMA RegimeProvides a color coded indicator based upon both the slope of a moving average of choice, and the asset's position in relation to that moving average. If the specified moving average is downward sloping and the asset closes below the moving average the indicator will be red. If the specified moving average is upward sloping and the asset closes above the moving average the indicator will be green. Any other combination of these two factors will color the indicator yellow indicating indecision.
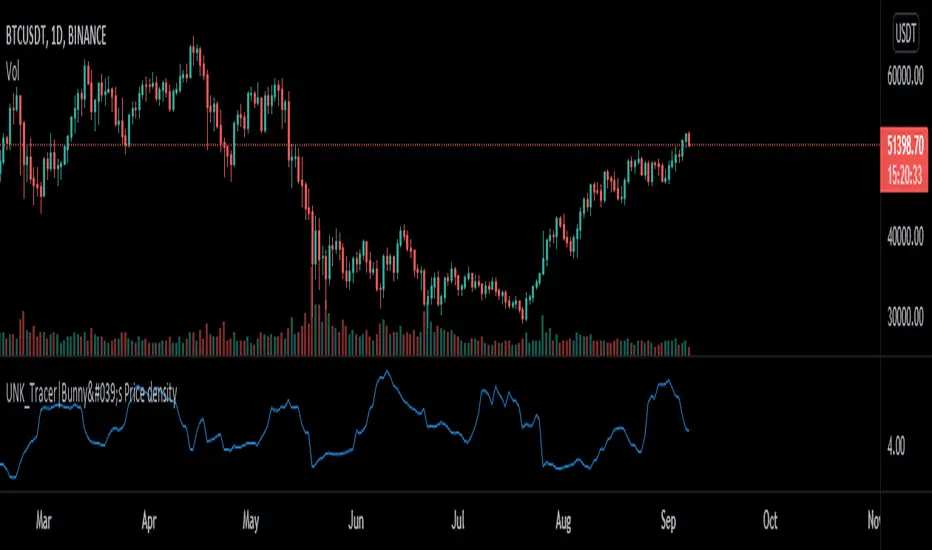
Price density [Measuring Market Noise:Take advantage]$$ Market noise can be problematic to some types of trading strategies yet beneficial to others.
By measuring noise using the 'Price Density' can enable us to improve our
trading edge and turn noise to our advantage.
Robust analysis of noise can inform us when it is best to avoid trend-following
systems (when noise is too high), and vice versa for systems based on a
mean-reverting trading premise (when market noise is low).
__________________________________________________________________________
Using Noise to our advantage
* Two techniques:
-Measure Noise and trade when suitable for the system
~ High noise = avoid trend-following
~ Low noise = avoid mean-reversion
-Match assets to strategies
~ Only trade 'noisy assets' with Mean-reversion Strategies
~ Only trade 'efficient assests' with Trend-following Strategies
## Price density:-
High values = High noise
Low values = Low noise
___________________________________________________________________________
Disclaimer!! Do your own research