Balance of Power Heikin Ashi Investing Strategy Balance of Power Heikin Ashi Investing Strategy
This is a swing strategy designed for investment help.
Its made around the Balace of Power indicator, but has been adapted on using the Monthly Heikin Ashi candle from the SPY asset in order to be used with correlation for US Stock/ETF/Index Markets.
The BOP acts as an oscilallator showing the power of a bull trend when its positive and a bearish trend when its in negative. At the same time we can spot reversals, based on the percentiles ( 99/1)
The rules for entry :
For long : The 99 percentile is ascending, and we are either in a positive value (>0), or we crossed the bottom place ( -0.35)
For short : the 99 and 1 percentile are descending, and we are either in a negative value(<0), or we crossed down the top place ( 0.6)
If you have any questions please let me know !
QQQ

Strategy Oil Z ScoreObjective is to find forward looking indicators to find good entries into major index's.
In similar vein to my Combo Z Score script I have implemented one looking at oil and oil volatility. Interestingly the script out performs WITHOUT applying the EMA in longer timeframes but under performs in shorter timeframes, for example 2007 vs 2019. Likely due to the bullish nature of the past decade (by and large). You have some options on the underlying included Oil vs OVX (Best), MOVE vs OVX and VIX vs OVX. Oil vs OVX out performs Combo Z Script. Favours Spy over QQQ or derivations (SPXL etc).

SPY to ES / MESSPY to ES is an indicator that converts SPY price targets to ES / MES futures price targets.
This indicator is helpful when you have price targets for SPY but trade ES or MES futures instead of SPY. It coverts the SPY price targets to ES / MES futures, and draws the SPY VWAP line on your ES / MES chart.
It supports the following lines
Bullish Above
Bearish Below
Long PT1
Long PT2
Long PT3
Short PT1
Short PT2
Short PT3
It also converts the SPY VWAP to it's current ES / MES value.
Note: The conversion do not work during pre and after market and the lines are only correct during market hours.

[Pt] Premarket Breakout StrategyThis is a 1 trade per day strategy for trading SPY or QQQ index. By default, this is designed for 1 min time frame. This was an experimental script that seems to be profitable at the time of publication.
How it works:
Pre-market high and low is defined per trading day between 9:00 to 9:30 EST.
Then we looking for the first breakout on either PM high or PM low.
- Breakout high = long trade
- Breakout low = short trade
If long trade, we wait until Stochastic RSI D signal line to hit a lower threshold (18 by default). Then we enter long when K crosses above D line.
If short trade, we wait until Stochastic RSI D signal line to hit an upper threshold (82 by default). Then we enter short when K crosses below D line.
Stop loss for long
- set to PM low if entry is above PM high + %ATR buffer
- or set to PM range + %ATR buffer
Stop loss for short
- set to PM high if entry is below PM low + %ATR buffer
- or set to PM range + %ATR buffer
Profit target is set to 2x the risk by default.
*Note: Different Stochastic RSI lengths should be used if trading 5 min time frame. See tooltip.
Happy trading~~!

US Stock Market Sectors Overview Table [By MUQWISHI]US Market Overview Table will identify the bullish and bearish sectors of a day by tracking the SPDR sectors funds.
It's possible to add a ticker symbol for correlation compared to each sector.
Overview Indicator

TICK strategy for SPY optionsImportant notes:
1. This strategy is designed for same day SPY option scalping. All profit shown in back testing report is based on Profit/Loss (P/L) estimates from trading options with approximately 6 months of data. By default, it is set to 10 option contracts. By default the initial capital is set to $5000. Pyramiding is set to 3.
2. This strategy works better with non-extended market data.
3. This strategy is mainly developed for SPY trading on 5 min chart, it probably will not be very profitable with other tickers or time frame without tweaking all the parameters first.
4. This strategy will work with QQQ as well, but please adjust the profit multiplier to match the P/L of QQQ options.
How it works:
When trading the indices, many rely on the TICK for market directions. This strategy is a trend following strategy that uses a combination of conditions using the following indicators:
- TICK
- RSI
- VIX volatility index
- EMA
For entries, the conditions are:
1. TICK moving average crossover with a delayed signal line
2. Bullish or bearish RSI signal, RSI > 50 for bullish, < 50 for bearish
3. VIX must be above a certain threshold to take advantage of high market volatility
4. Price must be on top of EMA line for long, and below for short
For exits, there are 3 scenarios:
1. Stop loss set by a percentage of the daily ATR value
2. Trend changes on the TICK and the RSI
3. Bearish or bullish divergence on price with TICK
This strategy automatically signal to close all trades at 3:50 pm EST at the end of the day.
Extras:
- There is an option to show P/L for reinvesting profits
Enjoy~!!! Let's all make $$$

Litt Internals ProThe Litt Internal Pro is based on the four major U.S. Equity Indexes. This is to not be used for any other markets. If you need more information on any of the indexes, you can google or watch YouTube videos on what they are. Typically if we are looking for to be long we want to see all four of the indexes green and have buy ratings. If we are looking to be short we want to see all four of the indexes red and have sell ratings. If you see Overbought or Oversold ratings it may be best to wait for a pullback to get long or not take the trade at all.
For the stocks that you trade, you should know what index they are in. The reason for this is that you can still take trades if not all four indexes are aligned the same color. For example, maybe small caps (IWM) are on a hot streak and seeing buying momentum from institutions meanwhile tech (QQQ), is being sold. If you held a long in a company that is in IWM then you could be more comfortable holding your long position. Meanwhile, if you held a long position in a stock that is in QQQ then you might want to cut your loss or take profit. There are multiple different use cases for this indicator so it is best to look for outside resources on more information on the indexes and what stocks are in each index. This can be a very powerful tool to see sector rotation by hedge funds and institutions.

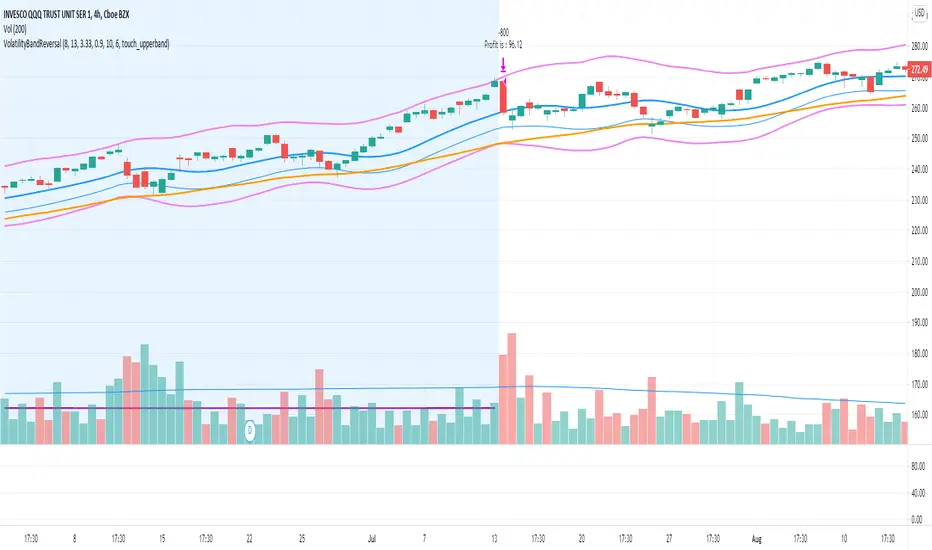
Volatility Bands Reversal Strategy [Long Only]This strategy based on existng indicator available on TV
If finds the reversals for LONG entries ... I have modified the settings to back test it ...
BUY
====
When the price touches lower band , and tries to close above lower band
some signals are mixed up, you can research and look for a confirmation ...
if the middle band is above EMA50 , you can simply follow the strategy BUY signal
but if the middle band is EMA50 , wait for the price to close above middle band
Sell / Close
==========
wait for the sell signa OR close when price touches the upper band
How do you want to close , you can chose in settings. Chnage these values and see the performance
Please note , sell means just closing the existing LONG position , not short selling
Stop Loss
=========
Stop Loss is defaulted to 6%
This is tested in 1HR, 2HR and 4 HRs chart for SPY and QQQ ETFS ...
for long term investing style , 4 Hrs is the best time frme for this strategy
Warning
========
It is not a financial advise , it is for educational purposes only. Please do your own research before taking any trading decission
Ultimate Oscillator [Long] StrategyAfter I published Short Selling strategy with RSIofUO , I have been working for Long side strategy with same indicator.
but for Long strategy , I have used only the Ultimate Oscillator ... (Not the RSI of UO)
Logic behind this is , when UO goes below oversold level , high chance of possible reversal from there ...
Ultimate Oscialltor values , I have used are 5, 10 and 15
Signal Line 9
Above values are best/defaulted based on testing the strategy multiple symbols
BUY
when UO crossing up buyLine and close > open ( if the cross over is already done , it will wait for 3 candles to see a green bar i.e close>open )
Note when the bar color changes to orange , that means startegy is ready to take LONG position on next bar. But dont jump here , waith for the startegy take the Long Position :-)
Add
Signal appears when there is divergence (marked in yellow color ) ... strategy doesnt add the position , it is ony indicating you could add to existing OR if you missed the BUY signal you could enter here
Partial Exit
when UO crossing down partial exit level
Exit
When UO crossing down sell line
StopLoss
stop loss defaulted to 3%
Please note , I have slightly modified stop loss exit in this strategy.
Even though price hits 3% stoploss , strategy wont wind up the position ...
First , it will check if RSIofUO is above 30 , then it will hold on to the Long position.
Very reason behind this is , price is falling down and UO is going up ... That means there is bullish divergence here .. so it might turn this losing position to profitable one or will exit you with less than 3% loss.
Tested with SPY , QQQ , TSLA on 30mins to 4hrs. Though winning rate is average , net profit is exponential ...
Best working on 30 mins and 1 HR chart for QQQ
Warning
For the eductional purposes only ...
This is not a financial advise , before taking trading decission please do your own research

Correlation of chart symbol to different Index-ETF-currencyScript plots correlation of chart symbol to a variety of indexes, symbols, equities. ** Original idea was to find Bitcoin correlation, which I did not. Built in correlations are: Nikie, DAX, SPY, AAPL, US Dollar, Gold, EURUSD, USDCNY, EEM, QQQ, XLK, XLF, USDJPY, EURGBP

After Hours Daytime - Consistency
Use only on Daily charts!!
When average AH moves are consistent with average daytime moves it tends to indicate a trend. The phenomenon is not obvious on a day to day basis but is easy to see with the smoothed changes.
Blue is smoothed daytime change and black is smoothed AH gap. The length is how many periods back to start the differentiation between AH and daytime.
Pink background shows BOTH smoothed AH and daytime changes are falling.
Lime background indicates both are rising.
When used on NYA with parameters shown the indicator give warnings with high specificity and reliability for the broader

ATR Pips [LazyBear] [Elixium Mod: FEAR GAUGE]Modified version of ATR Pips
The indicator's value is a third of the daily range which is good to use as a stop loss value for intra day scalping on markets such as index futures and forex.
It's good for detecting and confirming inflection points in the market.
