Index & Stock Options Reference Tool-(ISORT) [Arjo]The Index & Stock Options Reference Tool-(ISORT) is an indicator that helps users observe price trend direction together with commonly used option strike levels for selected indices and stocks in Indian market .
The indicator integrates a smoothed trend framework with structured option-related data to help users observe how price direction aligns with commonly referenced option strike levels .
It does not generate trading signals, does not provide buy or sell recommendations, and does not evaluate profitability .
Key Features
1. Trend Context Engine
Uses a Super-Smoother filter combined with EMA smoothing
Highlights directional context through color-based trend states
Designed to reduce short-term noise
2. Dynamic ATM & Strike Reference
Automatically computes ATM strike and offset strike levels to select OTM strike
Strike intervals adapt to the selected index or stock
Supports both NSE and BSE instruments, including SENSEX
3. Expiry Awareness
User-selectable expiry date inputs
Displays a visual warning if the selected expiry has already passed
Helps avoid referencing outdated option contracts
4. Option Price Reference Panel
Displays last observed CALL and PUT prices (when available)
Allows optional manual entry values for analytical comparison
All price values are shown strictly as references
5. Informational Table Overlay
Customizable on-chart table layout
Displays strike, timestamp, price reference, and arithmetic P&L values
Table values are informational only, not predictive or advisory
How to Use
1. Select the Underlying Instrument
Choose whether to reference the current chart symbol or a custom index/stock from the input settings
Supported instruments include major NSE indices, selected stocks, and SENSEX
2. Configure Expiry Parameters
Enter the option expiry date using the Day, Month, and Year inputs
If an expired date is selected, the indicator will display a visual warning
This helps ensure option references remain time-relevant
3. Observe Trend Context
The smoothed trend line provides directional context only
Color changes reflect shifts in price structure, not trade instructions
This trend is intended for contextual analysis, not timing entries
4. Review Strike References
The indicator automatically calculates ATM and offset strike levels
Strike spacing adjusts based on the selected index or stock
These values serve as reference levels commonly observed in options markets
5. Interpret the Information Table
The on-chart table displays:
Strike level
Timestamp of the most recent context change
Last observed option price (when available)
Arithmetic price difference values
All values are informational references only and do not represent performance or outcomes
6. Optional Manual Inputs
Manual price fields can be used to compare external reference values
These inputs do not trigger signals or automated calculations
Important Notes
This indicator is not a trading system
It does not generate buy or sell signals
It does not provide financial or trading advice
It is intended for learning, observation, and market study
Disclaimer
This script is provided for educational and analytical purposes only. It does not constitute investment advice, trading advice. The author assumes no responsibility for decisions made using this indicator.
Happy Trading (Arjo)
Putoption

ATM Pulse (Arjo)ATM Pulse (Arjo) — Real-Time ATM Options Sentiment & Trend Strength Indicator
Overview
ATM Pulse (Arjo) is an options analytics and trend overlay tool that automatically detects the At-The-Money (ATM) strike for NIFTY, BANKNIFTY , or any selected stock.
It merges Call–Put Volume Ratio (CPVR) sentiment analysis with a Chandelier Exit trend overlay to help traders visualize both market bias and trend direction in a single chart.
Concepts & Logic
ATM Auto Detection
The script calculates the current ATM strike by rounding the underlying’s price to the nearest strike interval (e.g., 50 for NIFTY, 100 for BANKNIFTY). It then requests live option-chain data for that strike.
Call–Put Volume Ratio (CPVR)
The Call-Put Volume Ratio (CPVR) is calculated as the call volume divided by the put volume.
CPVR > 1.25 → Bullish dominance (Calls stronger)
CPVR < 0.75 → Bearish dominance (Puts stronger)
0.75–1.25 → Neutral sentiment
This ratio helps interpret real-time option-market positioning.
Chandelier Exit Trend Overlay
Using Average True Range (ATR) , the overlay plots dynamic trailing stops and visual trend zones:
🟢 Green: Uptrend continuation zone
🔴 Red: Downtrend continuation zone
A color change signals possible momentum reversal.
Combination of CPVR and Chandelier Exit
CPVR gauges option-market sentiment
Chandelier Exit confirms price-action direction
When both align (e.g., bullish CPVR + green Chandelier zone), it strengthens directional conviction. Divergent readings may signal indecision or early reversals.
How to Use
Open any NIFTY, BANKNIFTY , or stocks chart.
Add ATM Pulse (Arjo) to the chart.
Select your expiry date — the script auto-detects the ATM strike and displays:
C: Call LTP
P: Put LTP
CPVR: Call/Put Volume Ratio label
Watch the Chandelier Exit colors:
🟢 Green = Bullish trend
🔴 Red = Bearish trend
Combine CPVR bias + trend color for confirmation.
If CPVR is above 1.25 and trend color green → More bullish activity (Calls stronger).
If CPVR is below 0.75, and trend color red→ More bearish activity (Puts stronger).
If CPVR is between 0.75 and 1.25 and the trend color is gray/mixed → Neutral
Practical Use Case
The script continuously updates the ATM strike, CPVR , and trend overlay in real time.
It provides a clear visual snapshot of how option volumes align with price momentum , ideal for intraday or short-term directional traders.
Disclaimer
This tool is for educational and analytical purposes only.
It does not provide financial advice or guaranteed trading signals.
Happy Trading. ARJO

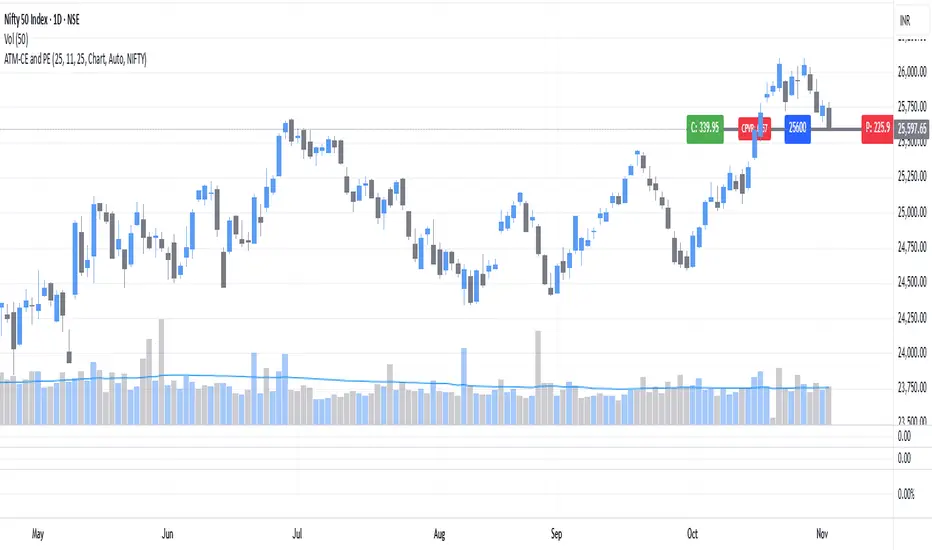
ATM Strike Line with Call & Put Premiums (ARJO)This indicator is designed specifically for the Indian market (NSE) and helps traders visualize the At-The-Money (ATM) strike line along with real-time Call (CE) and Put (PE) option premiums.
Key Features
Automatic ATM Detection: The script automatically identifies the ATM strike based on the underlying price, with an option for manual input.
Dynamic Expiry Control: Select expiry date easily (Year, Month, Day) in YYMMDD format.
Flexible Timeframe Support: Choose between the chart’s current timeframe or custom intervals.
Smart Symbol & Strike Interval: Automatically adapts to the selected underlying symbol (e.g., NIFTY, BANKNIFTY, RELIANCE, etc.) or allows manual setup.
Visual Representation:
ATM line plotted clearly on the chart.
CE and PE premium labels are displayed on each side of the ATM line.
ATM strike price label shown at the center.
Call–Put Volume Ratio (CPVR): Displays the live CPVR value to quickly assess market sentiment.
CPVR Interpretation
Bullish Bias: CPVR ≥ 1.25
Bearish Bias: CPVR ≤ 0.75
Neutral Zone: Between 0.75 and 1.25
⚙️ Customization
Adjustable colors for ATM line, CE/PE labels, and CPVR.
Option to manually select strike, symbol, and interval for maximum flexibility.
This tool may help to track option sentiment directly on the price chart, making it ideal for option traders and intraday analysts focusing on NIFTY, BANKNIFTY, and other NSE stocks.
Happy Trading. ARJO
Straddle Charts - Live
Description :
This indicator is designed to display live prices for both call and put options of a straddle strategy, helping traders visualize the real-time performance of their options positions. The indicator allows users to select the symbols for specific call and put options and fetches their prices on a 1-minute timeframe, ensuring updated information.
Key Features :
Live Call and Put Option Prices: View individual prices for both call and put options of the straddle, plotted separately.
Straddle Price Calculation: The total price of the straddle (sum of call and put) is displayed, allowing for easy monitoring of the straddle’s combined movement.
Customizable Inputs: Easily change the call and put option symbols directly from the settings.
Use this indicator to stay on top of your straddle's value and make informed trading decisions based on real-time data.

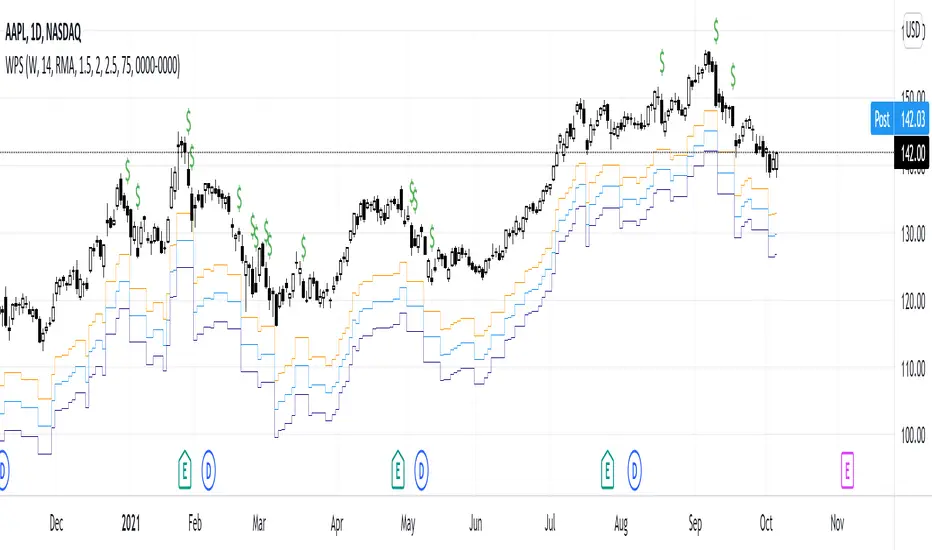
Weekly Put SaleWeekly Put Sale
This study is a tool I use for selling weekly puts at the suggested strike prices.
1. The suggested strike prices are based on the weekly high minus an ATR multiple which can be adjusted in the settings
2. You can also adjust the settings to Monthly strike prices if you prefer selling options further out
3. I suggest looking for Put sale premium that is between 0.25% to 0.75% of the strike price for weekly Puts and 1% to 3% of the strike price for monthly Puts
Disclaimers: Selling Puts is an advanced strategy that is risky if you are not prepared to acquire the stock at the strike price you sell at on the expiration date. You must make your own decisions as you will bear the risks associated with any trades you place. To sum it up, trading is risky, and do so at your own risk.