Power Trend Screener [LevelUp]Screen for symbols in a Power Trend using the Pine Screener. This screener supports all equity types from stocks to ETFs to crypto.
When a Power Trend is active, there is a stronger than usual uptrend underway. The concept of a Power Trend was created by Investor's Business Daily to mimic the trading style of IBD's Founder and legendary trader, William O'Neil.
🔹 What Starts A Power Trend?
✓ Low is above the 21-day EMA for at least 10 days.
✓ 21-day EMA is above the 50-day SMA for at least five days.
✓ 50-day SMA is in an uptrend.
✓ Close up for the day.
🔹 What Ends A Power Trend?
✓ 21-day EMA crosses under 50-day SMA.
✓ Close 10% below recent high and below the 50-day SMA.
🔹 Screening Features - Setting Your Search Criteria
There are various search options that can be customized to meet your preferences.
▪ In A Power Trend
To cast the widest net, select only this option and all stocks in a Power Trend will be returned.
▪ Power Trend Started
This option will search for symbols that began a Power Trend on the most recent daily bar.
▪ Power Trend Ended
This option will search for symbols where there was an active Power Trend, however, it ended on the most recent daily bar.
▪ Days In A Power Trend
This option can be helpful if you would like to find stocks that recently entered a Power Trend, for example, stocks that have been in a Power Trend for less than 5 days. Another use would be to search for stocks where the Power Trend has been active for a longer period of time, for instance, over 50 days.
▪ 1 Week % Change
With this option you can search for stocks that are up/down a specific percentage over the past week. For example, search for stocks in a Power Trend that are up 5% or more in the past week.
▪ 1 Month % Change
Similar to the above, narrow the search to percent changes based on monthly data. For example, return stocks in a Power Trend that are down 10% or more in the past month.
▪ Limit Symbol Types
If you have a watchlist that has multiple symbol types, for example stocks and crypto, you can set this option to limit the search to one or more symbol types. You can configure this option by clicking the drop-down to the right of the indicator name and selecting Settings.
🔹 Installation And Usage
▪ Mark this indicator as a Favorite.
▪ Use the Pine Screener to search for Power Trends.
▪ Save the search results to a watchlist.
▪ View the watchlist in TradingView.
🔹 Power Trend Indicator
This screener is designed to be used along with the Power Trend indicator to view Power Trends on your chart.
🔹 Important Notes
▪ This indicator is for screening, there is no visible output on the chart.
▪ Once you mark this screener as a Favorite, you can remove it from your chart.
▪ The Power Trend concept as defined by Investor's Business Daily is based on moving averages on the daily timeframe. Given this requirement, this screener is also limited to searching the same timeframe.
Powertrend

IBD PowerTrendThis IBD PowerTrend indicator is designed to help traders identify strong market uptrends based on the IBD Market School's Power Trend methodology. It is intended to be added to daily charts on major indexes.
Concept and Methodology
The IBD PowerTrend helps traders identify strong market uptrends. Markets generally exist in three states: uptrends, downtrends, and rangebound motion. This methodology focuses on:
Downtrends: Stay out of the market.
Rangebound markets: Often frustrating, best avoided.
Uptrends: Identify the strongest uptrends early.
This indicator uses IBD's research on historical uptrends to help traders get in and stay in during robust market phases.
How It Works
A PowerTrend starts when the following four conditions are met simultaneously on a major index:
10-Day Low Above 21-Day EMA : The market's low must be above the 21-day exponential moving average (EMA) for at least 10 consecutive days.
21-Day EMA Above 50-Day SMA : The 21-day EMA must be above the 50-day simple moving average (SMA) for at least five consecutive days.
50-Day SMA Uptrend : The 50-day SMA must be in an uptrend (one day is sufficient).
Market Closes Up : The market must close higher than the previous day's close.
A PowerTrend typically ends when the 21-day EMA crosses back below the 50-day SMA. However, there are rare cases where a PowerTrend can end early due to a circuit breaker or a follow-through day failure. In this script, a circuit breaker is defined as a break of the 50-day line and being more than 10% below recent highs (interpreted as three months).
How to Use
When the PowerTrend is active, the indicator will plot green circles, signaling a strong market uptrend. During these periods, traders might observe opportunities in growth stocks breaking out of sound bases and consider the use of margin. Conversely, during downtrends, the indicator suggests a more defensive approach.
It is recommended to use on daily timeframe.
Chart Description
Main Chart:
- EMA 21 (blue): The 21-day exponential moving average.
- SMA 50 (red): The 50-day simple moving average.
First Panel:
- IBD PowerTrend Indicator: Plots the PowerTrend status with green circles indicating an active PowerTrend.
Second Panel:
- Volume Bars

Power OutageThe Power Outage indicator serves as the antithesis to the Power Trend, highlighting periods of extreme weakness or downtrends. Drawing inspiration from the Power Trend, the Power Outage framework was conceived by reversing the logic to highlight periods where being in cash or net short could be beneficial.
What Initiates a Power Outage?
The high is below the 21-day EMA for at least 10 consecutive days.
The 21-day EMA is below the 50-day SMA for a minimum of five days.
The 50-day SMA is on a downward trajectory.
The closing price is lower than the previous day's close.
A Power Outage can be a caution sign for traders to tighten up risk management and encourage defensive strategies or the consideration of short positions. Not only does this indicator clearly identify a Power Outage by a shaded background or shape plotted on the chart, but it also records metrics for each previous Power Outage.
The number of Power Outages that have occurred, their average length, and average depth (from the first day's close when the Power Outage activates to the low of the Power Outage) are all displayed to help assess the condition of the current Power Outage.
What Ends a Power Outage?
A Power Outage ends when the 21-day EMA crosses above the 50-day SMA, or when the price closes 10% above the recent low and above the 50-day SMA.
This indicator is designed to be viewed on a daily time frame.

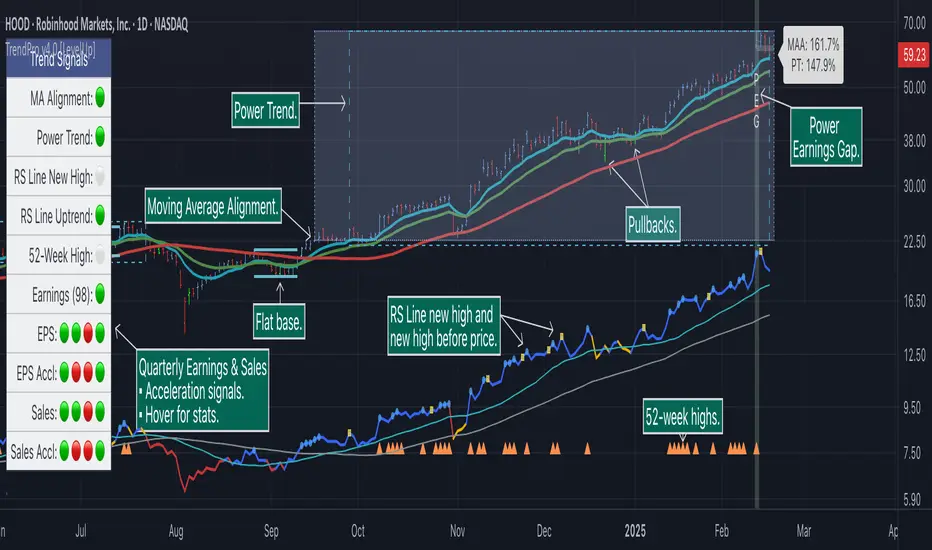
Trend Alignment Pro [LevelUp]Trend Alignment Pro™ is designed for traders who focus on trading with the trend. This indicator automates key aspects of fundamental and technical analysis to identify and highlight chart patterns and signals, drawing on the proven techniques of legendary trend-following traders such as William O'Neil, Jesse Livermore, and Stan Weinstein.
The indicator name, Trend Alignment , emphasizes the importance of confirming price action, patterns, and signals across multiple timeframes. It provides both daily and weekly analysis to enable accurate and timely trend identification.
🔹—— Key Features ——🔹
Daily Timeframe
Moving Average Alignment™
▪ Highlight trends based on moving averages and price action.
▪ Specify price in relation to moving averages (e.g. close above).
▪ Specify which moving averages are required to be in an uptrend.
▪ Specify moving average stacking requirements (e.g. fast above slow).
▪ Require active Power Trend (optional).
▪ Set stop-loss and requirements to end Moving Average Alignment.
Power Trend Tools and Analysis
▪ Highlight Power Trends with box or symbols at start/end points.
▪ Auto-tracking of key metrics towards a new Power Trend.
Custom Moving Averages
▪ Specify type (EMA/SMA), length and color.
▪ View 10-week SMA on daily chart.
Stats Table
▪ Comprehensive daily price and percent change stats.
Signals Table
▪ Track important trend signals with clear visuals.
Power Earnings Gap (PEG) Detection
▪ Auto-detect and highlight Power Earnings Gaps.
▪ Customize requirements, such as gap-up percent and earnings surprise.
Weekly Timeframe
Custom Moving Averages
▪ Specify type (EMA/SMA), length and color.
Tight Weeks and Up Weeks
▪ Specify weekly and percent change requirements.
Stats Table
▪ Comprehensive weekly price and percent change stats.
Daily & Weekly Timeframes
Flat Base & Consolidation
▪ Automated detection with defaults based on the active timeframe.
Custom Relative Strength Line
▪ Specify index and lookback range.
▪ Symbols plotted on RS Line indicating new high and new high before price.
▪ Two custom moving averages for daily & weekly timeframes.
Anchored VWAP (AVWAP)
▪ Multiple anchor options: year-to-date, year-to-date low/high.
Pullbacks
▪ Set key requirements and minimum number of bars.
52-Week and All-Time Highs
▪ Bullish indicators indicating outperformance.
Marked Highs & Lows
▪ Identify potential areas of support/resistance.
🔹—— Daily Chart Examples ——🔹
Daily charts are ideal for analyzing short to intermediate term trends and spotting actionable setups as they develop.
🔹—— Weekly Chart Example ——🔹
Weekly charts are helpful for identifying longer-term trends and patterns.
🔹—— Moving Average Alignment (Daily) ——🔹
Moving Average Alignment™ (MAA) is a trend-identification tool that uses moving averages, price action and their relationships to one another to detect momentum and upward trends. MAA offers extensive customization, including the following:
▪ Moving average types (EMA/SMA) and length.
▪ Which moving averages are required to be in an uptrend.
▪ Requirements on the order of moving averages (e.g. fast above slow).
▪ Optional requirement that the stock be in a Power Trend.
▪ Set stop-loss and requirements to signal the end of the MAA.
MAA delivers clear visual confirmation of trend strength and helps identify both the start and potential end of an uptrend.
🔹—— Power Trend (Daily) ——🔹
The concept of a Power Trend was created by Mike Webster, Justin Nielsen and Charles Harris while working with William O’Neil, founder of Investor's Business Daily and creator of the CANSLIM methodology. When a Power Trend is active, there is a stronger than usual uptrend underway.
A Power Trend by definition uses a major index, such as the Nasdaq Composite (IXIC), as the data source for determining a Power Trend's state. The Trend Alignment indicator builds upon this concept by enabling the current chart symbol to be the data source for the Power Trend, thus offering traders a unique and quantifiable signal when a stock is in a strong uptrend.
What Starts A Power Trend
▪ Low is above the 21-EMA for at least 10 days.
▪ 21-EMA is above the 50-SMA for at least five days.
▪ 50-SMA is in an uptrend.
▪ Close up for the day.
What Ends A Power Trend
▪ 21-EMA crosses under 50-SMA and the close is below prior day close.
▪ Close below the 50-SMA and low is 10% below recent high.
One unique feature of the Trend Alignment indicator is that you can track the progress towards a new Power Trend beginning. See the chart below for more details.
🔹—— Power Earnings Gap (Daily) ——🔹
A Power Earnings Gap refers to a stock experiencing a significant price gap-up, on high volume, following an earnings report. This typically occurs when the stock opens at least 5-10% (or more) above the prior day's close, forming a gap-up bar on the chart that signals strong retail and/or institutional buying and the start or continuation of a major uptrend. It's a bullish pattern seen in leading growth stocks that often continue to outperform.
There are extensive customization options including required gap-up percent, minimum volume change over the average volume and preferred earnings surprise requirements.
🔹—— Relative Strength Line ▪ RS Line (Daily & Weekly) ——🔹
The Relative Strength Line (RS Line), another concept popularized by William O’Neil, is a technical indicator used in stock analysis to measure a stock's performance relative to a benchmark index, such as the S&P 500. An upward-trending RS Line indicates the stock is outperforming the market, while a downward trend shows underperformance. This helps identify potential leaders or laggards regardless of market conditions.
RS Line New High
When the RS Line reaches a new high, this signals that the stock's relative strength against the benchmark is at its highest point over the current lookback range — clear evidence of market leadership.
RS Line New High Before Price
When the RS Line hits a new high ahead of the stock's price reaching a new high, this can be a leading indicator of impending price strength, as it shows the stock gaining momentum relative to the market before that strength is reflected in its price. This signal shows early outperformance and potential market leadership, often preceding a breakout or trend continuation.
New High and New High Before Price Symbols
Easily spot RS Line new highs and new highs before price; a small circle on the RS Line indicates new highs and a small square highlights new high before price.
Highlight Breaks of Moving Averages
There are two custom moving averages of the RS Line that can be configured. Looking for breaks above or below these moving averages can be helpful to effectively manage positions, such as scaling out of a trade systematically.
🔹—— Tight Weeks and Up Weeks (Weekly) ——🔹
In William O'Neil's CANSLIM methodology, tight weekly closes and up weeks are key technical indicators used to evaluate stock chart patterns and identify potential buying opportunities. Tight and up weeks may indicate institutional accumulation and price strength.
Tight closes on a weekly timeframe refer to consecutive weeks where closing prices stay within a narrow 1-1.5% range of the prior week's close, often with declining volume. This signals buyer control and accumulation, making it a bullish indicator, particularly in patterns like three-weeks-tight after an initial breakout.
When a stock closes higher than the prior week, this signals positive momentum. Multiple up weeks often indicate sustained buying and may help to spotlight emerging leaders. Increased volume on up weeks show institutional support and increase the potential for a breakout.
🔹—— Automated Anchored VWAP ▪ AVWAP (Daily & Weekly) ——🔹
Based on the work of Brian Shannon, CMT, the anchored VWAP (AVWAP) shows the average price a stock has traded at, weighted by volume, starting from a specific point in time, the anchor. AVWAP can be helpful for trend confirmation and reversals, breakout and breakdown signals as well as risk management for placing stops.
The AVWAP works with any exchange around the globe, respecting trading days, hours and holidays. Use the AVWAP with the TradingView Replay feature for historical and post-mortem analysis.
🔹—— Marked Highs and Lows (Daily & Weekly) ——🔹
Pivot highs and pivot lows are core principles in technical analysis for identifying potential turning points, support/resistance, and trends. Shown on the chart as either price or a triangle symbol, these visual cues help to quickly spot significant price levels.
Pivots highlight historical turning points in price, serving as reliable zones for potential bounces or breakouts. They can also help determine overall market direction, for example, higher highs and higher lows in uptrends. Pivots also represent where demand overwhelms supply or vice versa.
🔹—— Price Stats and Signals Tables (Daily & Weekly) ——🔹
Comprehensive daily and weekly price stats. Daily charts also includes real-time signals to monitor the trend as well as quarterly earnings and sales data.
🔹—— Custom Alerts ——🔹
The Trend Alignment indicator supports custom alerts:
▪ Moving Average Alignment started.
▪ Moving Average Alignment ended.
▪ Power Trend started.
▪ Power Trend ended.
▪ Power Earnings Gap started.
🔹—— Best Practices ——🔹
▪ Look for confirmation of an uptrend on multiple timeframes.
▪ Use multiple signals and/or patterns for confirmation of the trend.
▪ Relative strength is key to find stocks outperforming the market.
▪ Focus on companies with earnings and sales acceleration.
▪ Avoid chasing extended stocks.
▪ Always define risk before entering a trade — know where you’ll exit.
▪ Size positions based on volatility and conviction, not emotion.
▪ Be patient — trends take time to develop.
Bezahltes Script
Power trend - SR - Based on Mike Webster's articleMike Webster described the PowerTrend
What Starts a Power Trend?
Low is above the 21-day EMA for at least 10 days.
21-day EMA is above the 50-day SMA for at least five days.
50-day SMA is in an uptrend.
Closes up for the day.
What Ends a Power Trend?
21-day EMA crosses under 50-day SMA.
Close 10% below the recent high and below the 50-day SMA.
I have provided the options to
To show/hide all the important metrics related powertrend in a table.
Background color can be shown on charts. It can be toggled as well.
You can also modify the inputs for EMA and SMA
This script is supposed to be used on a daily chart however, it will work on other timeframes as well.
PS:
This is my first attempt at building this script. I look forward to your feedback on the same.
This is only for educational purposes.
Following are some examples of the same
NASDAQ:AAPL
NASDAQ:AMZN
NYSE:CRM
NASDAQ:GOOGL
NASDAQ:META
NYSE:PLTR
NASDAQ:SMCI

Power Trend Detector [LevelUp]When a Power Trend is active, there is a stronger than usual uptrend underway. The concept of a Power Trend was defined by Investor's Business Daily, more specifically, the Market School course designed to mimic the trading style of IBD's Founder, William O'Neil.
The specifics of a Power Trend were defined by Mike Webster, Justin Nielsen and Charles Harris, while working with William O'Neil at IBD. The uptrends of the Nasdaq Composite were studied in great detail, looking for characteristics that were similar across significant uptrends. The end result was a set of rules that define when a Power Trend starts and ends.
Knowing that there is a Power Trend in play can be helpful to gauge how aggressive to be with your trades.
The price action in a major index, such as the Nasdaq Composite (IXIC), is the source for determining a Power Trend's status. Using an index is based on the definition of a Power Trend from Market School. With this indicator, in addition to indexes, it will allow an ETF (more specifically, a "fund" as defined by TradingView) to be used as the source. The reason for the latter is that various ETFs such as ARKK, which are focused on "disruptive technology," can be helpful to track trends for growth traders.
What Starts a Power Trend?
▪ Low is above the 21-day EMA for at least 10 days.
▪ 21-day EMA is above the 50-day SMA for at least five days.
▪ 50-day SMA is in an uptrend.
▪ Close up for the day.
What Ends a Power Trend?
▪ 21-day EMA crosses under 50-day SMA.
▪ Close 10% below recent high and below the 50-day SMA.
Show Power Trend Status
This indicator has two options to highlight each day of the Power Trend:
▪ Symbol over each bar.
▪ Symbol across the bottom of the chart for each day in a Power Trend.
How Does a Power Trend End?
One way for a Power Trend to end is when the 21-day EMA crosses under the 50-day SMA.
There are also "circuit-breaker" rules that result in the a Power Trend ending. For example, when the price breaks below the 50-day SMA and closes 10% or more from a recent high.
Important Notes
As designed and implemented by William O'Neil, Power Trends are only shown on a daily chart.

[TTI] IBD Power Trend🏛️ History & Credit
IBD Power Trend is an indicator created by TintinTrading inspired by the Investor's Business Daily and William O'Neil's investment philosophy. It is part of the Market School methodology.. It's built on the principle that the market's Power Trend is the best time to get aggressive.
💪 What it does
IBD Power Trend helps traders identify when the market's Power Trend starts and finishes. The indicator uses rules about the position of the price relative to the 21EMA and 50SMA, as well as the relationship between the two moving averages, to give traders an edge.
👨🏫 How to use it
IBD Power Trend can be used as an additional criteria to decide when to get more aggressive in the market. It can also be used to assess when to be a pig/tiger. With IBD Power Trend, traders can have more confidence in their trades and make better investment decisions.

TradeChartist TrendStalker - Market Bias Indicator™TradeChartist TrendStalker helps visualise the Market Bias through 3 different Plot types and also displays Trend Direction Identifier (Green, Red and Orange square blocks) that can be connected to ™TradeChartist Plug and Trade to generate Trade entries, Targets, StopLoss and create alerts based on performance on the chosen timeframe. The three plot types are as below.
1. Market Bias Strength Oscillator
Plots true strength of Market Bias - helps determine if Market is Bullish/Bearish overall for the asset on chart TF.
2. Market Bias Detector - Range Based
Displays TrendStalker plots stalking the Market Bias based on Range the Market is expecting to gain/lose from the asset on the Chart Timeframe. Change in Market Bias can be easily seen through the Convergence/Divergence of the TrendStalker plots.
3. Market Bias Detector - Price
Displays TrendStalker plots stalking the Market Bias based on Price for the asset on the Chart Timeframe. Change in Market Bias can be easily seen through the Convergence/Divergence of the TrendStalker plots.
Note: Trend Direction Identifier for Trade entries will be the same for Market Bias Detector plots, but differs from Market Bias Strength Oscillator.
Note: Trend Direction Identifier plots orange squares when its detecting a potential change in trend and its recommended to close some/most of the position or move Stop Loss to protect profit/reduce risk. Once the orange squares turn back into green/red squares, it signals safe re-entry.
Green squares - Bullish Trend
Red Squares - Bearish Trend
Orange Squares - Potential change in Market Bias
===================================================================================================================
TrendStalker Cool Extras
Option to paint Background Color
Option to enable Take Profit bar recommendation (Works only with Market Bias Strength Oscillator)
Option to paint Price Bars using Market Bias Strength
Alerts can be created for Long/Short Entry/Re-entry and Long/Short SOS signals (Orange squares). For all other alerts, ™TradeChartist Plug and Trade can be used.
BTC 1hr Chart with TrendStalker Extras
===================================================================================================================
BTC 1hr Chart with TrendStalker connected to ™TradeChartist Plug and Trade
===================================================================================================================
This is not a free to use indicator. Get in touch with me (PM me directly if you would like trial access to test the indicator)
Premium Scripts - Trial access and Information
Trial access offered on all Premium scripts.
PM me directly to request trial access to the scripts or for more information.
===================================================================================================================

TradeChartist PowerTracer Pro Backtester™TradeChartist PowerTracer Pro Backtester is the strategy script for backtesting ™TradeChartist PowerTracer Pro for best performance settings which can then be used with ™TradeChartist PowerTrader Pro to plot Trades emulating the backtester and use Alerts (once per bar) on real time price chart.
PowerTracer Backtester includes the following options in the settings.
PowerTracer setting - Power Plot Type - (PowerTracer, Bar-wise Power Holder)
PowerTracer setting - Timeframe Multiplier
PowerTracer setting - Smoothing Factor
Backtester setting - Trade Direction - (Both Longs and Shorts, Only Longs, Only Shorts)
Backtester setting - SL Type (Fixed Stop Loss, Trailing Stop Loss)
Backtester setting - Reference for Trailing SL (Close, High/Low)
Backtester setting - Stop Loss %
Backtester setting - Take Profit %
Backtester setting - Quantity to trade at TP %
Using combinations of the settings, the user can find optimal settings for the asset to deliver lucrative entry and exit signals with high ROI and minimal Drawdown which can then be used on PowerTracer Pro and PowerTrader Pro to plot signals and create alerts to start trading in real-time.
Example charts:
GBP-USD 1hr chart - (2,1,Trailing SL, close, 1,1,25)
BTC-USDT 15m chart - (4,5, Trailing SL, high/low, 3.9,1.2,15)
SPX 1hr chart - (1,3, Trailing SL, high/low, 3, 2, 50)
This backtester needs the following scripts to generate signals and plots on main price chart and for real-time alerts
™TradeChartist PowerTracer Pro
™TradeChartist PowerTrader Pro
===================================================================================================================
This is not a free to use indicator. Get in touch with me (PM me directly if you would like trial access to test the indicator)
Premium Scripts - Trial access and Information
Trial access offered on all Premium scripts.
PM me directly to request trial access to the scripts or for more information.
===================================================================================================================
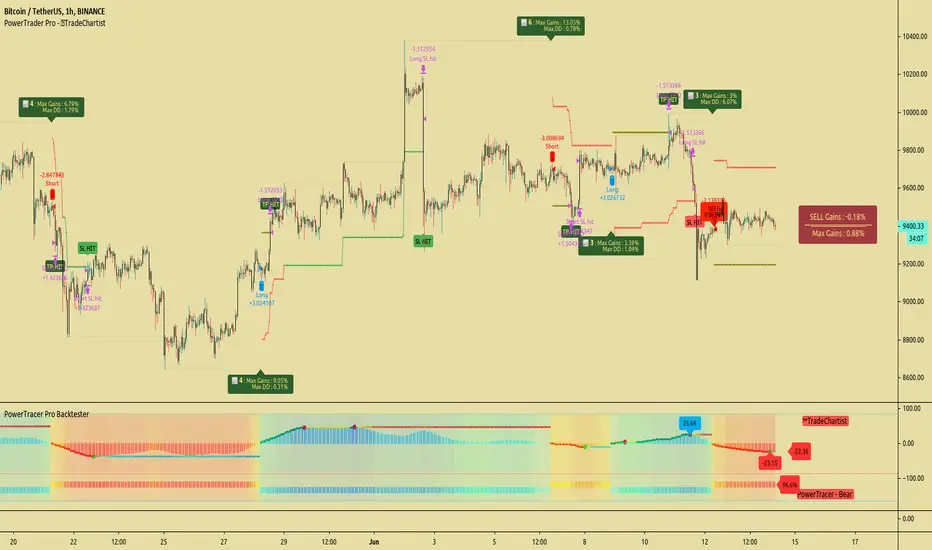
TradeChartist PowerTrader ProTradeChartist PowerTrader Pro is a versatile Signal generator and Signal plotter on the main price chart based on signals from other compatible scripts like TradeChartist PowerTracer Pro . This elegantly designed script plots the following based on user preference.
BUY and SELL signals based on external compatible signal source
Automatic Targets if opted from settings
Trailing or Fixed Stop Loss based on user input
Take Profit % and Quantity to trade based on user input
PowerTrader Dashboard displaying 14 period RSI, Stoch and 20 EMA
Real-Time Gains Tracker displaying Max Gains and open PnL
Past Performance labels displaying Max Gains and Max Drawdown for each trade
Higher Highs since BUY and Lower Lows since SELL
Once the external Signal is connected to the script, the results based on signal backtester ( TradeChartist PowerTracer Pro Backtester ) can be used to optimise the settings to generate plots and also to set Alerts for the following.
Long and Short Signals
Long and Short Stop Loss Hit
Long and Short TP Hit
Move up/down Trailing SL
To create alerts, the user must choose PowerTrader Pro from the alert condition drop-down and choose the required alert. Since the signals are generated only after confirmation, "Once per bar" must be used for Alerts.
===================================================================================================================
This is not a free to use indicator. Get in touch with me (PM me directly if you would like trial access to test the indicator)
Premium Scripts - Trial access and Information
Trial access offered on all Premium scripts.
PM me directly to request trial access to the scripts or for more information.
===================================================================================================================
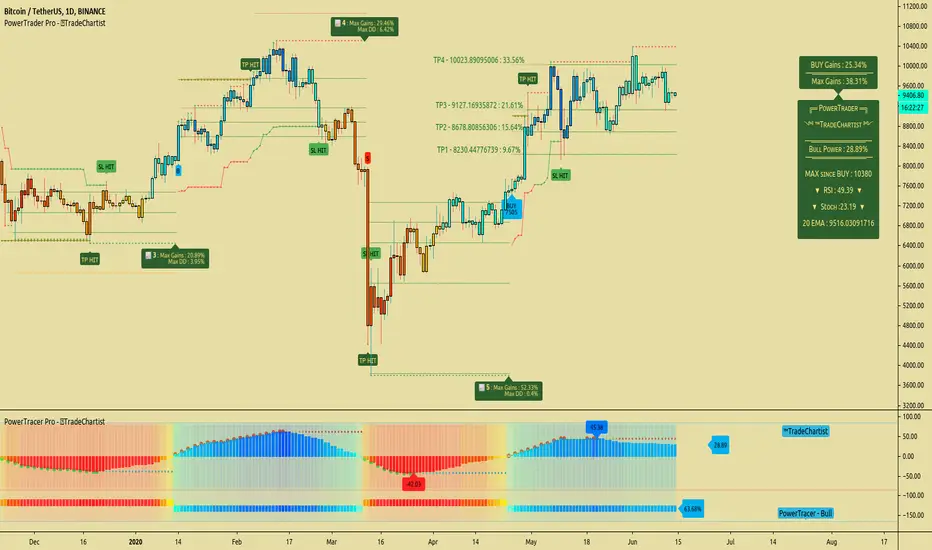
TradeChartist PowerTracer ProTradeChartist PowerTracer Pro is an exceptionally well designed and a functional indicator, requiring minimal user input to trace the asset's Bull and Bear Power. The indicator makes it visually engaging with its intelligent positioning of the PowerTracer Bar, tracking not just the current trend, but also the developing trend using visually easy to understand Power plots. PowerTracer Pro can be used with PowerTrader Pro to generate Trade signals with several possible combinations of settings based on PowerTracer Pro Backtester Performance results.
What does ™TradeChartist PowerTracer Pro do?
1. Tracks Bull and Bear Power and plots the information visually on chart using one of the following 2 Power plot options based on Timeframe Multiplier and Smoothing Factor..
𝗣𝗼𝘄𝗲𝗿𝗧𝗿𝗮𝗰𝗲𝗿 - Plot of the Bull and Bear Power Oscillator, pivotal to this script that tracks the true Bull and Bear Power along with Bull/Bear oscillator reading, calculated dynamically using a unique and original formula. Values beyond 50 and -50 are quite rare, but theoretically, they can go beyond 80 and -80. 𝗣𝗼𝘄𝗲𝗿𝗧𝗿𝗮𝗰𝗲𝗿's highs and lows are also tracked and updated real-time using labels placed exactly at the Highs and Lows with their readings.
Bar-wise Power Holder - Absolute Bull and Bear power of each bar. It is plotted by calculating the difference between Bull and Bear Power of each bar. The values can swing between -100 and +100 even though values above 90 and below 90 are rare.
2. Visually displays the Balance of Power between the Bulls and the Bears using Power density background fill.
3. Uses an accompanying 𝗣𝗼𝘄𝗲𝗿𝗧𝗿𝗮𝗰𝗲𝗿 bar that helps spot the true bull and bear power using simple linear blocks, displaying the power level using power intensity colors.
4. Paints price bars and PowerTracer background using Power intensity colors, which helps spot the increase or decrease in Bull and Bear Power. Price bar color changes are based on increasing/decreasing power intensity of the price bar's power holder and may not be the same as the Power plots. This is designed specifically to spot price trends based on chart timeframe power trend.
5. Inverts bar colors, and PowerTracer bar color to help see price trend using the Opponent's Point of View.
What markets can this indicator be used on?
-- Forex
-- Stocks - works best with 4hr or above and prices calculated taking gaps into account.
-- Commodities
-- Cryptocurrencies
and almost any asset on Trading View
What time-frames can this indicator be used on?
This indicator can be used on all timeframes. If the asset has very little volume / volatility or is far low in comparative value against the base currency, power detection can be choppy, but with most assets, this won't be an issue.
Does this indicator repaint?
-- No. Real-time Power plots can change colors and values based on current bar close as values get calculated dynamically. Once the bar closes, plots and power intensity colors don't repaint.
-- This can be verified using Bar Replay to check if the plots and fills stay in the same bar in real time as the Bar Replay
Does the indicator generate trade signals based on Power shifts?
Yes. PowerTracer Pro can be connected to PowerTrader Pro to generate BUY and SELL signals with automatic/user specified targets on the main price chart along with Fixed or Trailing Stop Loss plots based on the Power Plot opted by the user. PowerTrader Pro is highly recommended for traders who would like signals based on power trend on the main price chart as it comes with real time Dashboard and Gains tracker with the option to plot past performance displaying Max gains and Max Drawdowns for each trade. It also includes SL/TP Plots and Alerts system that can be used to automate trades based on settings that result in high ROI on PowerTracer Pro Backtester performance report.
The charts below show how this indicator can be used with PowerTrader Pro to generate trade signals with TP and SL plots.
GBP-USD 1hr chart with SL and TP plots with real-time gains tracker. Timeframe MUltiplier - 2, Smoothing Factor - 8
LINK-BTC 4hr chart with SL and TP plots, real-time gains tracker and past performance results. Timeframe Multiplier - 3, Smoothing Factor - 1
XAU-USD Gold 1hr chart with SL and TP plots, real-time gains on Dashboard with Automatic Targets and past performance labels. Timeframe Multiplier - 2, Smoothing Factor - 1
===================================================================================================================
This is not a free to use indicator. Get in touch with me (PM me directly if you would like trial access to test the indicator)
Premium Scripts - Trial access and Information
Trial access offered on all Premium scripts.
PM me directly to request trial access to the scripts or for more information.
===================================================================================================================
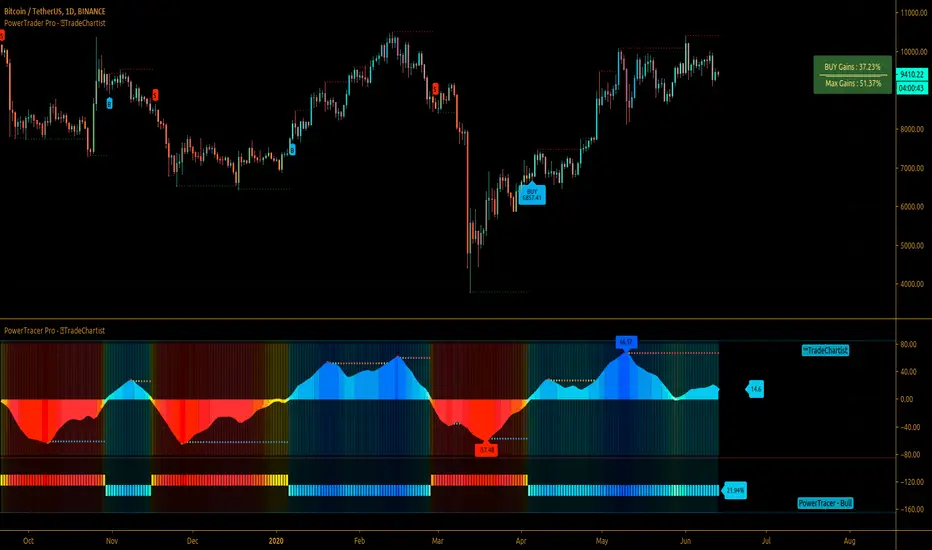
TradeChartist PowerTracer™TradeChartist PowerTracer is an exceptionally well designed and functional indicator, requiring minimal user input to trace the asset's Bull and Bear Power. The indicator makes it visually engaging with its various color schemes and intelligent positioning of the PowerTracer Bar, tracking not just the current trend, but also the developing trend using a visually easy to understand Power plots.
What does ™TradeChartist PowerTracer do?
1. Tracks Bull and Bear Power and plots the information visually on chart using one of the following 3 Power plot options based on high or low power detection sensitivity.
𝗣𝗼𝘄𝗲𝗿𝗧𝗿𝗮𝗰𝗲𝗿 - Plot of the Bull and Bear Power Oscillator, pivotal to this script that tracks the true Bull and Bear Power along with Bull/Bear oscillator reading, calculated dynamically using a unique and original formula. Values beyond 50 and -50 are quite rare, but theoretically, they can go beyond 80 and -80. 𝗣𝗼𝘄𝗲𝗿𝗧𝗿𝗮𝗰𝗲𝗿's highs and lows are also tracked and updated real-time using labels placed exactly at the Highs and Lows with their readings.
Bar-wise Power Holder - Absolute Bull and Bear power of each bar. It is plotted by calculating the difference between Bull and Bear Power or each bar. The values can swing between -100 and +100 even though values above 90 and below 90 are rare. The bar color on the chart will be painted using this value to visually display the Bull/Bear strength if "Paint Bars on Chart" is enabled from the indicator settings.
Bar-wise Power Fight - Plot of Maximum Bull and Bear Power of every bar that helps visualize the fight between Bulls and Bears in each bar.
2. Visually displays the Balance of Power between the Bulls and the Bears using Opponent Power Gain background fill when it is 50% or over. For example, if the current PowerTracer plot is a Bull zone, enabling this setting with Opponent Power Gain % set at 75, will paint the background when Bear Power increases beyond 75% using the Bear Power Intensity fill based on Color Scheme the user opts from the settings. This option can be enabled or disabled from settings and the Opponent Power gain % (minimum 50%) can also be adjusted to spot the change in price trend early on.
3. Uses an accompanying 𝗣𝗼𝘄𝗲𝗿𝗧𝗿𝗮𝗰𝗲𝗿 bar that helps spot the true bull and bear power using simple linear blocks, displaying the power level using power intensity colors based on the color scheme.
4. Paints price bars and PowerTracer background using Power intensity colors based on Color Scheme from the indicator settings, which helps spot the increase or decrease in Bull and Bear Power.
5. Inverts bar colors, background fill and PowerTracer bar color to help see price using the Opponent's Point of View.
What markets can this indicator be used on?
-- Forex
-- Stocks - works best with 4hr or above and prices calculated taking gaps into account.
-- Commodities
-- Cryptocurrencies
and almost any asset on Trading View
What time-frames can this indicator be used on?
This indicator can be used on all timeframes. If the asset has very little volume/volatility or is far low in comparative value against the base currency, power detection can be choppy, but with most assets, this won't be an issue.
Does this indicator repaint?
-- No. Real-time Power plots can change colors and values based on current bar close as values get calculated dynamically. Once the bar closes, plots and power intensity colors don't repaint.
-- This can be verified using Bar Replay to check if the plots and fills stay in the same bar in real time as the Bar Replay
Does the indicator send alerts when the power shifts from Bull to Bear or from Bear to Bull?
Yes. Users can get alerts when Power gets shifted using Trading View alerts. This can be done by choosing '™TradeChartist PowerTracer' and 'Powershift to Bulls' or 'Powershift to Bears' under Trading View Alert condition and by using 'Once per bar close' as user needs to wait for candle close for Power shift confirmation.
Example Charts
In this split screen chart of Bitcoin, it can be seen how the 30m chart on left is Bearish and 5m chart on right is Bullish based on Power changes. The trend can be spotted on PowerTracer by spotting the Opponent's background fill that started showing when Opponent's power gained by over 75%. This is a good example using the script for scalping/swing trading using 2 timeframes. Note that the chart on the left shows Price bars and PowerTracer bar with inverted colors to show Opponent's point of view.
In this 15m chart of GBP-USD, 100% Power gain for Entries and Exits is used. This is a more conservative approach and is suited for less aggressive traders based on complete change of trend.
In this 2hr chart of Ethereum, all 3 Power plots are used to identify the trend using low sensitivity using 100% Power Gain entries and this shows how a trade can be held longer to maximise gains using entries with Power shift confirmations.
===================================================================================================================
This is not a free to use indicator. Get in touch with me (PM me directly if you would like trial access to test the indicator)
Premium Scripts - Trial access and Information
Trial access offered on all Premium scripts.
PM me directly to request trial access to the scripts or for more information.
===================================================================================================================
