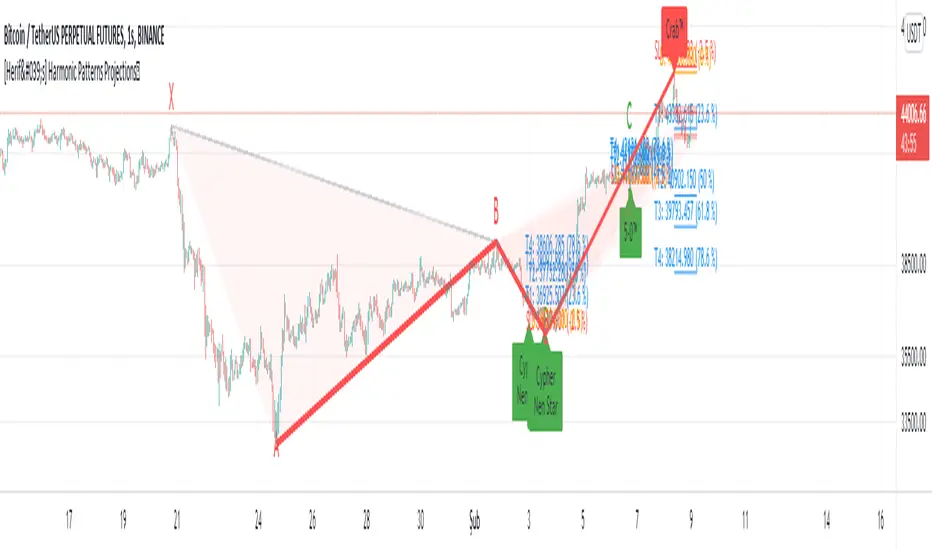
[Herif's] Harmonic Patterns ProjectionBullish and bearish 5-point patterns are based on various Fibonacci retracement levels and signify potential reversal zones (PRZ).
As they become 0%-80% complete, the dashed-line pattern will appear, displaying the PRZ and giving you time to prepare for a reversal.
Different combinations of specific fib retracements and extensions result in different patterns, and each is named for identification.
Bullish patterns signify a potential turn to the upside are colored green.
Bearish patterns signify a potential turn to the downside are colored red.
1- Live harmonic patterns which are still in trade with XABCD and ratio with labels.
2- Entry, Stop and Target levels on chart for all patterns.
in Settings:
Error Percent - This is error tollerance for matching pattern ratios. Cannot expect price ratios to be exactly as per books. Hence, adding few error tolerance will help identify patterns better. In this indicator defatult 1%
When there are multiple patterns on chart, Entry, Stop, and Target labels and lines are created with specific distance from each other to provide clarity to the users.
Trailing and Targets
1-Trailing Start Stage - Defines when to start trailing stop-loss. It is recommended to set this value to either Target 1 or Target 2. Disabling the trailing or setting too far away may lead to being in trade on ranging market for too long. This may also result in drawing errors related to distance from current bar.
2- Custom Target Levels - Target and stop levels are set to optimal values based on individual patterns. If you want to override these levels, use the available input option to override targets and chose your custom Target1, Target2, Target3 and Target4
All Pending Patterns you can enable or disable
Classic Patterns : Gartley , Bat, Butterfly , Crab , Deep Crab , Cypher , Shark , Nenstar
Anti Patterns: Anti Nenstar, Anti Shark , Anti Cypher , Anti Crab , Anti Butterfly , Anti Bat, Anti Gartley , Navarro 200
Pending Patterns example here
Potentialreversalzone
Fear Of Missing Out grid of forex tradingAbstract
This script finds potential safe grids placing limit orders without fear of missing out.
This script computes grids according to power of 1.0025 .
You can reference those price levels for your trading.
Introduction
Grid trading is a popular trading method.
Traders plan several price levels as grids and repeat buying at lower grids and selling at higher grids.
Grids can be round number like multiple of 100 pips.
Grids can also be support and resistance according to price history.
Some traders may think they need to adjust grids to trade.
However, there are several problems in choosing grids.
One problem is rate of change is related and therefore exponential. 20 to 30 is different from 30 to 40.
Another interesting point is there are some special impressing reversal price levels.
Several months ago, I had a question why usdjpy bounced near 108.3 .
After using a calculator, I found that 108.3 = 100 * 1.083 ≒ 100 * pow(1.0025,31) .
1.0025 , as known as 0.25% of change, is a potential stop out zone.
Therefore, we can compute grids and one grid is a little more than 1.0025 times than an another one.
After we finished computing grids, we can consider buy and sell near those grids.
Note that different traders may obtain different grid values.
For example, from 1.0 to 2.0 , it can be splited as 270 grids or 277 grids because pow(1.0025,277)<2 .
Those grids cannot always imply potential reversal points but they can be useful for traders looking for 0.25% profit targets with reducing fearing of buying or selling too early.
Computing grids
This script split from 1.0 to 10.0 into three segments.
One is 1.0 to 2.0 .
The second segment is from 2.0 to 5.0 .
The third segment is from 5.0 to 10.0 .
This script does the same thing for 0.1 to 1.0 , 10.0 to 100.0 , and so on.
For 1.0 to 2.0 and 5.0 to 10.0 , this script split a segment as 270 grids.
For 2.0 to 5.0 , this script split a segment as 360 grids.
The last step is display the next grids to the daily low and daily high.
Maybe also display the grids behind grids shown.
Parameters
x1,x2,x3,x4 : display the next x1,x2,x3,x4 grids to daily high and daily low. 1 means the next grid to daily high and daily low. 2 means the next grid to 1.
x_seg : default 2.0 . This script split from 1.0 to 10.0 into three segments. One is 1.0 to x_seg. The second segment is from x_seg to 10.0/x_seg . The third segment is from 10.0/x_seg to 10.0 .
x_grid1 : how many grids in the first segment
x_grid2 : how many grids in the second segment
x_lowprice : add this number for bigger grid distance. Generally, you don't need this number when trading forex but you may need it in stock trading. For stocks with price between 50 to 100, I recommend you use x_lowprice=100.
Conclusion and suggestions
This script can find potential grids for trading.
If price touches grids usually, we can consider buy and sell after price touches grids.
If price reverses before touching grids usually, we may consider buy and sell before price touches grids.
Those grids can remind us don't buy too much unless the price touches the next grid.
For instruments with less volatility, maybe we need more grids.
For traders with more money, they may also consider more grids for more dedicated range trading to collect more profit.
Reference
Sorry, I forgot them.

XABCD ScannerXABCD Scanner for TradingView
These bullish and bearish 5-point patterns are based on various Fibonacci retracement levels and signify potential reversal zones (PRZ).
As they become 80% complete, the dashed-line pattern will appear, displaying the PRZ and giving you time to prepare for a reversal.
Different combinations of specific fib retracements and extensions result in different patterns, and each is named for identification.
Bullish patterns signify a potential turn to the upside are colored green.
Bearish patterns signify a potential turn to the downside are colored red.
9 popular patterns are currently recognized.
XABCDs can be applied to all markets: crypto, forex, commodities, indices, etc.
For access, please visit the link in our Signature below, or shoot us a PM.


RAGNAROK MK IIRagnarok MK II the second gen of Sniper V7. A trend market indicator which confirms the sentiments of the traders where it is heading; such as a possible reversal, exit and entry indication. For those who are interested you can try Sniper v7 for free; Just favorite the script so you can use it into your chart. Feel free to dm me for questions and suggestions. :)
You can check down below about the Sniper V7 for the successful trade using the indicator
EXAMPLE OF SNIPER V7
SANUSD 2H
EOS 4H
ETHUSD 2H
