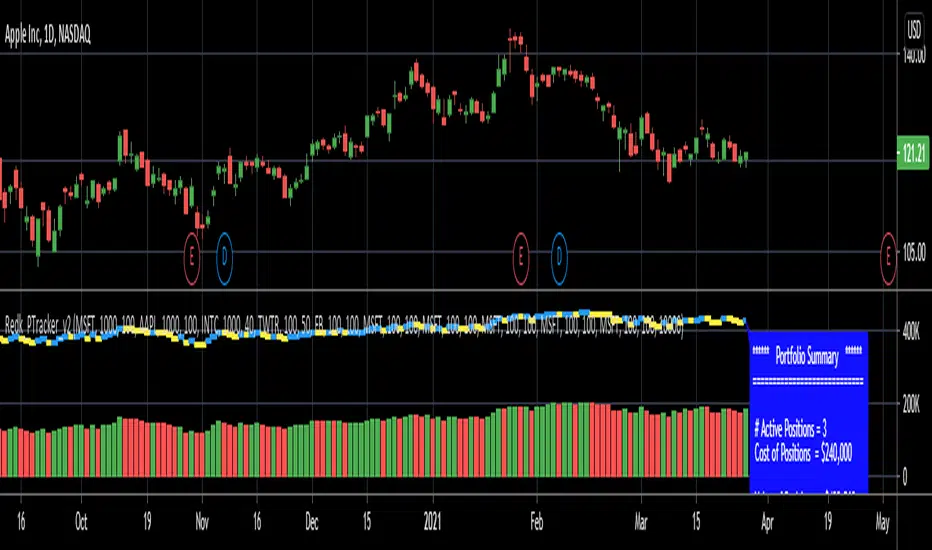
Stock Management (Zeiierman)█ Overview
Stock Management (Zeiierman) gives investors a complete, real-time view of their portfolio directly inside TradingView. It tracks performance, allocation, volatility, and dividends in one unified interface, making it easy to understand both how your portfolio is performing and how it behaves in terms of risk and exposure.
Rather than analyzing each chart in isolation, Stock Management (Zeiierman) turns TradingView into a lightweight portfolio cockpit. You can define up to 20 stock positions (ticker, shares, average cost), and the tool will:
Normalize all positions into a single user-selected currency
Calculate live position value, PnL, PnL%, and daily movement
Compute total portfolio value, performance, and volatility
Optionally generate a risk-parity style Recommended Allocation
Display upcoming dividend amounts, ex-dates, and pay-dates for your holdings
All of this appears as clean on-chart tables, including a main portfolio table, an optional dividend table, and an optional summary panel, allowing you to manage your portfolio while still watching price action. It is a visual portfolio layer built entirely around your own inputs, integrated seamlessly into the TradingView environment.
⚪ Why This One Is Unique
Most investors rely on basic broker dashboards that show position values but provide little insight into risk, exposure, or how each holding interacts with the rest of the portfolio. Stock Management (Zeiierman) goes far beyond that by building an intelligent, unified portfolio layer directly inside TradingView.
It automatically normalizes global holdings into a single reporting currency using live FX data, stabilizes allocation with a volatility-aware weighting engine, and structures your information through an adaptive column framework that highlights performance and risk in real time. A weighted summary blends portfolio movement, volatility, and long-horizon behavior into a clean snapshot, while dividend schedules and projected payouts are fully integrated into the same interface.
█ Main Features
⚪ 1. Portfolio Tracker
The core of Stock Management (Zeiierman) is a dynamic, real-time portfolio table that brings all key position data into one intelligent view. Each holding is displayed with:
Ticker
Sector
Price
Average Paid Price
Shares
Position Value
Position Weight
Profit & Loss
Profit & Loss %
Today % Change
Recommended Allocation
The table updates continuously with market prices, giving investors an immediate understanding of performance, exposure, and risk across all positions.
⚪ 2. Dividend Information
Dividend data for your holdings is automatically fetched, organized, and presented alongside your positions. This includes dividend amount, ex-date, and pay-date, along with projected payouts based on your share count. All dividend-related information is integrated directly into the portfolio view, so you can plan cash flow without switching tools.
⚪ 3. Portfolio Summary
A dedicated summary panel consolidates the entire portfolio into a single snapshot: total value, total PnL, YTD %, today’s change, and overall volatility. The volatility reading is particularly valuable, providing a quick gauge of your portfolio’s risk level and how sensitive it may be to market movement.
⚪ 4. Portfolio Weight Recommendation
An intelligent weighting engine reviews your current allocations and highlights where your portfolio is overexposed or underweighted. It offers recommended allocation levels designed to reduce concentration risk and improve balance, giving you a clearer path toward a more stable long-term positioning.
█ How to Use
⚪ Performance Tracking
Quickly assess your entire portfolio’s profit, loss, daily movement, and volatility from one centralized dashboard. The summary panel gives you an instant read on how your holdings are performing and how sensitive they are to market swings.
⚪ Dividend Management
Monitor upcoming dividend amounts, ex-dates, and pay-dates directly inside your portfolio table. This ensures you never miss a payout opportunity and can plan your expected cash flow with complete clarity.
⚪ Risk Management & Optimization
Use portfolio-wide volatility and the intelligent Recommended Allocation engine to identify imbalances in your holdings. These insights help you adjust position sizes, reduce concentration risk, and maintain a more stable long-term portfolio profile.
⚪ Currency Comparison
Switch between different base currencies to evaluate performance in local or international terms. All positions are automatically normalized using live FX data, making global portfolio management effortless.
█ How It Works
Stock Management (Zeiierman) continuously gathers price, currency, dividend, and volatility data for every ticker you track. All values are automatically converted into your selected reporting currency, so global holdings remain comparable in one unified view.
It builds a live portfolio snapshot of each bar, updating position values, PnL, daily returns, YTD performance, and overall volatility. This gives you an always-current understanding of how your portfolio is performing and how each holding contributes to risk and exposure.
An intelligent, volatility-aware allocation model generates recommended portfolio weights and position sizes, helping you identify where you may be overexposed or underweighted. Dividend information is integrated directly into the table, projecting future payouts and highlighting upcoming ex-dates and pay-dates.
-----------------
Disclaimer
The content provided in my scripts, indicators, ideas, algorithms, and systems is for educational and informational purposes only. It does not constitute financial advice, investment recommendations, or a solicitation to buy or sell any financial instruments. I will not accept liability for any loss or damage, including without limitation any loss of profit, which may arise directly or indirectly from the use of or reliance on such information.
All investments involve risk, and the past performance of a security, industry, sector, market, financial product, trading strategy, backtest, or individual's trading does not guarantee future results or returns. Investors are fully responsible for any investment decisions they make. Such decisions should be based solely on an evaluation of their financial circumstances, investment objectives, risk tolerance, and liquidity needs.
Portfoliotracker
𝙷✪𝚕𝚍𝚎𝚖 🦇 Multi-Exchange Position Tracker v5.51
𝙷✪𝚕𝚍𝚎𝚖 🦇 Multi-Exchange Position Tracker v5.51
Overview
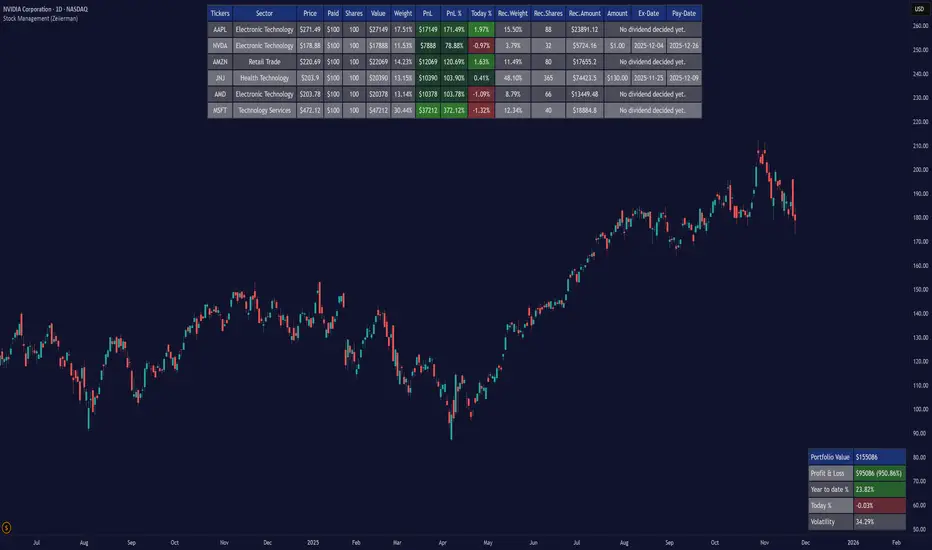
The 𝙷✪𝚕𝚍𝚎𝚖 🦇 Multi-Exchange Position Tracker v5.51 is a powerful and highly customizable Pine Script v6 indicator designed for traders managing portfolios across multiple exchanges and assets. This advanced dashboard provides real-time tracking of up to 20 positions, offering comprehensive insights into your trading performance with support for Dollar-Cost Averaging (DCA), leverage, and risk management.
Key Features
Multi-Exchange Support : Track positions across major exchanges like Binance, Bybit, Bitvavo, Coinbase, Kraken, and OKX.
Multi-Asset Management : Monitor up to 20 assets with customizable symbols, directions (Long/Short), and leverage settings.
DCA Calculations : Input comma-separated entry prices and sizes for accurate Dollar-Cost Averaging calculations.
Real-Time Data : Fetches current prices for each asset to calculate position value, profit/loss (P/L), and allocation percentages.
Customizable Dashboard : Display key metrics such as Asset, Direction, Leverage, Average Entry, Current Price, Size, Value, P/L, P/L (%), Allocation (%), Risk (%), TP1 (%), and TP2 (%) in a flexible table.
TP/SL/Entry Visualization : Plot Take Profit (TP1, TP2), Stop Loss (SL), and Entry levels directly on the chart with customizable line styles, widths, and colors.
Alerts : Receive notifications when TP1, TP2, or SL levels are hit for any enabled asset.
Theming Options : Choose between Dark and Light themes with adjustable transparency, zebra row styling, and cell padding for enhanced readability.
Currency Conversion : Supports USD and EUR as base currencies, with automatic conversion for assets quoted in different currencies.
Debugging Tools : Enable debug labels to troubleshoot NaN issues or DCA mismatches.
How to Use
1. Configure Assets : In the "Asset Positions" section, enable up to 20 assets and specify their exchange, symbol, direction, leverage, entry prices, sizes, stop loss, and take-profit levels.
2. Customize Dashboard : Adjust visibility of columns, table position, size, and styling under "Dashboard Settings" and "Column Visibility" sections.
3. Set Base Currency : Choose USD or EUR for unified P/L and value calculations.
4. Visualize Levels : Enable TP/SL/Entry plotting to see key price levels on the chart, with customizable styles and label positions.
5. Enable Alerts : Turn on alerts to get notified when price crosses TP or SL levels.
6. Debugging : Use debug labels to identify and resolve any input errors or invalid symbols.
Settings Breakdown
Dashboard Settings : Toggle dashboard visibility, hide zero-size positions, show total account row, and set table position/size.
Column Visibility : Select which columns to display (e.g., Asset, P/L, Risk %).
Styling & Colors : Customize themes (Dark/Light), transparency, zebra row colors, and border styles.
TP/SL/Entry Styling : Adjust line styles, widths, colors, and label positions for Stop Loss, Take Profit, and Entry levels.
Asset Positions : Input details for each asset, including exchange, symbol, direction, leverage, and DCA entries.
Notes
Ensure correct symbol formats (e.g., BTCUSDT for Binance, ADAEUR for Bitvavo) to avoid price fetch errors.
DCA entries and sizes must match in count and be valid numbers to prevent calculation errors.
The indicator supports up to 500 lines and labels for optimal performance.
For best results, use on a chart matching one of your tracked asset symbols to visualize TP/SL/Entry lines.
Why Use This Indicator?
This indicator is ideal for traders juggling multiple positions across exchanges. It consolidates critical data into a single, visually appealing dashboard, saving time and improving decision-making. With robust customization, real-time calculations, and alert functionality, it’s a must-have tool for both novice and experienced traders.
Developed by 𝙷✪𝚕𝚍𝚎𝚖 🦇, 2025 ©
ETF Builder & Backtest System [TradeDots]Create, analyze, and monitor your own custom “ETF-like” portfolio directly on TradingView. This script merges up to 10 different assets with user-defined weightings into a single composite chart, allowing you to see how your personalized portfolio would have performed historically. It is an original tool designed to help traders and investors quickly gauge risk and return profiles without leaving the TradingView platform.
📝 HOW IT WORKS
1. Custom Portfolio Construction
Multiple Assets : Combine up to 10 different stocks, ETFs, cryptocurrencies, or other symbols.
User-Defined Weights : Allocate each asset a percentage weight (e.g., 15% in AAPL, 10% in MSFT, etc.).
Single Composite Value : The script calculates a weighted “ETF-style” price, effectively simulating a merged portfolio curve on your chart.
2. Performance Tracking & Return Analysis
Automatic History Capture : The indicator records each asset’s starting price when it first appears in your chosen date range.
Rolling Updates : As time progresses, all asset prices are continually evaluated and the portfolio value is updated in real time.
Buy & Hold Returns : See how each asset—and the overall portfolio—performed from the “start” date to the most recent bar.
Annualized Return : Automatically calculates CAGR (Compound Annual Growth Rate) to help visualize performance over varying timescales.
3. Table & Visual Output
Performance Table : A comprehensive table displays individual asset returns, annualized returns, and portfolio totals.
Normalized Chart Plot : The composite ETF value is scaled to 100 at the start date, making it easy to compare relative growth or decline.
Optional Time Filter : You can define a specific date range (Start/End Dates) to focus on a particular period or to limit historical data.
⚙️ KEY FEATURES
1. Flexible Asset Selection
Choose any symbols from multiple asset classes. The script will only run calculations when data is available—no need to worry about missing quotes.
2. Dynamic Table Reporting
Start Price for each asset
Percentage Weight in the portfolio
Total Return (%) and Annualized Return (%)
3. Simple Backtesting Logic
This script takes a straightforward Buy & Hold perspective. Once the start date is reached, the portfolio remains static until the end date, so you can quickly assess hypothetical growth.
4. Plot Customization
Toggle the main “ETF” plot on/off.
Alter the visual style for tables and text.
Adjust the time filter to limit or extend your performance measurement window.
🚀 HOW TO USE IT
1. Add the Script
Search for “ETF Builder & Backtest System ” in the Indicators & Strategies tab or manually add it to your chart after saving it in your Pine Editor.
2. Configure Inputs
Enable Time Filter : Choose whether to restrict the analysis to a particular date range.
Start & End Date : Define the period you want to measure performance over (e.g., from 2019-12-31 to 2025-01-01).
Assets & Weights : Enter each symbol and specify a percentage weight (up to 10 assets).
Display Options : Pick where you want the Table to appear and choose background/text colors.
3. Interpret the Table & Plots
Asset Rows : Each asset’s ticker, weighting, start price, and performance metrics.
ETF Total Row : Summarizes total weighting, composite starting value, and overall returns.
Normalized Plot : Tracks growth/decline of the combined portfolio, starting at 100 on the chart.
4. Refine Your Strategy
Compare how different weights or a new mix of assets would have performed over the same period.
Assess if certain assets contribute disproportionately to your returns or volatility.
Use the results to guide allocations in your real trading or paper trading accounts.
❗️LIMITATIONS
1. Buy & Hold Only
This script does not handle rebalancing or partial divestments. Once the portfolio starts, weights remain fixed throughout the chosen timeframe.
2. No Reinvestment Tracking
Dividends or other distributions are not factored into performance.
3. Data Availability
If historical data for a particular asset is unavailable on TradingView, related results may display as “N/A.”
4. Market Regimes & Volatility
Past performance does not guarantee similar future behavior. Markets can change rapidly, which may render historical backtests less predictive over time.
⚠️ RISK DISCLAIMER
Trading and investing carry significant risk and can result in financial loss. The “ETF Builder & Backtest System ” is provided for informational and educational purposes only. It does not constitute financial advice.
Always conduct your own research.
Use proper risk management and position sizing.
Past performance does not guarantee future results.
This script is an original creation by TradeDots, published under the Mozilla Public License 2.0.
Use this indicator as part of a broader trading or investment approach—consider fundamental and technical factors, overall market context, and personal risk tolerance. No trading tool can assure profits; exercise caution and responsibility in all financial decisions.

Portfolio [Afnan]🚀 Portfolio - Advanced Portfolio Management Indicator 📊
A game-changing portfolio management tool designed to help traders stay on top of their positions and manage risk efficiently. This indicator combines detailed tracking, real-time analytics, and visual clarity to ensure traders are well-equipped for the dynamic world of financial markets.
📈 Key Features 💡
Track up to 14 positions with ease
Real-time Profit & Loss (P&L) updates and risk metrics
Visual representation of entry, stop-loss (SL), and target levels
Alerts for stop-loss breaches and target achievements
Comprehensive portfolio summaries for quick analysis
Customizable options to suit individual trading styles
🔍 Main Components ⚙️
📊 1. Position Tracking
Detailed position data: entry, stop-loss, target levels, and more
Real-time risk-reward ratios
Insights into position size and exposure percentages
Continuous updates on P&L in real-time
📉 2. Visual Indicators
Clear visual markers for entry, SL, and target prices
Price labels with detailed percentage changes
Indicators that show the current position's market status
💼 3. Portfolio Summary
Aggregate account values and exposure
Summarized P&L metrics across all positions
Risk management insights for better decision-making
Daily performance tracking to evaluate strategies
⚠️ 4. Alert System
Instant notifications for stop-loss breaches
Alerts when target prices are hit
Alerts operate for the current chart symbol
⚡ Customization Options 🎨
Show or hide specific data columns
Adjust the table's position and size for better visibility
Personalize color schemes and text styles
Switch between full portfolio view and single symbol focus
📱 How to Use 📝
Input your positions in the indicator's settings
Enable or disable specific positions dynamically
Customize display preferences to your liking
Set up alerts for proactive risk management
Monitor all your trading activities in one comprehensive dashboard
📌 Important Notes ℹ️
Compatible with any trading symbol
Updates seamlessly during market hours
Alerts are specific to the currently active chart symbol
Maximum capacity: 14 simultaneous positions
Created by: @AfnanTAjuddin
⚠️ Disclaimer ⚠️
This indicator is a tool for informational purposes only. Ensure all calculations are verified and consult a financial professional before making investment decisions.
🎯 "Stay disciplined, trade smart, and let data guide your decisions." 📊

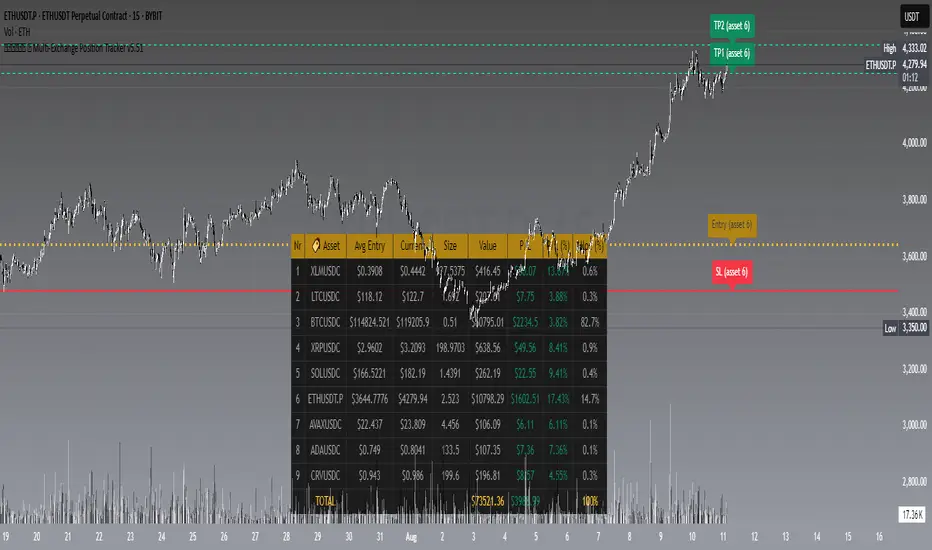
Portfolio SnapShot v0.3Here is a Tradingview Pinescript that I call "Portfolio Snapshot". It is based on two other separate scripts that I combined, modified and simplified - shoutout to RedKTrader (Portfolio Tracker - Table Version) and FriendOfTheTrend (Portfolio Tracker For Stocks & Crypto) for their inspiration and code. I was using both of these scripts, and decided to combine the two and increase the number of stocks to 20. I was looking for an easy way to track my entire portfolio (scattered across 5 accounts) PnL on a total and stock basis. PnL - that's it, very simple by design. The features are:
1) Track PnL across multiple accounts, from inception and current day.
2) PnL is reported in two tables, at the portfolio level and individual stock level
3) Both tables can be turned on/off and placed anywhere on the chart.
4) Input up to 20 assets (stocks, crypto, ETFs)
The user has to manually calculate total shares and average basis for stocks in multiple accounts, and then inputs this in the user input dialog. I update mine as each trade is made, or you can just update once a week or so.
I've pre-loaded it with the major indices and sector ETFs, plus URA, GLD, SLV. 100 shares of each, and prices are based on the close Jan 2 2024. So if you don't want to track your portfolio, you can use it to track other things you find interesting, such as annual performance of each sector.
Portfolio TableA tool to manage your invested assets (stocks, crypto currencies, ...).
- Show profit of every asset as well as the total profit.
- Show/hide a bought price line on the chart if the current selected ticker is on your portfolio.

basilPort Portfolio Tracker Pro [basilChart]This script is helps giving detailed information about the portfolio.
Prominent features of this portfolio tracking indicator are:
- Chart of your portfolio: This portfolio tracker let’s you view the chart of your portfolio real-time.
- Visualized Profit/Loss: Indicator will let you know of your profit and loss on the chart.
- In-Depth Monitoring: Most Gained 1st, 2nd, 3rd and Most Lost 1st, 2nd, 3rd.
- All Time Highs: Let’s us view All Time Highs on the portfolio chart for each equity on the chart.
- 40 Different Symbols: Supports monitoring 40 different symbols at the same time, real-time.
- 10 Pair Detailed View: For the first 10 symbol in our portfolio, indicator supports viewing detailed info about each of them. Such as: Price, Cost, Qty, Profit Percentage, Chart TF Profit Percentage, Weight
basilPort Portfolio Tracker Pro indicator can be used to:
- Track your investments: The basilPort Portfolio Tracker allows you to enter all your investments and their associated details, such as the ticker symbol, purchase price, and quantity. It then calculates your total portfolio value, including gains and losses.
- Monitor portfolio performance: Provides an overview of your portfolio's performance over time. You can see how your portfolio is performing on a daily, weekly, or monthly basis, and compare it to the performance of the overall market.
- Analyze asset allocation: Helps you analyze your portfolio's asset allocation, which is the percentage of your portfolio invested in different symbols. You can use this information to adjust your portfolio and diversify your holdings.
- Set investment goals: You can use the Portfolio Tracker to set investment goals and track your progress towards achieving them. For example, you can set a goal of achieving a certain rate of return or accumulating a specific amount of wealth by a certain date.
Overall, the Portfolio Tracker is a useful tool for investors who want to monitor their portfolio's performance, evaluate their investment strategies, and make informed investment decisions.
Best and worst 3 performers in our portfolio:
From Data Window, script let’s us see the best and worst 3 performers in our portfolio. To know how to read it we follow this pattern:
- Check 1st Gained value.
- Find the nth symbol from script’s Inputs tab.
- Check 1st Gained to see its Profit Percentage.
An example scenario to reading Data Window is explained at the very end of the description.
Using the script:
- Add this script to the chart from indicators tab
- Set starting date for the basilGrid Portfolio Tracker Pro either by dragging and dropping the vertical line or by the date-time picker from indicator Inputs tab.
- Set symbols and enable them to monitor with this indicator.
- Set quantity and price information for the symbols you have selected.
- Set visual settings to tailor your experience.
basilPort Portfolio Tracker is an indicator that allows you to track and analyze the performance of your investment portfolio over time. It's a helpful tool for investors who want to monitor their holdings and evaluate their investment strategies.
In this example we used pair BTCUSDT 1h timeframe, our settings are:
Inputs Tab:
- Start Date: 2022-12-13 13:00
- Show All Time Highs: Unchecked
- Show Pair Data (First 10): Checked
- Show Total Data: Checked
Symbols:
- BINANCE:ETHUSDT Qty 4.2 Price 1 332
- BINANCE:BTCUSDT Qty 0.5 Price 17 469
- BINANCE:BNBUSDT Qty 20 Price 270
- BINANCE:AVAXUSDT Qty 200 Price 13.61
- BATS:PYPL Qty 50 Price 78.5
- BATS:AMZN Qty 40 Price 95.4
- BATS:ETSY Qty 40 Price 135.64
For example, if you check Data Window, you'll see the following:
An example scenario:
- Bought Portfolio Value 39142.98 => The cost of the portfolio
- Current Portfolio Value 39142.98 => The current value of the portfolio
- 1st Gained 2.00 => The most gained symbol's index. (Checking the Symbols what we see on the 2nd spot is this symbol, we can see this value indicates BINANCE:BTCUSDT)
- 1st Gained 28.09 => Means BINANCE:BTCUSDT is +%28.09
- 2nd Gained 4.00 => Again, after checking the Symbols, we now know what this value indicates. It is AVAXUSDT.
- 2nd Gained 18.59 => Means BINANCE:AVAXUSDT is +%18.59
..
And so on to Lost section. Only difference between Gained and Lost section indicates Lost equities.
This script's purpose is to make easier to have more control over the portfolio. With in depth data that’ll help with decision-making.

Portfolio Tracker For Stocks & CryptoThis is a portfolio tracker that will track individual, overall and daily profit/loss for up to 12 assets. You can set the size of your buys and price of your buys for accurate, up to date profit and loss data right on your chart. It works on all markets and timeframes.
HOW TO USE
Go into the indicator settings and you will see all of the available settings. The first is the ability to turn the tracker info table on or off from the chart, so it saves your portfolio info but let’s you remove it from the chart while trading. Second is the option to move the position of the info table to suit your preference.
Next we get into setting up your portfolio tickers, order size and price. Each ticker lets you set which stock/crypto you bought, then set how much you purchased and then what price you purchased them at.
Go through and set up all of your assets and then turn off any tickers that you don’t need. Once that is all done, your portfolio will be shown on the chart with all the data.
FEATURES
Top Section
The portfolio tracker has 2 sections. The top section shows each ticker in your portfolio individually with the following data:
- Ticker Name
- Weight of that asset compared to your total portfolio in %
- Current value of that position in $
- Profit or loss value from purchase price in %
- Todays change in value from yesterday’s close in %
The $ Value, PnL % and Today % will all change colors from green to red depending if they are in profit or not.
Bottom Section
The bottom section of the tracker will give you info for your portfolio as a whole. It has the following data:
- Total cost of your entire portfolio in $
- Current value of your entire portfolio in $
- Current profit or loss of your entire portfolio in $
- Current profit or loss of your entire portfolio in %
- Todays change of your entire portfolio value compared to yesterday’s close in %
The $ Value, PnL $, PnL % and Today % will all change colors from green to red depending if they are in profit or not.

Portfolio PerformanceThis indicators will help you to compute portfolio performance and display results with a stats table and a nice monthly chart.
In this script you can do following:
Compose portfolio with up to 15 instruments
Change Initial capital / date range / rebalancing period
Compare portfolio performance with a benchmark
Compute basic stats
Compute instruments contribution
Display monthly performance of portfolio and benchmark
Change style for almost everything you see on your chart
Hope it will be useful for you!
Thanks to @MUQWISHI for helping me coding it.
Disclaimer
Please remember that past performance may not be indicative of future results.
Due to various factors, including changing market conditions, the strategy may no longer perform as well as in historical backtesting.
This post and the script don’t provide any financial advice.

Portfolio Performance - Effects of RebalancingFunction:
- Can be used to evaluate the performance of a portfolio containing 2 assets over a set time interval
- Shows the % return of the portfolio over the time interval defined by the user
- Includes a threshold rebalancing algorithm to show the effects that rebalancing has on the portfolio over the long term
- Created to evaluate of the performance of portfolios containing different weightings of stocks and bonds over time assuming that the user would rebalance the portfolio when asset weights crossed a threshold
Instructions:
- To be used with dividends adjustments turned on
- Add this script to a symbol. e.g. AMEX:SPY
- Click the chart to define the entry time and the exit time. i.e. the time interval
- Define the initial investment of the portfolio. Default setting is $100,000
- Define the second asset to be included in the portfolio. e.g. BATS:AGG
- The strategy comes pre-populated with a portfolio that has a weight of 80% asset 1 and 20% asset 2. i.e. 80% AMEX:SPY and 20% BATS:AGG if the symbols mentioned above were chosen
- The 7 lines show the weighted % return of each portfolio over the time period defined by the user
- Each line (except the blue) is the return based on a different rebalancing threshold. The default settings are 1%, 2.5%, 5%, 10%, 15%, 20%, 30%
- The blue line is the % return of a portfolio that was made up of 100% asset 1 over the time interval. i.e. 100% AMEX:SPY
- Asset weights and rebalancing thresholds are adjustable via the settings
- Each plot can be turned on and turned off via a tick box in the settings

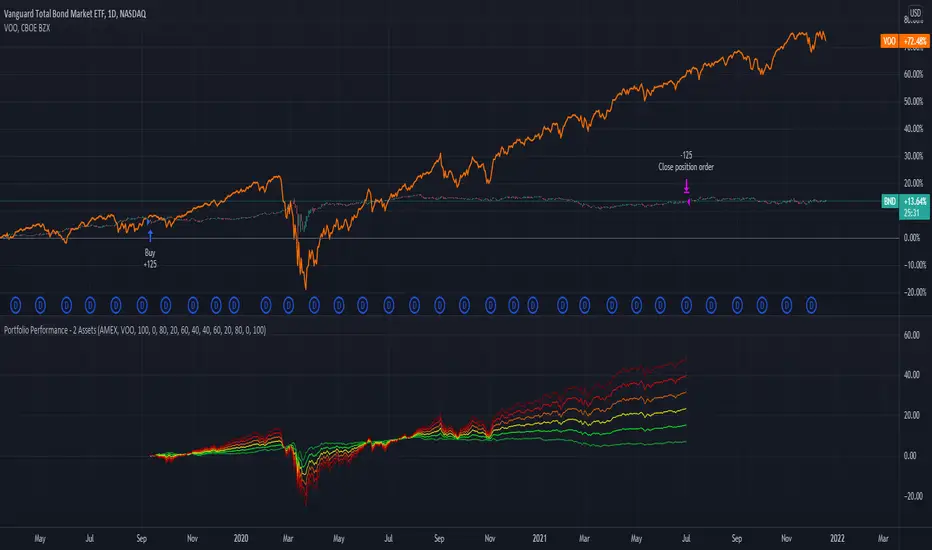
Portfolio Performance - 2 AssetsFunction:
- Can be used to evaluate the performance of portfolios containing 2 assets over a set time interval
- Created to evaluate of the performance of portfolios containing different weightings of stocks and bonds over time
- Shows the % return of each portfolio over the time interval defined by the user
- Capable of showing the risk adjusted % return of each portfolio over the time interval defined by the user (setting turned off by default)
Instructions:
- To be used with dividends adjustments turned on
- Add this script to a symbol. e.g. NASDAQ:BND
- Click the chart to define the entry time and the exit time. i.e. the time interval
- Define the second asset to be included in the portfolio. e.g. AMEX:VOO
- The strategy comes pre-populated with 6 portfolios with the most common stock/bond weightings (100% stocks/0% bonds, 80% stocks/20% bonds, 60% stocks/40% bonds, et cetera)
- The 6 lines show the weighted % return of each portfolio over the time period defined by the user
- All asset weights are adjustable via the settings
- Each plot can be turned on and turned off via a tick box in the settings
- There are 6 plots that show the risk adjusted returns of each portfolio (setting turned off by default)
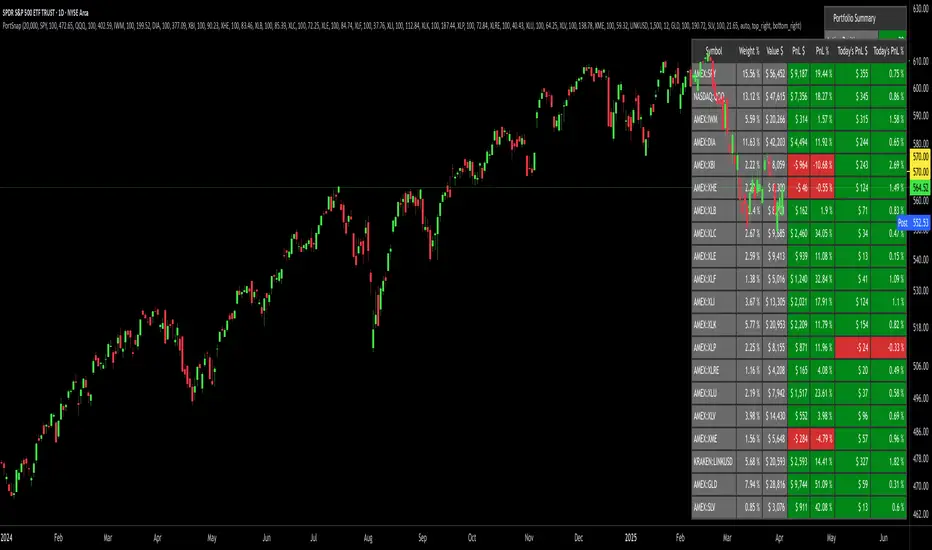
RedK_Portfolio Tracker v2: few enhancements and display optionsThis is an update for the PTracker v1 that I published couple of days ago. wanted to publish this as a separate script to get a chance to show how the new Portfolio Summary Infobox can be displayed on the price chart as an option. In my opinion, that info box is the most important element in this tool and that's the piece i was most looking for.
quick note here: you can track your portfolio (if not so many positions) by entering something like (without the brackets) in TradingView's chart symbol area - TradingView will resolve these symbols and chart the total -- there's a nice post by our friend @boji1 about this in a lot more details - however, that wouldn't show the stats that i need to look at to track my portfolio on daily basis.
i also made couple of other enhancements, like adding the ability to include "free cash" in the portfolio - While this free cash value will impact the Total P/L and P/L %, as part of the overall portfolio (and the denominator), it will not impact the "cost of positions" or the (current) "value of positions" -- also "Cash" will not count towards the total 10 positions that we can track with this tool.
Using Portfolio Tracker as a floating panel on the price chart
====================================================
By default, when the Portfolio Tracker is added to the chart, it will occupy its own lower panel like the picture above.
if your charts are already busy (like mine :)) - you most probably already have a couple of lower studies and it's crowded there.
in this case, you can use the Object Tree tool after adding the PTracker, to drag it onto the price panel, or you can also do that by right-clicking on the infobox and choose to move up to the price panel.
when you do that, remember to also use the Style settings of PTracker to hide both Portfolio and PnL plots, and choose Scale = no scale - this way you get the infobox to work like a floating panel on the price chart
here's a screenshot that shows this scenario - also shows how the infobox color can be easily changed from the PTracker settings to suit your chart background and for best visibility
i hope this is useful in your trading - i look forward to @TradingView team surprising us with a real portfolio tracking capability soon :)
good luck.