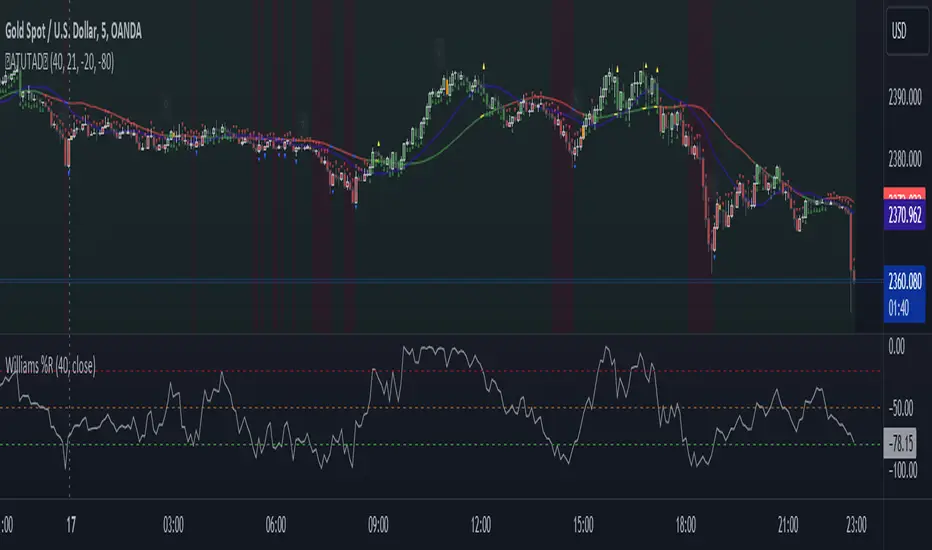
AllTheUpsTheresAlwaysDowns "AllTheUpsTheresAlwaysDowns" ☆ATUTAD☆ // w%r + ma indicator designed for forex trading.
This indicator combines the Williams %R, moving averages, and session tracking.
Key Inputs:
Williams%Range Period: Adjusts the sensitivity of the Williams %R calculation.
Moving Average Period: Defines the period for the moving average used in the indicator.
Overbought and Oversold Thresholds: Sets the thresholds for identifying overbought and oversold conditions.
Features:
Williams %R Calculation: Calculates the Williams %R, a momentum oscillator that measures overbought and oversold levels.
Moving Averages: Plots two moving averages to capitalize on and visualize trend direction.
Session Tracking: Identifies the start and end of trading sessions (Tokyo, London, New York) for better session-based analysis.
Signal Generation: Generates buy/sell signals based on Williams %R levels and moving average crossovers.
Color Coding: Visualizes color-coded bars and shapes to highlight different market conditions and signal types.
Alerts: For buy/sell signals and overbought/oversold conditions to prompt timely actions.
Usage Tips:
Interpret Signals: Trend direction through buy/sell signals and overbought/oversold trend,- reversal / breakout line conditions for potential trading opportunities.
Session Awareness: Take into account the trading sessions (Tokyo, London, New York) to move along with the market dynamics during different times of the day.
Confirmation: Use additional technical analysis tools to confirm signals before executing trades. For example the Williams Percetange Range indicator.
Risk Management: Trade with proper risk management strategies to avoid potential losses.
HappyTrading
Pipsfordays
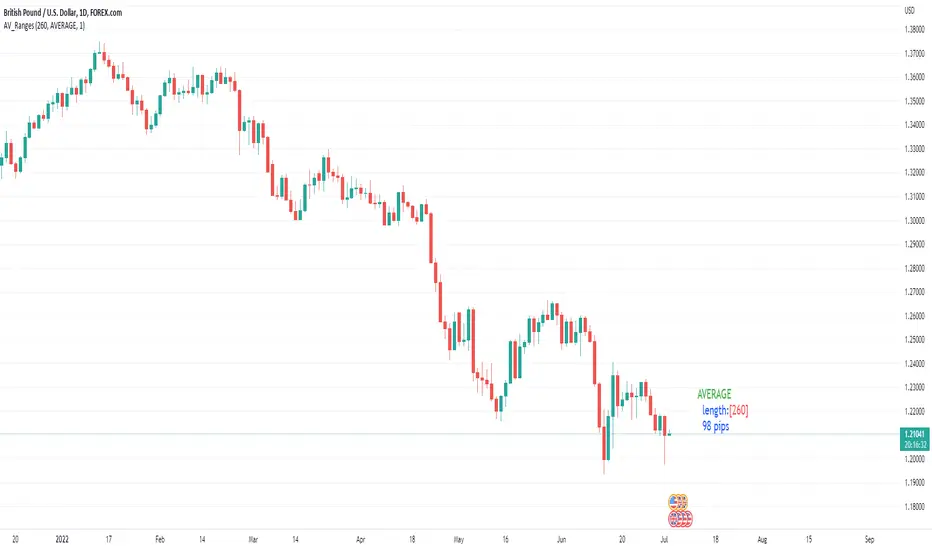
Average, Median, Mode, Biggest: Pip Range Measures & LabelsApply various simple statistical measures to series of full candle ranges over user input length (in bars).
Choose between AVERAGE, MEDIAN, MODE, BIGGEST.
All calculations derive from the high-low range of a candle.
Default length = 260, the number of daily candles in a year.
MODE is calculated from pip ranges rounded to reasonable increments (to nearest 10pips foreign currencies; to nearest 100 pips for DXY ; nearest $10 for other assets). Best only use MODE for the major FX pairs encoded, and on Daily timeframe .
User input 'unit multiplier' only applies when asset is NOT a major Forex pair (unit and multiplier is auto applied for for major FX pairs).
© twingall
Volatility in PipsThis indicator shows volatility in Pips as text in order to analyze how much price moves in different timeframes.
-Today’s pips variation
-Yesterday’s pips variation
-Past N day’s average pips variation (N = user input)
e.g. If today is Oct15 and you select 2, then average pips variation is average of yesterday(Oct14) and 2days ago(Oct13)'s pips variation.
-This week’s pips variation
-Last week’s pips variation
-This month’s pips variation
-Last month’s pips variation
Assets in scope is currently Forex, Gold, Silver and Cruide Oil.
Enjoy!
——————————————
ボラティリティをPips数でメインチャートにテキスト表示するインジケーターです。
監視対象通貨のボラティリティ分析用にお使いください。
表示できる情報
-本日Pips変動
-前日Pips変動
-過去N日間平均Pips変動(Nはユーザ設定)
例: 本日が10月14日の時に2を選択すると、10月13日(昨日)と10月12日(一昨日)の二日間の平均Pips変動を計算します。
-今週Pips変動
-先週Pips変動
-今月Pips変動
-先月Pips変動
対象の商品はFX、ゴールド、シルバー、原油です。

Pips Volatility ComparisonJapanese below / 日本語説明は下記
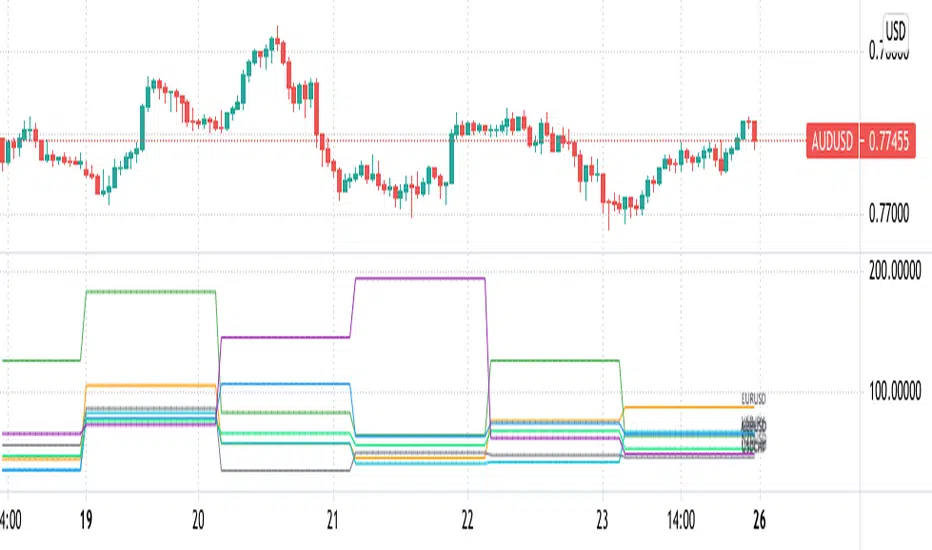
This indicator shows daily volatility in pips for multiple currency pairs so as to compare and identify most volatile pairs of the day.
Some traders would prefer to change pairs to trade depending on volatility while some traders would refrain from trading if overall market volatility is less or their favorite pairs are less volatile compared to previous days. That’s when this indicator would help.
Currency pairs can be selected from 25 pairs from US dollar cross, Yen cross, Euro cross, GBP cross and AUD cross. You can select what to display depending on your needs.
Pips volatility is calculated using high and low of the day and being updated as high/low updated.
Example :
The following chart shows EURUSD moved around 80 pips on Apr23, 2021 and is the most volatile pairs of the day among major US dollar crosses.
----------------------
複数通貨ペアのボラティリティをPipsで比較することのできるインジケーターです。
トレーダーの中にはボラティリティによって日毎にトレードする通貨ペアを変えたり、マーケット全体のボラティリティが低下していればトレードを控えたりする方もいると思います。また、お気に入りの通貨ペアのボラティリティが過去数日と比べて低い場合はトレードしないという判断もありうるでしょう。そういった判断に役立つかもしれません。
通貨ペアはドルストレート、クロス円、ユーロクロス、ポンドクロス、豪ドルクロスの25通貨ペアから必要なものを複数選択することが可能です。
Pipsは当日の高値・安値を使って計算し、日中の変動に合わせて随時更新されます。
例:
以下のチャートではEURUSDが2021年4月23日に約80pipsの変動があったことを示しています。
これは他の主要ドルストレートペアと比べ最も大きい値動きであることがわかります。