MyLibraryLibrary "MyLibrary"
TODO: add library description here
init(value)
Parameters:
value
set(source, value)
Parameters:
source
value
get(source)
Parameters:
source
Indikatoren und Strategien
Motion▮ FEATURES
Now as library version :)
String-based transition-effects
Performance optimization. Reduced memory consumption up to >90% by kicking the output to the "stdout".
Use marquee- or loader-effect on any possible string location.
Example: UI Price-Ticker
----------------------------------------------------------------------------
Library "Motion"
_getStringMono(_len, _str, _sep)
Parameters:
_len
_str
_sep
marquee(this, _extern, _ws, _subLen, _subStart)
Parameters:
this
_extern
_ws
_subLen
_subStart
transition(this, _subLen, _subStart)
Parameters:
this
_subLen
_subStart
hold(this)
Parameters:
this
keyframe
keyframe A keyframe object.
Fields:
seq
intv
step
length
update_no
frame_no
ltr
hold

Replica of TradingView's Backtesting Engine with ArraysHello everyone,
Here is a perfectly replicated TradingView backtesting engine condensed into a single library function calculated with arrays. It includes TradingView's calculations for Net profit, Total Trades, Percent of Trades Profitable, Profit Factor, Max Drawdown (absolute and percent), and Average Trade (absolute and percent). Here's how TradingView defines each aspect of its backtesting system:
Net Profit: The overall profit or loss achieved.
Total Trades: The total number of closed trades, winning and losing.
Percent Profitable: The percentage of winning trades, the number of winning trades divided by the total number of closed trades.
Profit Factor: The amount of money the strategy made for every unit of money it lost, gross profits divided by gross losses.
Max Drawdown: The greatest loss drawdown, i.e., the greatest possible loss the strategy had compared to its highest profits.
Average Trade: The sum of money gained or lost by the average trade, Net Profit divided by the overall number of closed trades.
Here's how each variable is defined in the library function:
_backtest(bool _enter, bool _exit, float _startQty, float _tradeQty)
bool _enter: When the strategy should enter a trade (entry condition)
bool _exit: When the strategy should exit a trade (exit condition)
float _startQty: The starting capital in the account (for BTCUSD, it is the amount of USD the account starts with)
float _tradeQty: The amount of capital traded (if set to 1000 on BTCUSD, it will trade 1000 USD on each trade)
Currently, this library only works with long strategies, and I've included a commented out section under DEMO STRATEGY where you can replicate my results with TradingView's backtesting engine. There's tons I could do with this beyond what is shown, but this was a project I worked on back in June of 2022 before getting burned out. Feel free to comment with any suggestions or bugs, and I'll try to add or fix them all soon. Here's my list of thing to add to the library currently (may not all be added):
Add commission calculations.
Add support for shorting
Add a graph that resembles TradingView's overview graph.
Clean and optimize code.
Clean up in a way that makes it easy to add other TradingView calculations (such as Sharpe and Sortino ratio).
Separate all variables, so they become accessible outside of calculations (such as gross profit, gross loss, number of winning trades, number of losing trades, etc.).
Thanks for reading,
OztheWoz

Library_SmoothersLibrary "Library_Smoothers"
CorrectedMA(Src, Len)
CorrectedMA The strengths of the corrected Average (CA) is that the current value of the time series must exceed a the current volatility-dependent threshold, so that the filter increases or falls, avoiding false signals when the trend is in a weak phase.
Parameters:
Src
Len
Returns: The Corrected source.
EHMA(src, len)
EMA Exponential Moving Average.
Parameters:
src : Source to act upon
len
Returns: EMA of source
FRAMA(src, len, FC, SC)
FRAMA Fractal Adaptive Moving Average
Parameters:
src : Source to act upon
len : Length of moving average
FC : Fast moving average
SC : Slow moving average
Returns: FRAMA of source
Jurik(src, length, phase, power)
Jurik A low lag filter
Parameters:
src : Source
length : Length for smoothing
phase : Phase range is ±100
power : Mathematical power to use. Doesn't need to be whole numbers
Returns: Jurik of source
SMMA(src, len)
SMMA Smoothed moving average. Think of the SMMA as a hybrid of its better-known siblings — the simple moving average (SMA) and the exponential moving average (EMA).
Parameters:
src : Source
len
Returns: SMMA of source
SuperSmoother(src, len)
SuperSmoother
Parameters:
src : Source to smooth
len
Returns: SuperSmoother of the source
TMA(src, len)
TMA Triangular Moving Average
Parameters:
src : Source
len
Returns: TMA of source
TSF(src, len)
TSF Time Series Forecast. Uses linear regression.
Parameters:
src : Source
len
Returns: TSF of source
VIDYA(src, len)
VIDYA Chande's Variable Index Dynamic Average. See www.fxcorporate.com
Parameters:
src : Source
len
Returns: VIDYA of source
VAWMA(src, len, startingWeight, volumeDefault)
VAWMA = VWMA and WMA combined. Simply put, this attempts to determine the average price per share over time weighted heavier for recent values. Uses a triangular algorithm to taper off values in the past (same as WMA does).
Parameters:
src : Source
len : Length
startingWeight
volumeDefault : The default value to use when a chart has no volume.
Returns: The VAWMA of the source.
WWMA(src, len)
WWMA Welles Wilder Moving Average
Parameters:
src : Source
len
Returns: The WWMA of the source
ZLEMA(src, len)
ZLEMA Zero Lag Expotential Moving Average
Parameters:
src : Source
len
Returns: The ZLEMA of the source
SmootherType(mode, src, len, fastMA, slowMA, offset, phase, power, startingWeight, volumeDefault, Corrected)
Performs the specified moving average
Parameters:
mode : Name of moving average
src : the source to apply the MA type
len
fastMA : FRAMA fast moving average
slowMA : FRAMA slow moving average
offset : Linear regression offset
phase : Jurik phase
power : Jurik power
startingWeight : VAWMA starting weight
volumeDefault : VAWMA default volume
Corrected
Returns: The MA smoothed source

HendrixLIBRARY - utilsLibrary "HendrixLIBRARY"
getVolumeData()
getLTF(customTimeframe, ltf)
Parameters:
customTimeframe
ltf
sumArray(a)
Parameters:
a
arrs2vals(upVolumeArray, downVolumeArray, volArr)
Parameters:
upVolumeArray
downVolumeArray
volArr
getVolumesFromUpDownArrays(upVolumeArray, downVolumeArray)
Parameters:
upVolumeArray
downVolumeArray
getDeltaFromVolumes(upVolume, downVolume)
Parameters:
upVolume
downVolume
getDeltaFromUpDownArrays(upVolumeArray, downVolumeArray)
Parameters:
upVolumeArray
downVolumeArray
getUpColor()
getDownColor()
getBlackColor()
getColors()
printTableTR(txt)
Parameters:
txt
printTableBR(txt)
Parameters:
txt
printTableMR(txt)
Parameters:
txt
print(txt, lbl)
Parameters:
txt
lbl
printSyminfo(sym)
Parameters:
sym
Profit EstimateLibrary "profitestimate"
Simple profit Estimatr. Engages when Position != 0
and holds until posittion is na/0...
if position changes sizes, it will update automatically and adjust.
it has an input for comission to estmate exit fees
update_avgprice(_sizewas, _delta, _pricewas, _newprice)
Get a new Average position Price
Parameters:
_sizewas : (float) the position prior
_delta : (float) the order amount
_pricewas : (float) the prior price
_newprice : (float) the price of order
Returns: New Avg Price
amount(_position, _close, _commission, _leverage, _fullqty)
Position Net Profit Net Commission, automatic on/off if position != 0
Parameters:
_position : (float) position size (total or margin size)
_close
_commission : (float) % where (0.1 = 0.1%)
_leverage : (float) optional if leveraged, default 1x
_fullqty : (bool) if position entered is tottal trade size default is margin qty (1/lev)
Returns: quote value of profit
percent(_position, _close, _commission, _leverage, _fullqty)
Position Net Profit, automatic on/off if position != 0
Parameters:
_position : (float) position size (total or margin size)
_close
_commission : (float) % where (0.1 = 0.1%)
_leverage : (float) optional if leveraged, default 1x
_fullqty : (bool) if position entered is tottal trade size, default is margin qty (1/lev)
Returns: percentage profit (1% = 1)
HeikinashiLibrary "Heikinashi"
This library calculates "Heikinashi".
calc(_o, _h, _l, _c, _my_close)
This function calculates "Heikinashi".
Parameters:
_o : open
_h : high
_l : low
_c : close
_my_close : Specify if you want to force only the closing price to a real value.
Returns: TODO: add what function returns

String Extra FunctionsLibrary "string_extras"
Additional String shortcuts, unshift and pop return the string ~without~ the first or last, so in use will still require to extract first or last character prior to overwriting a string with the output.
can be imported "as str" to work side by side with regular pine
last(_string)
last char of a string
Parameters:
_string
Returns: last char of a string
shift(_string)
string without first char
Parameters:
_string
Returns: string without first char
pop(_string)
string without last char
Parameters:
_string
Returns: string without last char
get(_string, _position)
get specific char of a string
Parameters:
_string
_position
Returns: string _string
push(_string, _char)
push to end of a string
Parameters:
_string
_char
Returns: string _string
unshift(_string, _char)
unshift char to prepend string
Parameters:
_string
_char
Returns: string _string

HSupertrendLibrary "HSupertrend"
Supertrend implementation based on harmonic patterns
hsupertrend(zProperties, pProperties, errorPercent, showPatterns, patternColor)
derives supertrend based on harmonic patterns
Parameters:
zProperties : ZigzagProperties containing Zigzag length and source array
pProperties : PatternProperties used for calculation
errorPercent : Error threshold for scanning patterns
showPatterns : Draw identified patterns structure on chart
patternColor : Color of the pattern lines to be drawn
Returns:
ZigzagProperties
ZigzagProperties contains values required for zigzag calculation
Fields:
length : Zigzag length
source : Array containing custom OHLC. If not set, array.from(high, low) is used
PatternProperties
PatternProperties are essential pattern parameters used for calculation of bullish and bearish zones
Fields:
base : Base for calculating entry and stop of pattern. Can be CD, minmax or correction. Default is CD
entryPercent : Distance from D in terms of percent of Base in the direction of pattern
stopPercent : Distance from D in terms of percent of Base in the opposite direction of pattern
useClosePrices : When set uses close price for calculation of supertrend breakout

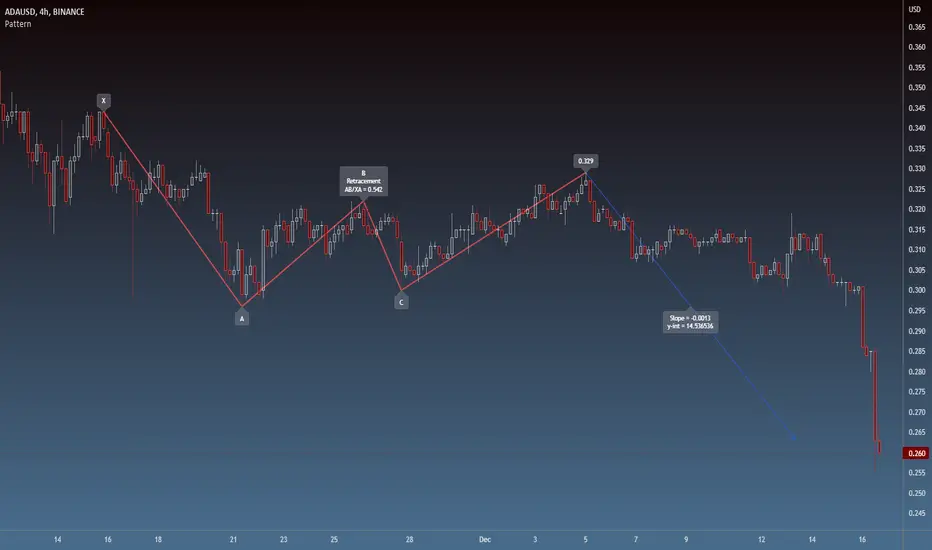
PatternLibrary "Pattern"
Pattern object definitions and functions. Easily draw and keep track of patterns, legs, and points.
Supported pattern types (as of Version 1):
Type Leg validation # legs
"xabcd" Direction 3 or 4 (point D not required)
"zigzag" Direction >= 2
"free" None >= 2
erase_label(this)
Delete the point label
Parameters:
this : Point
Returns: Void
draw_label(this, position, clr, transp, txt_clr, txt, tooltip, size)
Draw the point label
Parameters:
this : Point
position
clr
transp
txt_clr
txt
tooltip
size
Returns: line
leg_init(a, b, prev, next, line)
Initialize a pattern leg
Parameters:
a : Point A (required)
b : Point B (required)
prev : Previous leg
next : Next leg
line : Line
Returns: New instance of leg object
erase(this)
Delete the pattern leg
Parameters:
this : Leg
Returns: Void
erase(this)
Parameters:
this
draw(this, clr, style, transp, width)
Draw the pattern leg
Parameters:
this : Leg
clr : Color
style : Style ("solid", "dotted", "dashed", "arrowleft", "arrowright")
transp : Transparency
width : Width
Returns: line
draw(this, clr, style, transp, width)
Parameters:
this
clr
style
transp
width
leg_getLineTerms(this)
Get the slope and y-intercept of a leg
Parameters:
this : Leg
Returns:
leg_getPrice(this, index)
Get the price (Y) at a given bar index (X) within the leg
Parameters:
this : Leg
index : Bar index
Returns: Price (float)
pattern_init(legs, tp, name, subType, pid)
Initialize a pattern object from a given set of legs
Parameters:
legs : Array of pattern legs (required)
tp : Pattern type ("zigzag", "xabcd", or "free". dft = "free")
name : Pattern name
subType : Pattern subtype
pid : Pattern Identifier string
Returns: New instance of pattern object, if one was successfully created
pattern_init(points, tp, name, subType, pid)
Initialize a pattern object from a given set of points
Parameters:
points
tp : Pattern type ("zigzag", "xabcd", or "free". dft = "free")
name : Pattern name
subType : Pattern subtype
pid : Pattern Identifier string
Returns: New instance of pattern object, if one was successfully created
point
A point on the chart (x,y)
Fields:
x : Bar index (x coordinate)
y
label
leg
A pattern leg (point A to point B)
Fields:
a : Point A
b
deltaX
deltaY
prev
next
retrace
line
pattern
A pattern (set of at least 2 connected legs)
Fields:
legs
type
subType
name
pid
ChasinAlts_LibraryLibrary "ChasinAlts_Library"
rci(_BCgtg, _Tgtg, _close, _smaLen, _bar_index)
Parameters:
_BCgtg
_Tgtg
_close
_smaLen
_bar_index
printedBC(_time, _minPerc, _Tgtg, _lkbk)
Parameters:
_time
_minPerc
_Tgtg
_lkbk
form123(_ppLen, _BCgtg, _Tgtg, _high, _low, _close, _bar_index)
Parameters:
_ppLen
_BCgtg
_Tgtg
_high
_low
_close
_bar_index
obosCnt(_BCgtg, _Tgtg, _rci, _obosMin, _obosMax, _thresh)
Parameters:
_BCgtg
_Tgtg
_rci
_obosMin
_obosMax
_thresh
div(_thresh, _HLestLen, _Tgtg, _BCgtg, _rci, _time, _price, _LSL, _SSL, _LTP, _STP, _colorid, _long, _short)
Parameters:
_thresh
_HLestLen
_Tgtg
_BCgtg
_rci
_time
_price
_LSL
_SSL
_LTP
_STP
_colorid
_long
_short
tradeSim(_SL, _TP, _BCgtg, _Tgtg, _ppLen, _high, _low, _close, _bar_index, _time, _bull_rev, _bear_rev, _bull_obosCnt_gtg, _bear_obosCnt_gtg)
Parameters:
_SL
_TP
_BCgtg
_Tgtg
_ppLen
_high
_low
_close
_bar_index
_time
_bull_rev
_bear_rev
_bull_obosCnt_gtg
_bear_obosCnt_gtg
TrailingStopsLibrary "TrailingStops"
This library contains functions to output trailing stop lines.
f_marketStructureStop(_restartMode, _flipMode, _restartLowIn, _restartHighIn)
Parameters:
_restartMode - Defines how the stop lines persist. Allowed values are:
"Always On" - The stop lines are always present and they just reset when they're crossed.
"Flip" - The stop lines flip when they're crossed.
"Manual" - The stop lines turn off when they're crossed, and turn back on again when _restartLowIn or _restartHighIn are passed into the function as true.
_flipMode - Defines whether the stop lines are broken by wicks or closes. Allowed values are "Wick", and "Close".
_restartLowIn - If _restartMode is "Manual", passing this parameter as true restarts the Low stop line.
_restartHighIn - If _restartMode is "Manual", passing this parameter as true restarts the High stop line.
@returns - floats for the Low and High stop line.

SignalBuilderSignalBuilder
Utility for building a collection of signal values. Provides a default view for displaying signals.
Simplified API for aggregating signal values.
Flexible for use with indicators and strategies.
See the demo section for an example.

MarketStructureLibrary "MarketStructure"
This library contains functions for identifying Lows and Highs in a rule-based way, and deriving useful information from them.
f_simpleLowHigh()
This function finds Local Lows and Highs, but NOT in order. A Local High is any candle that has its Low taken out on close by a subsequent candle (and vice-versa for Local Lows).
The Local High does NOT have to be the candle with the highest High out of recent candles. It does NOT have to be a Williams High. It is not necessarily a swing high or a reversal or anything else.
It doesn't have to be "the" high, so don't be confused.
By the rules, Local Lows and Highs must alternate. In this function they do not, so I'm calling them Simple Lows and Highs.
Simple Highs and Lows, by the above definition, can be useful for entries and stops. Because I intend to use them for stops, I want them all, not just the ones that alternate in strict order.
@param - there are no parameters. The function uses the chart OHLC.
@returns boolean values for whether this bar confirms a Simple Low/High, and ints for the bar_index of that Low/High.
f_localLowHigh()
This function finds Local Lows and Highs, in order. A Local High is any candle that has its Low taken out on close by a subsequent candle (and vice-versa for Local Lows).
The Local High does NOT have to be the candle with the highest High out of recent candles. It does NOT have to be a Williams High. It is not necessarily a swing high or a reversal or anything else.
By the rules, Local Lows and Highs must alternate, and in this function they do.
@param - there are no parameters. The function uses the chart OHLC.
@returns boolean values for whether this bar confirms a Local Low/High, and ints for the bar_index of that Low/High.
f_enhancedSimpleLowHigh()
This function finds Local Lows and Highs, but NOT in order. A Local High is any candle that has its Low taken out on close by a subsequent candle (and vice-versa for Local Lows).
The Local High does NOT have to be the candle with the highest High out of recent candles. It does NOT have to be a Williams High. It is not necessarily a swing high or a reversal or anything else.
By the rules, Local Lows and Highs must alternate. In this function they do not, so I'm calling them Simple Lows and Highs.
Simple Highs and Lows, by the above definition, can be useful for entries and stops. Because I intend to use them for trailing stops, I want them all, not just the ones that alternate in strict order.
The difference between this function and f_simpleLowHigh() is that it also tracks the lowest/highest recent level. This level can be useful for trailing stops.
In effect, these are like more "normal" highs and lows that you would pick by eye, but confirmed faster in many cases than by waiting for the low/high of that particular candle to be taken out on close,
because they are instead confirmed by ANY subsequent candle having its low/high exceeded. Hence, I call these Enhanced Simple Lows/Highs.
The levels are taken from the extreme highs/lows, but the bar indexes are given for the candles that were actually used to confirm the Low/High.
This is by design, because it might be misleading to label the extreme, since we didn't use that candle to confirm the Low/High..
@param - there are no parameters. The function uses the chart OHLC.
@returns - boolean values for whether this bar confirms an Enhanced Simple Low/High
ints for the bar_index of that Low/High
floats for the values of the recent high/low levels
floats for the trailing high/low levels (for debug/post-processing)
bools for market structure bias
f_trueLowHigh()
This function finds True Lows and Highs.
A True High is the candle with the highest recent high, which then has its low taken out on close by a subsequent candle (and vice-versa for True Lows).
The difference between this and an Enhanced High is that confirmation requires not just any Simple High, but confirmation of the very candle that has the highest high.
Because of this, confirmation is often later, and multiple Simple Highs and Lows can develop within ranges formed by a single big candle without any of them being confirmed. This is by design.
A True High looks like the intuitive "real high" when you look at the chart. True Lows and Highs must alternate.
@param - there are no parameters. The function uses the chart OHLC.
@returns - boolean values for whether this bar confirms an Enhanced Simple Low/High
ints for the bar_index of that Low/High
floats for the values of the recent high/low levels
floats for the trailing high/low levels (for debug/post-processing)
bools for market structure bias

TechnicalRating█ OVERVIEW
This library is a Pine Script™ programmer’s tool for incorporating TradingView's well-known technical ratings within their scripts. The ratings produced by this library are the same as those from the speedometers in the technical analysis summary and the "Rating" indicator in the Screener , which use the aggregate biases of 26 technical indicators to calculate their results.
█ CONCEPTS
Ensemble analysis
Ensemble analysis uses multiple weaker models to produce a potentially stronger one. A common form of ensemble analysis in technical analysis is the usage of aggregate indicators together in hopes of gaining further market insight and reinforcing trading decisions.
Technical ratings
Technical ratings provide a simplified way to analyze financial markets by combining signals from an ensemble of indicators into a singular value, allowing traders to assess market sentiment more quickly and conveniently than analyzing each constituent separately. By consolidating the signals from multiple indicators into a single rating, traders can more intuitively and easily interpret the "technical health" of the market.
Calculating the rating value
Using a variety of built-in TA functions and functions from our ta library, this script calculates technical ratings for moving averages, oscillators, and their overall result within the `calcRatingAll()` function.
The function uses the script's `calcRatingMA()` function to calculate the moving average technical rating from an ensemble of 15 moving averages and filters:
• Six Simple Moving Averages and six Exponential Moving Averages with periods of 10, 20, 30, 50, 100, and 200
• A Hull Moving Average with a period of 9
• A Volume-Weighted Moving Average with a period of 20
• An Ichimoku Cloud with a conversion line length of 9, base length of 26, and leading span B length of 52
The function uses the script's `calcRating()` function to calculate the oscillator technical rating from an ensemble of 11 oscillators:
• RSI with a period of 14
• Stochastic with a %K period of 14, a smoothing period of 3, and a %D period of 3
• CCI with a period of 20
• ADX with a DI length of 14 and an ADX smoothing period of 14
• Awesome Oscillator
• Momentum with a period of 10
• MACD with fast, slow, and signal periods of 12, 26, and 9
• Stochastic RSI with an RSI period of 14, a %K period of 14, a smoothing period of 3, and a %D period of 3
• Williams %R with a period of 14
• Bull Bear Power with a period of 50
• Ultimate Oscillator with fast, middle, and slow lengths of 7, 14, and 28
Each indicator is assigned a value of +1, 0, or -1, representing a bullish, neutral, or bearish rating. The moving average rating is the mean of all ratings that use the `calcRatingMA()` function, and the oscillator rating is the mean of all ratings that use the `calcRating()` function. The overall rating is the mean of the moving average and oscillator ratings, which ranges between +1 and -1. This overall rating, along with the separate MA and oscillator ratings, can be used to gain insight into the technical strength of the market. For a more detailed breakdown of the signals and conditions used to calculate the indicators' ratings, consult our Help Center explanation.
Determining rating status
The `ratingStatus()` function produces a string representing the status of a series of ratings. The `strongBound` and `weakBound` parameters, with respective default values of 0.5 and 0.1, define the bounds for "strong" and "weak" ratings.
The rating status is determined as follows:
Rating Value Rating Status
< -strongBound Strong Sell
< -weakBound Sell
-weakBound to weakBound Neutral
> weakBound Buy
> strongBound Strong Buy
By customizing the `strongBound` and `weakBound` values, traders can tailor the `ratingStatus()` function to fit their trading style or strategy, leading to a more personalized approach to evaluating ratings.
Look first. Then leap.
█ FUNCTIONS
This library contains the following functions:
calcRatingAll()
Calculates 3 ratings (ratings total, MA ratings, indicator ratings) using the aggregate biases of 26 different technical indicators.
Returns: A 3-element tuple: ( [(float) ratingTotal, (float) ratingOther, (float) ratingMA ].
countRising(plot)
Calculates the number of times the values in the given series increase in value up to a maximum count of 5.
Parameters:
plot : (series float) The series of values to check for rising values.
Returns: (int) The number of times the values in the series increased in value.
ratingStatus(ratingValue, strongBound, weakBound)
Determines the rating status of a given series based on its values and defined bounds.
Parameters:
ratingValue : (series float) The series of values to determine the rating status for.
strongBound : (series float) The upper bound for a "strong" rating.
weakBound : (series float) The upper bound for a "weak" rating.
Returns: (string) The rating status of the given series ("Strong Buy", "Buy", "Neutral", "Sell", or "Strong Sell").

TurntLibraryLibrary "TurntLibrary"
Collection of functions created for simplification/easy referencing. Includes variations of moving averages, length value oscillators, and a few other simple functions based upon HH/LL values.
ma(source, length, type)
Apply a moving average to a float value
Parameters:
source : Value to be used
length : Number of bars to include in calculation
type : Moving average type to use ("SMA","EMA","RMA","WMA","VWAP","SWMA","LRC")
Returns: Smoothed value of initial float value
curve(src, len, lb1, lb2)
Exaggerates curves of a float value designed for use as an exit signal.
Parameters:
src : Initial value to curve
len : Number of bars to include in calculation
lb1 : (Default = 1) First lookback length
lb2 : (Default = 2) Second lookback length
Returns: Curved Average
fragma(src, len, space, str)
Average of a moving average and the previous value of the moving average
Parameters:
src : Initial float value to use
len : Number of bars to include in calculation
space : Lookback integer for second half of average
str : Moving average type to use ("SMA","EMA","RMA","WMA","VWAP","SWMA","LRC")
Returns: Fragmented Average
maxmin(x, y)
Difference of 2 float values, subtracting the lowest from the highest
Parameters:
x : Value 1
y : Value 2
Returns: The +Difference between 2 float values
oscLen(val, type)
Variable Length using a oscillator value and a corresponding slope shape ("Incline",Decline","Peak","Trough")
Parameters:
val : Oscillator Value to use
type : Slope of length curve ("Incline",Decline","Peak","Trough")
Returns: Variable Length Integer
hlAverage(val, smooth, max, min, type, include)
Average of HH,LL with variable lengths based on the slope shape ("Incline","Decline","Trough") value relative to highest and lowest
Parameters:
val : Source Value to use
smooth
max
min
type
include : Add "val" to the averaging process, instead of more weight to highest or lowest value
Returns: Variable Length Average of Highest Lowest "val"
pct(val)
Convert a positive float / price to a percentage of it's highest value on record
Parameters:
val : Value To convert to a percentage of it's highest value ever
Returns: Percentage
hlrange(x, len)
Difference between Highest High and Lowest Low of float value
Parameters:
x : Value to use in calculation
len : Number of bars to include in calculation
Returns: Difference
midpoint(x, len, smooth)
The average value of the float's Highest High and Lowest Low in a number of bars
Parameters:
x : Value to use in calculation
len
smooth : (Default=na) Optional smoothing type to use ("SMA","EMA","RMA","WMA","VWAP","SWMA","LRC")
Returns: Midpoint
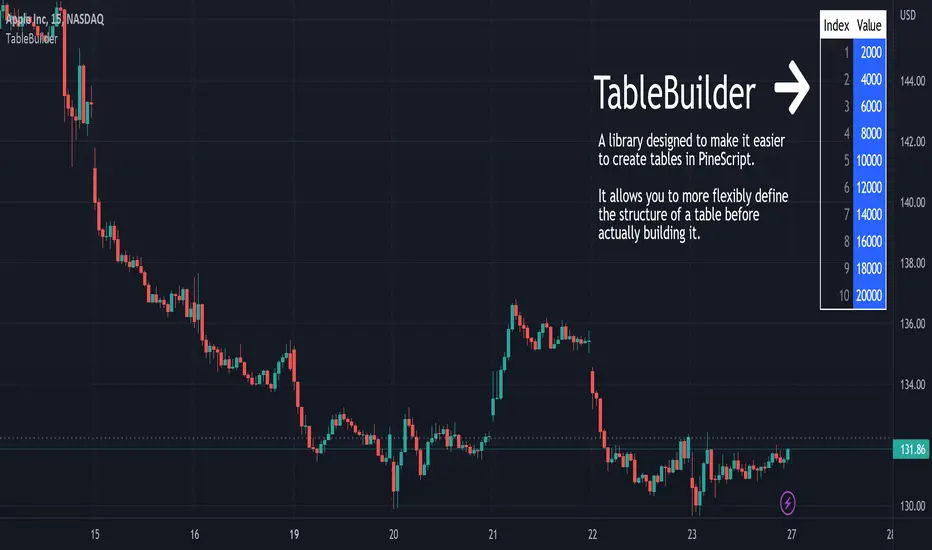
TableBuilderTableBuilder is a library designed to make it easier to create tables in PineScript.
It allows you to more flexibly define the structure of a table before actually building it.
Features:
Style inheritance: styles are inherited from Table, to Column, to Row, and then Cell.
Columns are useful for propagating/reusing style but they are not required.
Add rows with different numbers of cells. The resultant number of columns in the table will be determined by the max number of cells vs the number of defined columns.
Auto text color: Instead of having to set the font color for every cell, the color is automatically determined by the luminosity of the background color.
See the 'Demo' section of the code for an example.
ColorUtility for working with colors.
Get the luminosity of a color and determine the optimal (black or white) foreground color.

ISODateTimeLibrary "ISODateTime"
getDateParts(dateStr)
Get year, month, day from date string.
Parameters:
dateStr : : ISO 8601 format, i.e. "2022-05-04T14:00:00.001000-04:00" or "2022-05-04T14:00:00Z"
Returns: array of int
getTimeParts(dateStr)
Get hour, minute, seconds from date string.
Parameters:
dateStr : : ISO 8601 format, i.e. "2022-05-04T14:00:00.001000-04:00" or "2022-05-04T14:00:00Z"
Returns: array of int
getUTCTimezone(dateStr)
Get UTC timezone.
Parameters:
dateStr : : ISO 8601 format, i.e. "2022-05-04T14:00:00.001000-04:00" or "2022-05-04T14:00:00Z"
Returns: string UTC timezone
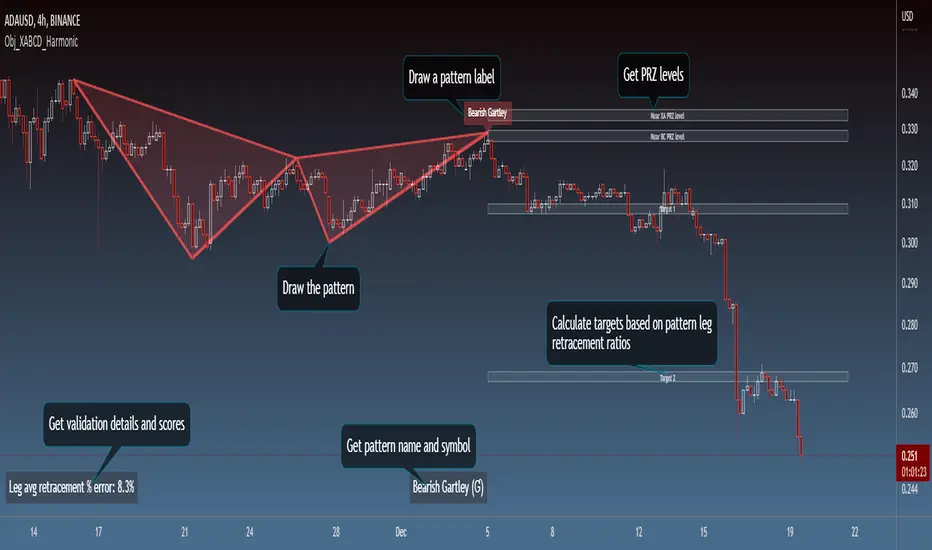
Obj_XABCD_HarmonicLibrary "Obj_XABCD_Harmonic"
Harmonic XABCD Pattern object and associated methods. Easily validate, draw, and get information about harmonic patterns. See example code at the end of the script for details.
init_params(pct_error, pct_asym, types, w_e, w_p, w_d)
Create a harmonic parameters object (used by xabcd_harmonic object for pattern validation and scoring).
Parameters:
pct_error : Allowed % error of leg retracement ratio versus the defined harmonic ratio
pct_asym : Allowed leg length/period asymmetry % (a leg is considered invalid if it is this % longer or shorter than the average length of the other legs)
types : Array of pattern types to validate (1=Gartley, 2=Bat, 3=Butterfly, 4=Crab, 5=Shark, 6=Cypher)
w_e : Weight of ratio % error (used in score calculation, dft = 1)
w_p : Weight of PRZ confluence (used in score calculation, dft = 1)
w_d : Weight of Point D / PRZ confluence (used in score calculation, dft = 1)
Returns: harmonic_params object instance. It is recommended to store and reuse this object for multiple xabcd_harmonic objects rather than creating new params objects unnecessarily.
init(xX, xY, aX, aY, bX, bY, cX, cY, dX, dY, params, tp, p)
Initialize an xabcd_harmonic object instance.
If the pattern is valid, an xabcd_harmonic object instance is returned. If you want to specify your
own validation and scoring parameters, you can do so by passing a harmonic_params object (params).
Or, if you prefer to do your own validation, you can explicitly pass the harmonic pattern type (tp)
and validation will be skipped. You can also pass in an existing xabcd_harmonic instance if you wish
to re-initialize it (e.g. for re-validation and/or re-scoring).
Parameters:
xX : Point X bar index
xY : Point X price/level
aX : Point A bar index
aY : Point A price/level
bX : Point B bar index
bY : Point B price/level
cX : Point C bar index
cY : Point C price/level
dX : Point D bar index
dY : Point D price/level
params : harmonic_params used to validate and score the pattern. Validation will be skipped if a type (tp) is explicitly passed in.
tp : Pattern type
p : xabcd_harmonic object instance to initialize (optional, for re-validation/re-scoring)
Returns: xabcd_harmonic object instance if a valid harmonic, else na
get_name(p)
Get the pattern name
Parameters:
p : Instance of xabcd_harmonic object
Returns: Pattern name (string)
get_symbol(p)
Get the pattern symbol
Parameters:
p : Instance of xabcd_harmonic object
Returns: Pattern symbol (1 byte string)
get_pid(p)
Get the Pattern ID. Patterns of the same type with the same coordinates will have the same Pattern ID.
Parameters:
p : Instance of xabcd_harmonic object
Returns: Pattern ID (string)
set_target(p, target, target_lvl, calc_target)
Set value for a target. Use the calc_target parameter to automatically calculate the target for a specific harmonic ratio.
Parameters:
p : Instance of xabcd_harmonic object
target : Target (1 or 2)
target_lvl : Target price/level (required if calc_target is not specified)
calc_target : Target to auto calculate (required if target is not specified)
Options:
Returns: Target price/level (float)
erase_pattern(p)
Erase the pattern
Parameters:
p : Instance of xabcd_harmonic object
Returns: p
draw_pattern(p)
Draw the pattern
Parameters:
p : Instance of xabcd_harmonic object
Returns: Pattern lines
erase_label(p)
Erase the pattern label
Parameters:
p : Instance of xabcd_harmonic object
Returns: p
draw_label(p, txt, tooltip, clr, txt_clr)
Draw the pattern label. Default text is the pattern name.
Parameters:
p : Instance of xabcd_harmonic object
txt : Label text
tooltip : Tooltip text
clr : Label color
txt_clr : Text color
Returns: Label
harmonic_params
Validation and scoring parameters for a Harmonic Pattern object (xabcd_harmonic)
Fields:
pct_error : Allowed % error of leg retracement ratio versus the defined harmonic ratio
pct_asym
types
w_e
w_p
w_d
xabcd_harmonic
Harmonic Pattern object
Fields:
bull : Bullish pattern flag
tp
xX
xY
aX
aY
bX
bY
cX
cY
dX
dY
r_xb
re_xb
r_ac
re_ac
r_bd
re_bd
r_xd
re_xd
score
score_eAvg
score_prz
score_eD
prz_bN
prz_bF
prz_xN
prz_xF
t1Hit : Target 1 flag
t1
t2Hit
t2
sHit : Stop flag
stop : Stop level
entry : Entry level
eHit
eX
eY
pLines
pLabel
pid
params
Signal AnalyzerThis library contains functions that try to analyze trading signals performance.
Like the % of average returns after a long or short signal is provided or the number of times that signal was correct, in the inmediate 2 candles after the signal.

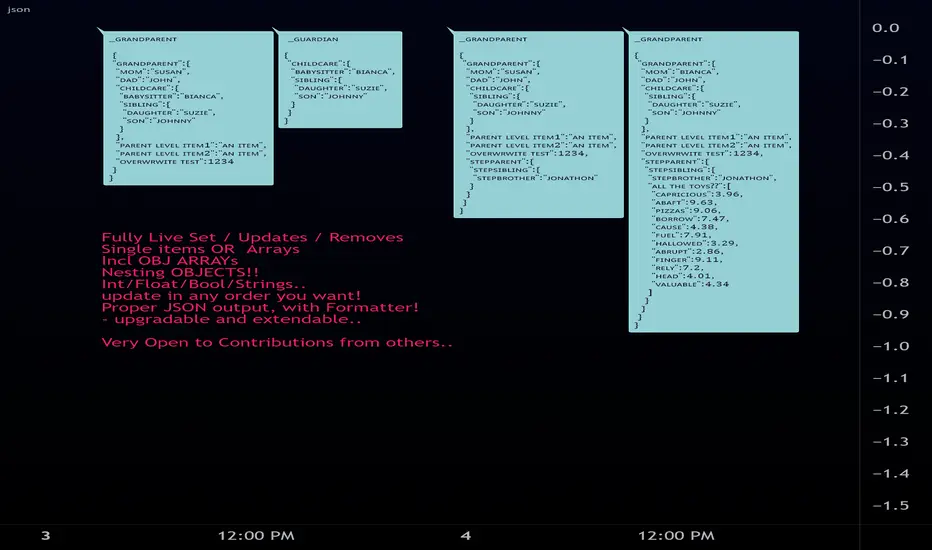
jsonLibrary "json"
JSON Easy Object Create/stringiffy
Functions to add/write JSON
new (name , kind) -> object
set (_item , _obj , _key ) -> key index for parent object's array
add (_obj , _key , _item ) -> key index for parent object's array
write (object , kind ) -> stringified object // (enter kind to cut off key )
============================================
obj
obj Object storage container/item
Fields:
key : (string ) item name
kind : (string ) item's type(for writing)
item : (string ) item (converted to string)
keys : (string ) keys of all sub-items and objects
items : (obj ) nested obj off individual subitems (for later...)
============================================
new(_name, _kind)
create multitype object
Parameters:
_name : (string) Name off object
_kind : (string) Preset Type (_OBJECT if a container item)
Returns: object container/item 2-in-1
============================================
add(_item, _obj, _key)
Set item to object obj item (same as set, prep for future Pine methods)
Parameters:
_item : ( int / float / bool / string )
_obj : (obj multi-type-item object)
_key : ( string )
set(_item, _obj, _key)
Set item to object obj item (same as add, prep for future Pine methods)
Parameters:
_item : ( int / float / bool / string )
_obj : (obj multi-type-item object)
_key : ( string )
addstore(_parent, _child)
Add a object as a subobject to storage (Future upgrade to write/edit)
Parameters:
_parent : to insert obj into
_child : to be inserted
setstore(_child, _parent)
Add a object as a subobject to storage (Future upgrade to write/edit)
Parameters:
_child : to be inserted
_parent : to insert obj into
add(_parent, _child)
Add a object as a string rendered item
Parameters:
_parent : to insert obj into
_child : to be inserted
set(_child, _parent)
Add a object as a string rendered item
Parameters:
_child : to be inserted
_parent : to insert obj into
============================================
write(_object, _key, _itemname)
Write object to string Object
Parameters:
_object : (obj)
_key : (array<(string/int)> )/(string)
_itemname : (string)
Returns: stringified flattened object.
clean_output(_str)
Clean JSON final output
Parameters:
_str : string json item
Returns: cleaned string
WelcomeUDT█ OVERVIEW
This is a simplest example of user-defined types (UDT) or objects , which simplify as alternative to hello world.
█ CREDITS
Tradingview
█ USAGE
These are the types used during initializations, commonly variables.
export type Settings
int bar
float price
string phrase
...
Example of library function to print out label.
export printLabel(Settings setup) =>
if setup.variable
var label lab = na
label.delete(lab)
lab := label.new(setup.bar, setup.price, setup.phrase, color = setup.bg)
else
label.new(setup.bar, setup.price, setup.phrase, color = setup.bg)
Usage of types
Settings setup = Settings.new(bar_index , priceInput, phraseInput, colorInput, variableInput)
Alternative way to write types
Settings setup = Settings.new(
bar = bar_index ,
price = priceInput,
phrase = phraseInput,
variable = variableInput)
Usage of types into custom function / library function.
printLabel(setup)
printLabel(Settings)
Print out label
Parameters:
Settings : types
Returns: Label object
Settings
Initialize type values
Fields:
bar : X position for label
price : Y position for label
phrase : Text for label
bg : Color for label
variable : Boolean for enable new line and delete line
