Moving Average Ribbon (10x, per-MA timeframe)A flexible moving‑average ribbon that plots up to 10 MAs, each with its own type, length, source, color, and independent timeframe selector for true multi‑timeframe analysis without repainting on higher‑timeframe pulls.
What it does
Plots ten moving averages with selectable types: SMA, EMA, SMMA (RMA), WMA, and VWMA.
Allows per‑line timeframe inputs (e.g., 5, 15, 60, 1D, 1W) so you can overlay higher‑ or equal‑timeframe MAs on the current chart.
Uses a non‑repainting request pattern for higher‑timeframe series to keep lines stable in realtime.
How to use
Leave a TF field blank to keep that MA on the chart’s timeframe; type a timeframe (like 15 or 1D) to fetch it from another timeframe.
Typical trend‑following setup: fast MAs (10–21) on chart TF, mid/slow MAs (34–200) from higher TFs for bias and dynamic support/resistance.
Color‑code faster vs slower lines and optionally hide lines you don’t need to reduce clutter.
Best practices
Prefer pulling equal or higher timeframes for stability; mixing lower TFs into a higher‑TF chart can create choppy visuals.
Combine with price action and volume/volatility tools (e.g., RSI, Bollinger Bands) for confirmation rather than standalone signals.
Showcase example charts in your publish post and explain default settings so users know how to interpret the ribbon.
Inputs
Show/Hide per MA, Type (SMA/EMA/SMMA/WMA/VWMA), Source, Length, Color, Timeframe.
Defaults cover common lengths (10/20/50/100/200 etc.) and can be customized to fit intraday or swing styles.
Limitations
This is an analysis overlay, not a signal generator; it doesn’t place trades or alerts by default.
Effectiveness depends on instrument liquidity and user configuration; avoid overfitting to one market or regime.
Attribution and etiquette
Provide a brief explanation of your calculation choices and note that MA formulas are standard; credit any borrowed concepts or snippets if used.
Indikatoren und Strategien

Dhanesh_CustomTrendlineLogicUsed framma in getting the trades.
You can also define the custom horizontal and an inclined trendline breaking of which can trigger the trade. Enjoy the script.
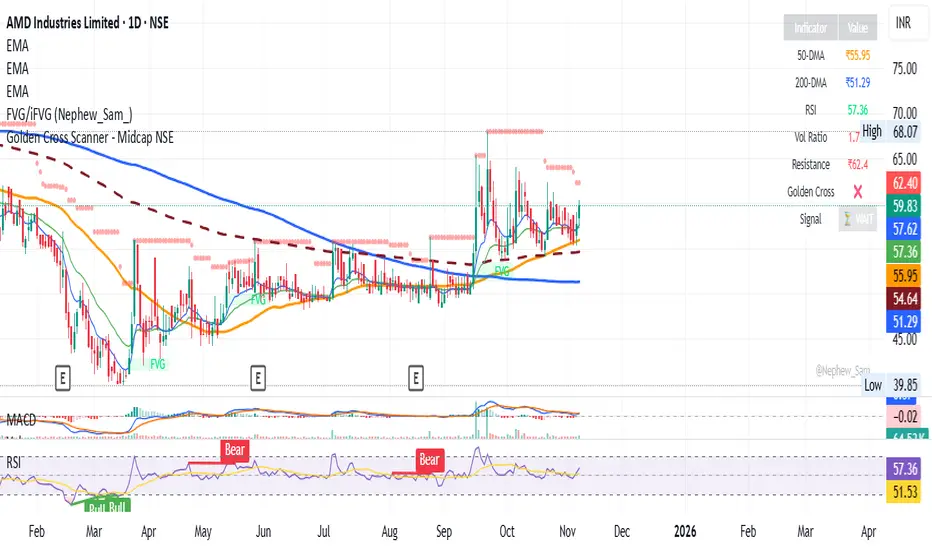
EPS Trendline (Fundamentals Insight by Mazhar Karimi)Overview
This indicator visualizes a company’s Earnings Per Share (EPS) data directly on the chart—pulled from TradingView’s fundamental database—and applies a dynamic linear regression trendline to highlight the long-term direction of earnings growth or decline.
It’s designed to help investors and quantitative traders quickly see how the company’s profitability (EPS) has evolved over time and whether it’s trending upward (growth), flat (stagnant), or downward (decline).
How it Works
Uses request.financial() to fetch EPS data (Diluted or Basic).
You can select whether to use TTM (Trailing Twelve Months), FQ (Fiscal Quarter), or FY (Fiscal Year) data.
The script fits a regression line (using ta.linreg) over a configurable window to visualize the underlying EPS trend.
Updates automatically when new financial data is released.
Inputs
EPS Period: Choose between FQ / FY / TTM
Use Diluted EPS: Toggle to compare Diluted vs. Basic EPS
Regression Window: Adjust how many bars are used to fit the trendline
Interpretation Tips
A rising trendline indicates earnings momentum and potential investor confidence.
A flat or declining trendline may warn of profitability slowdowns.
Combine with price action or valuation ratios (like P/E) for deeper analysis.
Works best on stocks or ETFs with fundamental data (not available for crypto or FX).
Suggestions / Use Cases
Pair with Price/Earnings ratio indicators to evaluate valuation vs. fundamentals.
Use in conjunction with earnings release events for context.
Ideal for long-term investors, swing traders, or fundamental quants tracking financial health trends.
Future Enhancements (Planned Ideas)
🔹 Option to display multiple regression lines (short-term and long-term)
🔹 Support for comparing multiple tickers’ EPS in the same pane
🔹 Integration with Net Income, Revenue, or Free Cash Flow trends
🔹 Add a “Rate of Change” signal for momentum-based EPS analysis

VWAP Diario + VWAP 08:00-12:00 (sin fantasmas, toggles) muestra el volumen. De la sesion nueva york y del dia

VWAP Diario + VWAP 08:00-12:00 (sin fantasmas) con colorDos vwap. Uno desde el principio del dia. y otro desde las 8 am

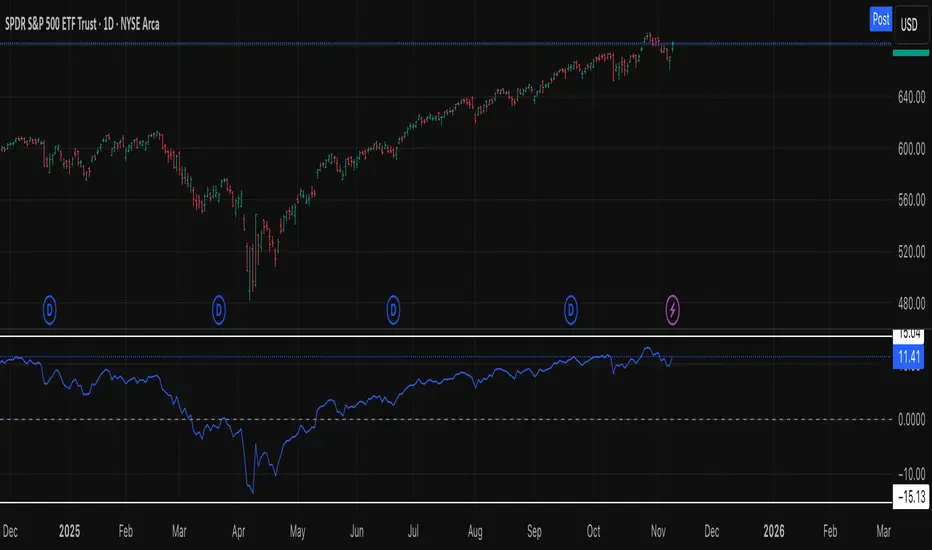
US Leverage Overlay — Margin Debt & Total Credit (YoY / Z-score)What this does
An overlay indicator that brings U.S. leverage proxies from FRED onto your main price chart (left axis). Choose between a proxy for investor margin debt or total credit market debt and view them as YoY %, Z-score of YoY, or an Indexed Level so they’re comparable with price without wrecking the scale.
Data sources (FRED symbols)
--- Margin (investor leverage proxy): FRED:BOGZ1FL663067003Q
Brokers & Dealers; Receivables Due from Customers ≈ margin loans (quarterly).
--- TotalCredit (economy-wide leverage): FRED:TCMDO
All sectors; Debt Securities & Loans; Liability (quarterly).
Note: These are quarterly series. The indicator samples monthly and holds values between official prints, so you’ll see step-like updates when new data drops.
Views (pick one in settings)
--- YoY % — 12-month rate of change. Above 0% = leverage expanding; below 0% = contracting.
--- Z-score (YoY) — Standardizes YoY vs. its recent history to flag unusual moves (regime shifts).
--- Indexed Level — 100 × (level / moving average), a compact “above/below trend” view.
How to read quickly
--- Rising YoY % > 0 → leverage expansion (often supportive for risk).
--- Falling YoY % < 0 → deleveraging headwind.
--- Z-score spikes (±2) → unusually fast changes; watch for volatility or policy inflections.
--- Indexed Level crossing down through 100 → slipping below trend.
Inputs
--- Data source: Margin or TotalCredit
--- YoY/Z-score lookbacks and Index baseline length
--- Overlay: overlay=true, scale=scale.left (uses its own left axis by default)
Tips
--- If it spawns in a sub-pane, right-click the label → Move to → Main chart.
--- For context, consider adding related series on separate panes:
FRED:TOTALSL (Consumer Credit), FRED:REVOLSL (Credit Cards),
FRED:BUSLOANS (C&I Loans), FRED:TDSP (Debt Service Ratio).
--- Occasionally FRED returns “Failed to fetch”; re-add or reload fixes it.
Why it’s useful
Equity drawdowns often line up with turns in leverage (households, corporates, or brokers). This overlay gives you a clean, normalized read so you can spot expansion vs. contraction alongside price action.
Compatibility
--- Pine Script® v6
--- Works on any chart timeframe (data internally sampled monthly)
Educational use only — not financial advice.


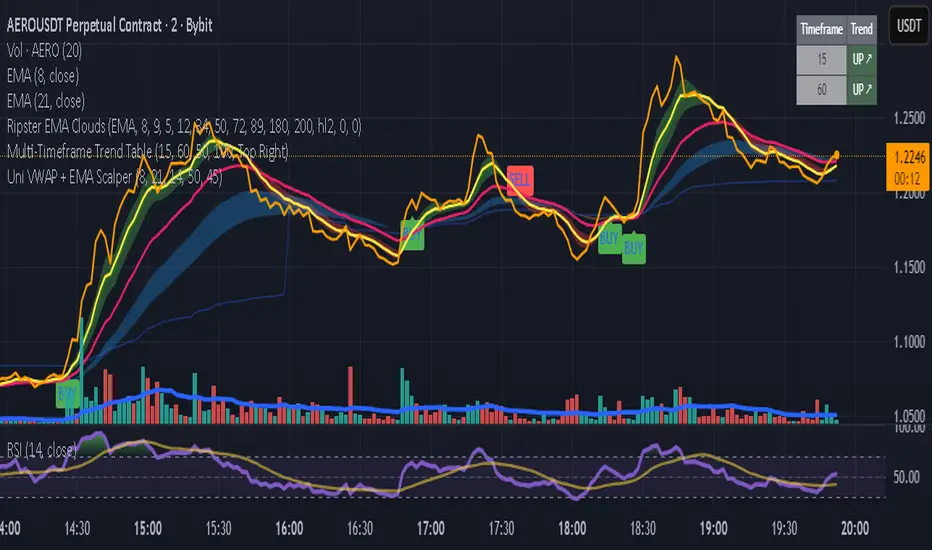
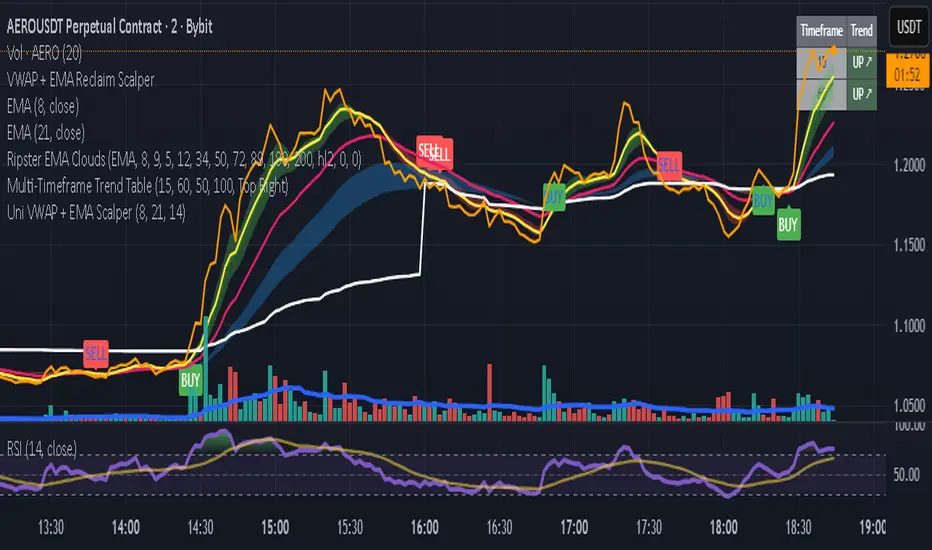
Uni VWAP + EMA ScalperWe learn more through the mistakes we make than the victories we enjoy. This is a work in progress to align visual and audible guidance for scalping and swing trades.
MTF EMA Trading SystemHere's a comprehensive description and usage guide for publishing your MTF EMA Trading System indicator on TradingView:
MTF EMA Trading System - Pro Edition
📊 Indicator Overview
The MTF EMA Trading System is an advanced multi-timeframe exponential moving average indicator designed for traders seeking high-probability setups with multiple confirmations. Unlike simple EMA crossover systems, this indicator combines trend alignment, momentum, volume analysis, and previous day confluence to generate reliable long and short signals with optimal risk-reward ratios.
✨ Key Features
1. Multi-Timeframe EMA Analysis
Configure 5 independent EMAs (default: 9, 21, 50, 100, 200)
Each EMA can pull data from ANY timeframe (5m, 15m, 1H, 4H, 1D, etc.)
Color-coded lines with customizable widths
End-of-line labels showing EMA period and timeframe (e.g., "EMA200 ")
Perfect for analyzing higher timeframe trends on lower timeframe charts
2. Advanced Signal Generation (Beyond Simple Crosses)
The system requires MULTIPLE confirmations before generating a signal:
LONG Signals Require:
✅ Price action trigger (EMA cross, bounce from key EMA, or pullback setup)
✅ Bullish EMA alignment (EMAs in proper ascending order)
✅ Volume spike confirmation (configurable threshold)
✅ RSI momentum confirmation (bullish but not overbought)
✅ Sufficient EMA separation (avoids choppy/whipsaw conditions)
✅ Price above previous day's low (confluence with support)
SHORT Signals Require:
✅ Price action trigger (EMA cross, rejection from key EMA, or pullback setup)
✅ Bearish EMA alignment (EMAs in proper descending order)
✅ Volume spike confirmation
✅ RSI momentum confirmation (bearish but not oversold)
✅ Sufficient EMA separation
✅ Price below previous day's high (confluence with resistance)
3. Real-Time Dashboard
Displays critical market conditions at a glance:
Overall trend direction (Bullish/Bearish/Neutral)
Price position relative to all EMAs
Volume status (spike or normal)
RSI momentum reading
EMA confluence strength
EMA separation quality
Current ATR value
Previous day high/low levels
Current signal status (LONG/SHORT/WAIT)
Risk-reward ratio
4. Clean Visual Design
Large, clear trade signal markers (green triangles for LONG, red triangles for SHORT)
No chart clutter - only essential information displayed
Customizable signal sizes
Professional color-coded dashboard
5. Built-In Risk Management
ATR-based calculations for stop loss placement
1:2 risk-reward ratio by default
All levels displayed in dashboard for easy reference
🎯 How to Use This Indicator
Step 1: Initial Setup
Add the indicator to your TradingView chart
Configure your preferred timeframes for each EMA:
EMA 9: Leave blank (uses chart timeframe) - Fast reaction to price
EMA 21: Leave blank or set to 15m - Key pivot level
EMA 50: Set to 1H - Intermediate trend
EMA 100: Set to 4H - Major trend filter
EMA 200: Set to 1D - Overall market bias
Adjust signal settings based on your trading style:
Conservative: Keep all confirmations enabled
Aggressive: Disable volume or momentum requirements
Scalping: Reduce min EMA separation to 0.2-0.3%
Step 2: Reading the Dashboard
Before taking any trade, check the dashboard:
Trend: Only take LONG signals in bullish trends, SHORT signals in bearish trends
Position: Confirm price is on the correct side of EMAs
Volume: Green spike = strong confirmation
RSI: Avoid extremes (>70 or <30)
Confluence: "Strong" = high probability setup
Separation: "Good" = trending market, avoid "Low" separation
Step 3: Trade Entry
For LONG Trades:
Wait for green triangle to appear below price
Verify dashboard shows:
Bullish or Neutral trend
Volume spike (preferred)
RSI between 50-70
Good separation
Enter at market or on next bar
Set stop loss at: Entry - (ATR × 2)
Set target at: Entry + (ATR × 4)
For SHORT Trades:
Wait for red triangle to appear above price
Verify dashboard shows:
Bearish or Neutral trend
Volume spike (preferred)
RSI between 30-50
Good separation
Enter at market or on next bar
Set stop loss at: Entry + (ATR × 2)
Set target at: Entry - (ATR × 4)
Step 4: Trade Management
Use the ATR values from dashboard for position sizing
Trail stops using the fastest EMA (EMA 9) as price moves in your favor
Exit partial position at 1:1 risk-reward, let remainder run to target
Exit immediately if dashboard trend changes against your position
💡 Best Practices
Timeframe Recommendations:
Scalping: 1m-5m chart with 5m, 15m, 1H, 4H, 1D EMAs
Day Trading: 5m-15m chart with 15m, 1H, 4H, 1D EMAs
Swing Trading: 1H-4H chart with 4H, 1D, 1W EMAs
Position Trading: 1D chart with 1D, 1W, 1M EMAs
Market Conditions:
Best in: Trending markets with clear direction
Avoid: Tight consolidation, low volume periods, major news events
Filter trades: Only take signals aligned with higher timeframe trend
Risk Management:
Never risk more than 1-2% per trade
Use ATR from dashboard to calculate position size
Respect the stop loss levels
Don't force trades when dashboard shows weak conditions
⚙️ Customization Options
EMA Settings (for each of 5 EMAs):
Length (period)
Timeframe (multi-timeframe capability)
Color
Line width
Show/hide toggle
Signal Settings:
Volume confirmation (on/off)
Volume spike threshold (1.0-3.0x)
Momentum confirmation (on/off)
RSI overbought/oversold levels
Minimum EMA separation percentage
ATR period and stop multiplier
Display Settings:
Show/hide EMA labels
Show/hide trade signals
Signal marker size (tiny/small/normal/large)
Show/hide dashboard
🔔 Alert Setup
The indicator includes 4 alert conditions:
LONG Signal - Fires when all long confirmations are met
SHORT Signal - Fires when all short confirmations are met
Bullish Setup - Early warning when trend aligns bullish with volume
Bearish Setup - Early warning when trend aligns bearish with volume
To set up alerts:
Right-click on chart → Add Alert
Select "MTF EMA Trading System"
Choose your desired alert condition
Configure notification method (popup, email, SMS, webhook)
📈 Performance Tips
Increase Win Rate:
Only trade in direction of higher timeframe trend
Wait for volume spike confirmation
Avoid trades during first 30 minutes and last 15 minutes of session
Skip trades when separation is "Low"
Reduce False Signals:
Increase minimum EMA separation to 0.7-1.0%
Enable all confirmation requirements
Only trade when confluence shows "Strong"
Combine with support/resistance levels
Optimize for Your Market:
Stocks: Use 9, 21, 50, 100, 200 EMAs
Forex: Consider 8, 13, 21, 55, 89 EMAs (Fibonacci)
Crypto: May need wider ATR multiplier (2.5-3.0x) for volatility
⚠️ Important Notes
This indicator is designed to reduce false signals by requiring multiple confirmations
No indicator is 100% accurate - always use proper risk management
Backtesting recommended before live trading
Market conditions change - adjust settings as needed
Works best in liquid markets with clear price action
🎓 Conclusion
The MTF EMA Trading System transforms simple moving average analysis into a sophisticated, multi-confirmation trading strategy. By combining trend alignment, momentum, volume, and confluence, it helps traders identify high-probability setups while filtering out noise and false signals. The clean interface and comprehensive dashboard make it suitable for both beginners and experienced traders across all markets and timeframes.

Uni VWAP + EMA ScalperFor backtesting by small group. It's intended to synch and provide visual and audible alerts.
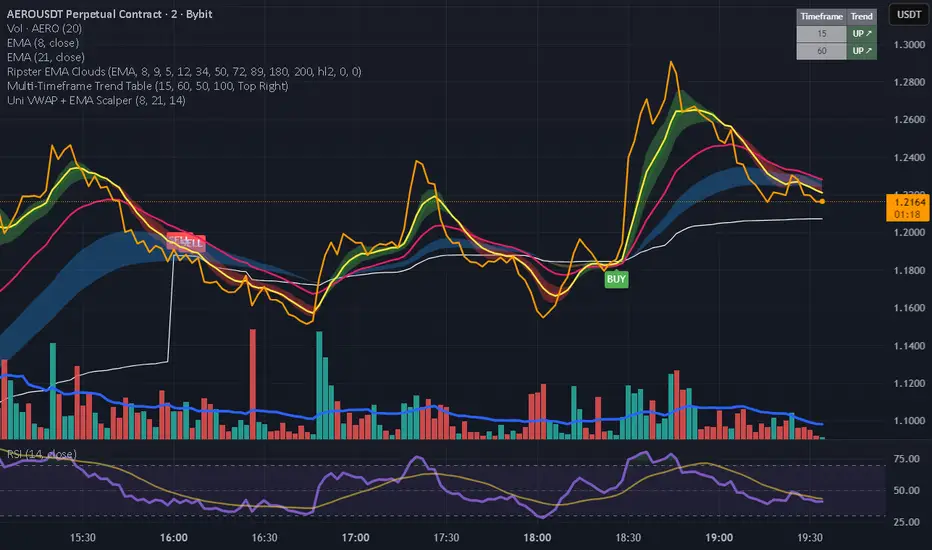
Uni VWAP + EMA ScalperSimple VWAP + EMA crossover test script for personal use and signal experiments.
Prototype tool combining VWAP and EMA crossovers for testing trade timing. Not optimized for live trading.
Morning Star & Rising Star Detector - Neon CandlesMorning Star & Rising Star to determine several levels and forecast what might happen next with the price.

QuickInputsLevelParserLibrary "QuickInputsLevelParser"
Provides a parsing library that indicator authors can use in order to parse Quick Inputs Levels.
parseLevels(s)
Parses the string content and returns the `QILevels` found within.
Parameters:
s (string) : The string to parse.
Returns: The parsed WTD levels.
zoneRange
Fields:
high (series float)
low (series float)
QILevels
Fields:
supplyLines (array)
supplyZones (array)
majorLines (array)
onZones (array)
onLines (array)
highLines (array)
lowLines (array)
htfZones (array)
mansupLines (array)
mansupmajLines (array)
mansupZones (array)
mansupmajZones (array)
manresLines (array)
manresmajLines (array)
manresZones (array)
manresmajZones (array)
Hourly High Low Short LinesDraws short horizontal lines at the previous hour’s high and low, aligned perfectly with the candle’s top and bottom.
It’s concise, clear, and fits well for the public script description box.

Filled Fair Value GapsThese are filled fvgs it only shows filled fvgs so you can see where price is retracing to and don't have 50 fvgs on your screen

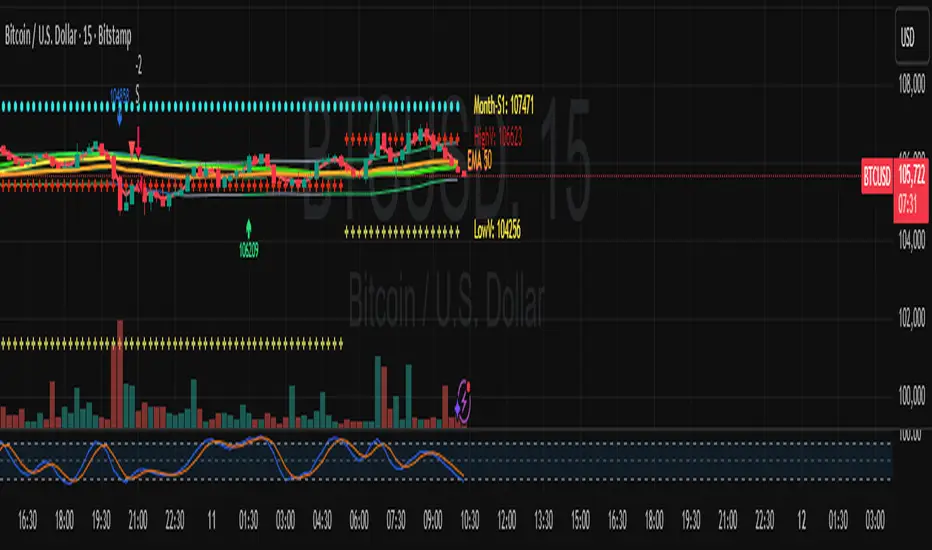
ATR Channel (Bottom & Top)The ATR Channel (Bottom & Top) indicator dynamically visualizes market volatility zones based on the Average True Range (ATR). It automatically builds adaptive upper and lower boundaries around the current price, helping traders identify potential market extremes, volatility-driven reversals, and dynamic support/resistance levels.
This version is specifically optimized for Bitcoin (BTCUSDT) but works with any asset or timeframe.
⚙️ How It Works
The indicator calculates ATR over a user-defined period (default 200) and applies separate multipliers for the top and bottom bands (default ×1).
The Top Band = Close + (ATR × Multiplier)
The Bottom Band = Close - (ATR × Multiplier)
These two adaptive bands create a volatility envelope, allowing traders to visualize where the price may encounter potential exhaustion or reversal zones.
💡 Signal Logic
LONG Signal (Green Tab):
Triggered when the low of the candle touches or dips below the ATR bottom line — suggesting a possible oversold or volatility-based bottoming area.
The label displays the exact ATR line value (not the close), formatted for better readability (e.g. “LONG 103 885”).
SELL Signal (Red Tab):
Triggered when the high of the candle touches or exceeds the ATR top line — signaling possible overbought conditions or an exhaustion zone.
Signal Filtering:
The script intelligently avoids duplicate signals — e.g., multiple consecutive LONGs or SELLs will not appear until the opposite signal is triggered.
This ensures cleaner visualization and reduces signal noise during consolidation periods.
🎯 Features
✅ Adaptive ATR-based volatility channel
✅ Automatic LONG/SELL signal labeling with real ATR-touch prices
✅ Customizable parameters:
✅ Intelligent filtering (one signal per phase)
✅ Works on any market and timeframe (crypto, forex, indices, stocks)
🧭 Trading Applications
Identify volatility extremes (ATR-based overbought/oversold zones)
Detect reversal points or exhaustion moves after extended trends
Use with trend filters (e.g. EMA200) to confirm trend continuation vs mean reversion setups
Combine with oscillators (RSI, Stoch) for confluence signals
📊 Summary
The ATR Channel (Bottom & Top) provides a clear, professional-grade visualization of volatility dynamics and price extremes.
It is especially useful for traders using mean-reversion, volatility breakout, or swing-trading strategies — helping them identify statistically significant reaction zones and improving trade timing precision.

[Statistics] killzone SFPSFP Statistics (ICT Sessions)
This indicator automatically finds and draws the high and low of the Asia, London, and New York trading sessions. It then hunts for Swing Failure Patterns (SFPs) that sweep these key session levels.
The main purpose of this script is to gather statistics on when these high-probability SFPs occur, allowing you to map out and identify the times of day when they are most frequent.
How to Use This Indicator
Set Your SFP Timeframe: In the settings, choose the timeframe you want to hunt for SFPs on (e.g., 1H, 15m). Important: You must also set your main chart to this exact same timeframe for the statistics to be collected correctly.
Define Your Sessions: Go to the "Session Definitions" tab.
Set the Global Timezone to your preferred trading timezone (e.g., "America/New_York"). This controls all session times and table times.
Adjust the start and end times for Asia, London, and NY AM sessions.
You can turn off sessions you don't want to track (like NY Lunch or NY PM).
You can also change the colors and text style for the session boxes here.
Set Confirmation Bars: In "SFP Engine Settings," the "Confirmation Bars" (default is 2) defines how many bars must close after the SFP bar without invalidating the level. An SFP is only "confirmed" and drawn after this period.
0 = Confirms immediately on the SFP candle's close.
2 = Confirms 2 bars after the SFP candle's close.
Read the Statistics: The "Custom SFP Statistics" table will appear on your chart. This table logs every confirmed SFP and tells you:
Which time of day they happen most.
How many were Bearish (swept a high) vs. Bullish (swept a low).
It's set by default to show the "Top 20" most frequent times, sorted chronologically.
Filter Your Chart (Optional): If your chart feels cluttered, go to "Visual Time Filter" and turn it ON.
Set a time window (e.g., "09:30-11:00").
The indicator will now only draw SFP signals that occurred within that specific time window. This is perfect for focusing on a single killzone.
How to Set Up Alerts
You can set up server-side alerts to be notified every time a new SFP is confirmed.
Check the "Enable SFP Alerts" box at the top of the indicator's settings.
Click the "Alert" button (alarm clock icon) on the TradingView toolbar.
In the "Condition" dropdown, select "SFP Statistics (ICT Sessions)".
In the second dropdown, choose "Any alert() function call".
Most Important Step: In the "Message" box, delete any default text and type in this exact placeholder:
{{alert_message}}
Set the trigger to "Once Per Bar Close".
Click "Create".
How Alerts Work (Triggers & Filtering)
Trigger: Alerts are tied to the confirmed signal. An alert will only fire after your "Confirmation Bars" have passed and the SFP is locked in. This prevents you from getting alerts on fake-outs.
Alert Filtering: The alerts are linked to the "Visual Time Filter". If you turn on the Visual Time Filter (e.g., to 09:30-11:00), you will only receive alerts for SFPs that are confirmed within that time window. If an SFP happens at 14:00, the script will ignore it, it will not be drawn, and it will not send you an alert. This allows you to get alerts only for the session you are actively trading.
Note: This is a first draft of this indicator. I will continue to work on it and improve it over time, as it may still contain small bugs.
Acknowledgements:
A big thank you to TFO (tradeforopp). The session detection logic and the visual style for the session boxes were adapted from his excellent "ICT Killzones & Pivots " indicator.

Position Sizer (% of Acct & Shares Req)
This indicator calculates % position size and share quantity required based on total capital and user-defined risk percentages
This indicator differs from the Shares Qty indicator in that it is based on %'s rather than a user-defined, fixed dollar amount to risk (for those who prefer to calculate risk in this manner instead)
Tracks real-time Low of Day (LoD) during regular trading hours (RTH) for accurate stop placement
Current price as well as output rows 2 and 3 can be toggled on/off, per preference
Allows stop loss selection between LoD, Low of Week (LoW), and Prior Day Low (PDL)
Keeps data updating intraday to reflect changing LoD and price conditions
Provides a second “Stop Loss Compare” dropdown to compare two stop methods side by side
Displays all results in a dynamic on-chart table that updates with live prices
Shows capital amount, stop type, stop price, and share counts for three risk levels
=========
Risk rows displayed as: Risk of Cap Amt: ,
=========
Disclaimer:
This indicator is for educational and informational purposes only. It should not be used as the sole basis for trading decisions. Always combine with other forms of analysis, proper risk management techniques, and consider your individual trading plan and risk tolerance. All calculations and outputs are provided as-is, and it is your responsibility to verify their accuracy before making any trading decisions.

GK Starforge Breakout V2FORGED FROM THE STARS- Built for Precision
the Gk Starforge breakout V2 detects major breakout moves when price CLOSES ABOVE PREVIUOS HIGH (GK BUY) or BELOW THE PREVIOUS LOW (GK SELL)
It includes ATR based TP and the option to show one signal per trend for cleaner charts
non repainting and optimized for XAUUSD this indicator helps you catch real structure breaks with clarity and confidence
it prints a buy print or sell print along with a TP based ATR next to it
2 prints either side

XenoSmooth Predictive Candles - Advanced Heikin Ashi CandlesXenoSmooth Predictive Candles
Summary in one paragraph
A synthetic candle engine for crypto, FX, equities, and futures on intraday to swing timeframes. It reduces noise and flip delay so structure is easier to read. The core novelty is a predictive open with inertia plus slope lead fused with a zero lag body filter and an overshoot based wick model normalized by the real range and capped by ATR. Add it to a clean chart, hide regular candles if desired, and tune lengths. Shapes can move while the bar is open and settle on close. For conservative workflows read on bar close.
Scope and intent
• Markets. Major FX pairs, index futures, large cap equities, liquid crypto
• Timeframes. One minute to daily
• Purpose. Faster and smoother visual structure than Heikin Ashi while keeping causality and realistic wicks
Originality and usefulness
• Unique concept. Predictive open with inertia and slope lead plus selectable zero lag body filter and ATR capped wick overshoot in percent of real range
• Failure mode addressed. Late flips in chop and unreal long wicks from raw extremes
• Testability. Every control is an input. Users can toggle body method, lengths, clipping, and percent modeling
• Portable yardstick. ATR based wick cap and percent of bar range scale across symbols
Method overview in plain language
Build a robust base price from O, H, L, and extra weight on Close. Smooth it with a chosen filter to produce the synthetic close. Drive a predictive open that follows the synthetic close with tunable inertia and a small lead from the last bar slope. Model wicks as the portion of the real extremes that extends beyond the synthetic body, smooth that overshoot, normalize by the bar range if selected, then cap by ATR to avoid tail spikes. Clamp synthetic values to the real high and low if enabled.
Base measures
• Range basis. True Range for the ATR cap and High minus Low for percent normalization
• Return basis. Not used
Components
• Body Base Blend. Weighted O H L with a close bias to stabilize the base
• Zero Lag Body Filter. ZLEMA or Super Smoother or WMA to set the synthetic close
• Predictive Open. Inertial follow of the synthetic close plus a slope lead term
• Wick Overshoot Model. Smoothed extension beyond the body, optional percent of real range, ATR cap
• Clamp Option. Keeps synthetic open and close inside the real bar range
Fusion rule
• Synthetic close equals filtered base
• Synthetic open equals previous open plus inertia times distance to synthetic close plus slope lead
• Wicks equal smoothed overshoot above and below the body, optionally percent of range then converted back to price and capped by ATR
Inputs with guidance
Setup
• Signal timeframe. Uses the chart timeframe
• Invert direction. Not applicable
• Session windows. Not applicable
Logic
• Body length. Core smoothing length for the synthetic close. Typical 6 to 14. Higher gives smoother and slower. Lower gives faster flips
• Body method. ZLEMA or Super Smoother or WMA. ZLEMA is fastest. Super Smoother is calmest
• Close weight in base. 0 to 1. Higher gives stronger emphasis on close and less noise
• Open inertia. 0 to 1. Higher makes the open follow the close more tightly
• Lead gain. 0 to 1. Higher adds more phase lead. Keep modest to avoid overshoot
• Clamp body to real range. On keeps synthetic body inside high and low
• Wick smooth length. Typical 4 to 10. Higher reduces jitter
• Overshoot as percent. On stabilizes wicks across regimes
• ATR length. Typical 10 to 20 for the cap
• Max wick equals ATR times. 0 disables. 1.0 to 2.0 contains extreme tails
Filters
• Efficiency or trend filter. Not used
• Micro versus macro range relation. Not used
• Location filter. Not used
Realism and responsible publication
• No performance claims
• Intrabar motion reminder. Shapes can move while a bar forms and settle on close
• Strategies must use standard candles for signals and orders
Honest limitations and failure modes
• High impact releases and thin liquidity can distort wicks and produce gaps that any smoother cannot predict
• Very quiet regimes can reduce contrast. Consider longer body length
• Session time on the chart controls the definition of each bar
