SMA MAD Trend [Alpha Extract]A sophisticated trend identification system that combines Simple Moving Average with Mean Absolute Deviation methodology to create adaptive Super Trend-style bands with advanced strength filtering and gradient visualization. Utilizing ADX-based trend strength validation and slope analysis for signal quality enhancement, this indicator delivers institutional-grade trend detection with dynamic ATR-based ribbon visualization and comprehensive strength measurement. The system's dual-filter architecture eliminates false signals during weak or choppy market conditions while maintaining sensitivity to genuine trend establishment and reversal events.
🔶 Advanced SMA-MAD Band Construction
Implements innovative Mean Absolute Deviation calculation around Simple Moving Average baseline to create volatility-adaptive bands with ratcheting logic for trend persistence. The system calculates MAD by measuring absolute price deviations from the mean, then applies configurable multipliers to generate upper and lower bands that adjust to changing market conditions while preventing premature band violations.
// Core SMA-MAD Framework
SMA_Value = ta.sma(close, SMA_Length)
Mean = ta.sma(close, MAD_Length)
Abs_Deviation = abs(close - Mean)
MAD_Value = ta.sma(Abs_Deviation, MAD_Length)
// Adaptive Bands
Upper_Band = SMA_Value + MAD_Factor * MAD_Value
Lower_Band = SMA_Value - MAD_Factor * MAD_Value
🔶 Intelligent Dual-Filter System
Features comprehensive trend validation using ADX strength measurement and slope analysis to eliminate low-conviction signals during ranging or consolidating markets. The system calculates normalized slope strength using ATR scaling and combines with ADX threshold analysis, generating filtered trend states that distinguish genuine trends from temporary price fluctuations.
🔶 Dynamic Trend Strength Engine
Implements sophisticated strength calculation combining slope intensity and ADX readings to produce normalized 0-100% strength scores with gradient colour intensity modulation. The system normalizes slope by minimum threshold and ADX by configurable level, multiplying factors to create composite strength measurement that drives visual feedback intensity across all indicator elements.
🔶 Super Trend-Style Direction Logic
Utilizes classic Super Trend methodology adapted for SMA-MAD bands, where trend direction flips occur on opposite band violations with persistent state maintenance. The system tracks previous band levels with ratcheting behaviour that adjusts bands only when price movement or new calculations warrant changes, preventing oscillation during normal volatility.
🔶 ATR-Based Ribbon Visualization
Provides dynamic ribbon overlay using ATR-scaled width around the trend line with opacity modulation based on trend strength for intuitive conviction assessment. The system creates upper and lower ribbon bounds at configurable ATR multiples, filling the channel with gradient-adjusted transparency that increases during strong trends and fades during weak conditions.
🔶 Multi-Dimensional Visual Architecture
Provides complete chart integration through trend line overlay, ATR ribbon fills, candle colouring, background glow, and transition signal labels with configurable visibility toggles. The system enables traders to customize display density from minimal (trend line only) to comprehensive (all visual elements) while maintaining consistent colour scheme and strength-based intensity across components.
🔶 Slope Strength Validation
Calculates ATR-normalized slope over configurable lookback periods to measure trend line momentum and filter sideways price action. The system compares absolute slope against minimum threshold requirements, preventing trend signals when price movement relative to the trend line lacks sufficient directional conviction regardless of band position.
🔶 Signal Generation Framework
Generates trend change signals when filtered direction state transitions from bearish to bullish or vice versa, with label placement and alert integration. The system implements state persistence that maintains previous trend until both ADX and slope filters confirm directional change, reducing whipsaw signals while capturing genuine reversals with minimal lag.
🔶 Performance Optimization Framework
Utilizes efficient calculation methods with optimized variable management and configurable parameters for balance between responsiveness and stability. The system includes intelligent state tracking with NA handling for initial bars and smooth gradient calculations that maintain performance across extended historical periods and real-time updates.
This indicator delivers sophisticated trend identification through Mean Absolute Deviation methodology combined with dual-strength filtering for superior signal quality. Unlike traditional Super Trend indicators that rely solely on ATR bands, the SMA-MAD approach uses statistical deviation measurement while incorporating ADX strength and slope validation to eliminate false signals during choppy conditions. The system's gradient-based visual feedback, ATR ribbon visualization, comprehensive dashboard, and multi-dimensional filtering make it essential for traders seeking reliable trend-following approaches with clear conviction measurement across cryptocurrency, forex, and equity markets. The combination of adaptive bands, strength-based transparency, and intelligent filtering creates an institutional-grade trend system suitable for systematic trading strategies.
Indikatoren und Strategien

ICT Precision Turtle Soup NuNi1. Identify the CRT Range (The Context)
Before looking for a trade, the indicator defines the Candle Range Theory (CRT) boundaries based on your lookback period.
CRT High (Red Line): Represents old buy-side liquidity.
CRT Low (Green Line): Represents old sell-side liquidity.
HTF Filter: The code ensures the higher timeframe trend (e.g., 4H) aligns with your direction. Only look for Buys if the HTF trend is bullish.
2. The Manipulation (Turtle Soup 🐢)
Wait for price to move outside the CRT boundaries.
The Trap: Price must sweep below the CRT Low or above the CRT High.
The Reclaim: A Turtle Body Soup (TBS) occurs when the candle body closes back inside the range, or a wick rejection happens.
Symbol: A 🐢 icon will appear on the chart. Do not entry yet. This is just a warning that a setup is forming.
3. The Shift & Momentum (The Trigger)
To ensure a high-probability entry, the indicator waits for two technical confirmations:
MSS (Market Structure Shift): Price must break the most recent swing high (for Buys) or swing low (for Sells).
Displacement: The breaking candle must be "displaced"—meaning it has a large, energetic body compared to previous candles. This proves that big banks/institutions are moving the price.
4. The Entry Execution
Once all conditions are met, the "⭐ PRECISION ENTRY" label will appear.
Execution: You can enter at the market price when the label appears.
Retest Entry: Alternatively, look for the price to return to the IFVG or Breaker Zone (the shaded box) drawn by the indicator for a more refined entry.

yon Price Above 200 EMA & RSI < 11The indicator will highlight potential oversold bounce opportunities when price is in an uptrend (above 200 EMA) but temporarily oversold on the RSI-2.
Check on youtube for video that explains the mechanics of Larry Connors' 2-period RSI strategy and how it differs from traditional RSI use, which is essential for applying it to volatile instruments like 0DTE QQQ.

Michael Mor - ATRMichael Mor -ATR is a clean, lightweight chart watermark that gives you key stock context at a glance — without cluttering your chart or covering price action.
It’s designed for traders who want essential fundamentals + recent performance visible directly on the chart, in a subtle, professional style.
What it shows
You can toggle each line on or off:
Company name (optional market cap: M / B / T)
Symbol & timeframe
Sector & industry
ATR (14) with percentage of price and a quick volatility indicator
🟢 low volatility
🟡 medium volatility
🔴 high volatility

Golden Zone Structure [Kodexius]Golden Zone Structure is a ZigZag based market structure and Fibonacci tool designed to make swing context easier to read directly on the price chart. It detects meaningful pivot highs and lows, labels the evolving structure (HH, HL, LH, LL, including equal highs and lows), and automatically projects a Fibonacci map across the most recent completed swing.
Instead of forcing you to manually anchor Fib tools after every new leg, the script rebuilds levels each time a fresh pivot is confirmed. This makes it well suited for traders who focus on swing continuation, pullback depth, and reaction zones where liquidity and orderflow often concentrate.
A key emphasis is the Golden Zone highlight. The indicator shades the zone that is most relevant to the current swing context so you can quickly spot where a retracement is approaching a higher probability reaction area, without cluttering the chart with too many permanent objects.
The tool is intentionally visual and configurable. You can choose pivot source (High/Low or Close), adjust swing sensitivity via ZigZag period, switch color themes, and decide how much detail you want on screen (levels, zigzag lines, labels).
Optional trading markers can be enabled for users who want a lightweight “zone interaction” prompt. These markers are not intended as a standalone trading system. They are meant to complement your own confirmation rules (structure alignment, volume, higher timeframe bias, or price action triggers).
🔹Features
🔸 ZigZag Swing Engine
- Uses a configurable ZigZag period to filter noise and confirm swing points only when the lookback logic validates the move.
Supports different pivot sources (High/Low or Close) so you can choose between cleaner structure or more reactive behavior depending on the instrument.
Optional ZigZag leg drawing to visualize swing flow without clutter.
🔸 Market Structure Labels (HH, HL, LH, LL + Equals)
- Automatically labels each confirmed pivot based on how it compares to the prior pivot of the same type.
High side classification: H, HH, LH, EH.
Low side classification: L, HL, LL, EL.
Equal highs and lows help reveal potential liquidity pools and “magnet” areas where price often reacts or breaks with intent.
🔸 Auto Fibonacci Map on the Active Swing
- Rebuilds Fibonacci levels every time a new pivot is confirmed, keeping the projection aligned with the most recent completed leg.
Core retracement levels: 0.236, 0.382, 0.500, 0.618, 0.786.
Extension levels: 1.272 and 1.618 for expansion targeting and continuation mapping.
Optional price labels on each level, formatted to tick size so levels remain readable across markets.
🔸 Golden Zone Highlighting (Context Aware)
- Highlights the most relevant retracement band with a soft fill so you can spot “zone approach” moments at a glance.
The zone selection adapts to swing context, focusing on a different retracement region depending on whether the last confirmed pivot is a peak or a trough.
Adjustable transparency keeps the chart clean while preserving the key reaction area.
🔸 Visual Customization + Themes
- Multiple color themes (Neon, Ocean, Sunset, Monochrome) so the tool fits different chart styles and backgrounds.
Independent toggles for Fib levels, Golden Zone shading, ZigZag lines, and price labels.
Line width controls for better scaling across timeframes.
🔸 Optional Trading Markers + Alerts
- Optional BUY and SELL labels based on zone interaction logic with candle confirmation filters.
ATR based placement offset scaled by sensitivity so labels stay visually separated during volatility.
Built in alert conditions for new pivot highs and new pivot lows so you can monitor structure changes without watching every bar.
▶ Practical Usage Tip
• Use structure labels to define bias (HH + HL for bullish structure, LH + LL for bearish structure).
• Use the Golden Zone as a location filter, then wait for your own trigger (break of minor structure, rejection candle, volume shift, etc.).
• Treat extensions as “map points” not guaranteed targets. They work best when structure supports continuation.

Kira Buy Sell EMA & VWAP Trend IndicatorThis indicator provides buy and sell signals based on short-term
momentum shifts while aligning trades with the broader market
trend.
Core logic:
• Fast and slow EMAs are used to identify short-term momentum
changes
• VWAP is applied to confirm price acceptance in the trade
direction
• A higher-period EMA is used as a trend filter to reduce
counter-trend signals
Buy signals are generated when bullish momentum aligns with
VWAP positioning and the prevailing trend. Sell signals are
generated when bearish momentum aligns with VWAP and the
broader trend direction.
This approach keeps the logic simple and responsive while
helping to avoid signals during unfavorable market conditions.
Best suited for liquid stocks and indices on intraday
timeframes such as 5-minute to 1-hour charts.
This script does not repaint and is intended as a
decision-support indicator, not a standalone trading system.

Impulse Trend Suite LITE🚀 Impulse Trend Suite LITE
Smart trend visualization with precise flip arrows. A lightweight, momentum-filtered trend tool designed to stay clean, avoid repeated signals, and keep you focused only on real market direction.
🔍 Quick Guide
BUY setup = green arrow + green background
SELL setup = red arrow + red background
Stay in the move while color doesn’t change
ATR channel helps avoid chasing overextended candles

Performance with Okuninushi Line Area Determinations**Performance Indicator with Market Structure Analysis**
Building upon TradingView's official Performance indicator, I've added a custom column to assess current market structure using my Okuninushi Line methodology, which visualizes the AB structure concept.
**What is the AB Structure?**
The AB structure identifies equilibrium levels based on recent price action. The Okuninushi Line calculates the 50% midpoint between the highest high and lowest low over a specified lookback period. In this implementation, I use a 65-day period on the daily timeframe (representing one quarter: 13 weeks × 5 trading days), though this is fully customizable.
**Market Structure Classification:**
- **Above Okuninushi Line** → "upper to okuni" → Price is in the **Premium Area** (bullish structure)
- **Below Okuninushi Line** → "down to okuni" → Price is in the **Discount Area** (bearish structure)
This additional column provides an instant visual reference for whether each asset is currently trading above or below its equilibrium level, complementing the traditional performance metrics with structural context.
---

PrimeFib_constants_v1Library "PrimeFib_constants_v1"
PrimeFib / GoldenWhirl constants (Pine Library). Versioning is handled via TradingView publish versions.
GOLDEN_RATIO()
GOLDEN_RATIO_INV()
PI()
INV_PI()
PHI_SPIRAL()
PHI7()
PHI7_INV()
PSI_PF()
PSI_PF_INV()
LAMBDA_PF()
RHO_PF_THEO()
RHO_BTC_EMP()
RHO_CME_EMP()
RHO_PF_EMP()
RHOT()

Optimized Options Day Trading Script -Anurag Dec20-2025This indicator is a specialized Multi-Timeframe Trend & Regime System designed specifically for intraday trading on SPY, QQQ, and SPX. It is optimized for high-volatility execution (like 0DTE) by filtering out "choppy" low-probability conditions before they happen.
Unlike standard indicators that only look at the current chart, this script runs a background check on the 15-Minute Timeframe

ORB 2R Retest Volume Entry (1m) - v6gJdsfjs kdfg s jdslzi gdsjzg SJFds SJKdls dsjzgfjdkzl GDMKls gndsmzgSfgndmsKF fdnsioGLfs


EMA 21/50/200 Trend Support & EntryIndicator plots EMA 21, EMA 50, and EMA 200 to define trend structure and dynamic support/resistance.
EMA 200: overall trend bias
EMA 21 and EMA 50: pullback support for high probability trend entries.
EMA 21/50 crosses highlight momentum shifts but are not intended as standalone entry signals.

Minervini Template + Powerplay detectorMinervini Template + PowerPlay Detector
This indicator implements a rule-based Minervini trend template to identify stocks in strong, institutionally supported uptrends, combined with a Power Play momentum detector for explosive leadership moves.
Minervini Model (MM) Rules
The MM dashboard turns GREEN only when all of the following rules are met:
Close ≥ 150-day SMA
Close ≥ 200-day SMA
50-day SMA > 150-day SMA
50-day SMA > 200-day SMA
150-day SMA ≥ 200-day SMA
200-day SMA is rising (current value higher than ~1 month ago)
Close is at least 30% above the 52-week low
Close is within 25% of the 52-week high
Close is not more than 8% below the 50-day SMA
These rules ensure:
Proper long-term trend structure
Institutional accumulation alignment
Strength near highs, not extended weakness
When MM is red, hovering over it shows exactly which rules failed, allowing quick diagnosis of why a stock does not qualify.
POWERPLAY Logic
POWERPLAY highlights rare, high-velocity leadership moves:
Triggers when a stock gains 90% or more within any rolling window of up to 60 trading sessions
Remains active as long as the condition continues to hold
Hover tooltip displays:
Start date of the move
Current date
Total percentage gain so far
This captures fast institutional momentum, even if the move occurs in fewer than 60 sessions.
Dashboard Features
Moveable to any corner of the chart
Adjustable size
Adjustable opacity
Designed for trend followers and momentum traders seeking true market leaders, not short-term noise or late-stage breakouts.

HaP MACDHaP MACD - Advanced DEMA Assisted Signal Indicator
Overview
The HaP MACD is an evolution of the classic MACD, designed for traders who demand faster response times and clearer trend visualisations. By integrating DEMA (Double Exponential Moving Average) logic into the standard MACD framework, this indicator filters out noise and highlights momentum shifts with a unique color-coded dot system.
How It Works
The indicator calculates two types of MACD: a standard one for the main lines and a DEMA-based one for signal generation. This dual approach ensures you stay in the trend while being alerted the moment the momentum starts to fade.
Visual Guide & Color Logic
The signal dots are placed directly on the MACD line to guide your decisions:
🔵 Blue Dot: The Entry Signal. Appears when DEMA conditions first align for a bullish move.
🟢 Green Dot: Strong Momentum. The trend is active and the MACD value is increasing.
🟠 Orange Dot: Warning Signal. The bullish trend is still active, but the momentum is slowing down (MACD is lower than the previous bar).
🔴 Red Dot: Exit Signal. The bullish condition has ended. It’s time to consider closing the position or tightening stops.
Key Features
Reduced Lag: DEMA integration provides earlier signals than standard EMA-based MACDs.
Trend Monitoring: Easily distinguish between a healthy trend (Green) and a tiring trend (Orange).
Customizable: Choose between EMA and SMA for both the oscillator and signal calculations.
Crossover Markers: Optional triangle markers for classic MACD crossovers (can be enabled in settings).

Aroon (Any Source)Aroon (Any Source)
Overview
This indicator is an enhanced version of the classic Aroon Oscillator. It measures trend dominance based on the recency of highs and lows, with added flexibility to operate on any chosen source series and an optional price-scaling mechanism based on VWAP distance.
What the Indicator Does
The Aroon Oscillator compares how recently the most recent high and low occurred within a lookback window. The result is a bounded oscillator that indicates whether buyers or sellers are currently dominant.
This version adds: - Ability to run Aroon on any source - Optional smoothing to reduce noise - Optional VWAP-based price scaling
Core Outputs
• Aroon Up (0–100): Strength of recent highs
• Aroon Down (0–100): Strength of recent lows
• Aroon Oscillator (−100 to +100): Net dominance (Up − Down)
Inputs and Options
• Source: Input series used for calculations
• Aroon Length: Lookback window
• Use Source for High/Low: Enables Aroon-like mode on any series
• Show Oscillator: Toggles oscillator plot
• Show Aroon Up/Down: Toggles component lines
• Smooth Oscillator: Light smoothing (EMA/RMA/SMA)
• VWAP Price Scaling: Scales signal by VWAP distance normalized by ATR
How to Use It
Use the oscillator as a trend regime filter. Positive values indicate bullish dominance; negative values indicate bearish dominance. VWAP scaling helps suppress signals near equilibrium and emphasize extended moves.
Practical Notes
• Measures recency, not magnitude
• Best used as a regime or bias input
• Especially effective intraday with VWAP scaling


OCC Strategy Optimized (MA 5 + Delayed TSL)# OCC Strategy Optimized (MA 5 + Delayed TSL) - User Guide
## Introduction
The **OCC Strategy Optimized** is an enhanced version of the classic **Open Close Cross (OCC)** strategy. This strategy is designed for high-precision trend following, utilizing the crossover logic of Open and Close moving averages to identify market shifts. This optimized version incorporates advanced risk management, multi-timeframe analysis, and a variety of moving average types to provide a robust trading solution for modern markets.
>
> **Special Thanks:** This strategy is based on the original work of **JustUncleL**, a renowned Pine Script developer. You can find their work and profile on TradingView here: (in.tradingview.com).
---
## Key Features
### 1. Optimized Core Logic
- **MA Period (Default: 5):** The strategy is tuned with a shorter MA length to reduce lag and capture trends earlier.
- **Crossing Logic:** Signals are generated when the Moving Average of the **Close** crosses the Moving Average of the **Open**.
### 2. Multi-Timeframe (MTF) Analysis
- **Alternate Resolution:** Use a higher timeframe (Resolution Multiplier) to filter out noise. By default, it uses $3 \times$ your current chart timeframe to confirm the trend.
- **Non-Repainting:** Includes an optional delay offset to ensure signals are confirmed and do not disappear (repaint) after the bar closes.
### 3. Advanced Risk Management
This script features a hierarchical exit system to protect your capital and lock in profits:
- **Fixed Stop Loss (Initial):** Protects against sudden market reversals immediately after entry.
- **Delayed Trailing Stop Loss (TSL):**
- **Activation Delay:** The TSL only activates after the trade reaches a specific profit threshold (e.g., 1%). This prevents being stopped out too early in the trade's development.
- **Ratchet Trail:** Once activated, the stop loss "ratchets" up/down, never moving backward, ensuring you lock in profits as the trend continues.
- **Take Profit (TP):** A fixed percentage target to exit the trade at a pre-defined profit level.
### 4. Versatility
- **12 MA Types:** Choose from SMA, EMA, DEMA, TEMA, WMA, VWMA, SMMA, HullMA, LSMA, ALMA, SSMA, and TMA.
- **Trade Direction:** Toggle between Long-only, Short-only, or Both.
- **Visuals:** Optional bar coloring to visualize the trend directly on the candlesticks.
---
## User Input Guide
### Core Settings
- **Use Alternate Resolution?:** Enable this to use the MTF logic.
- **Multiplier for Alternate Resolution:** How many charts higher the "filter" timeframe should be.
- **MA Type:** Select your preferred moving average smoothing method.
- **MA Period:** The length of the Open/Close averages.
- **Delay Open/Close MA:** Use `1` or higher to force non-repainting behavior.
### Risk Management Settings
- **Use Trailing Stop Loss?:** Enables the TSL system.
- **Trailing Stop %:** The distance the stop follows behind the price (Optimized Default: 1.5%).
- **TSL Activation % (Delay):** The profit % required before the TSL starts moving. (Optimized Default: 2.0% to ensure 0.5% profit is locked immediately).
- **Initial Fixed Stop Loss %:** Your hard stop if the trade immediately goes against you.
- **Take Profit %:** Your ultimate profit target for the trade.
---
## How to Trade with This Strategy
1. **Identify the Trend:** Look for the Moving Average lines (Close vs Open) to cross.
2. **Wait for Confirmation:** If using MTF, ensure the higher timeframe also shows a trend change.
3. **Manage the Trade:** Let the TSL work. With the default **2.0% Activation** and **1.5% Trail**, the strategy will automatically lock in **0.5% profit** the moment the threshold is hit, then follow the price higher.
4. **Position Sizing:** Adjust the `Properties` tab in the script settings to match your desired capital allocation (Default is 10% of equity).
---
## Recommended Settings
1. Trialing < Activation
2. Check ranging
## Credits
Original Strategy by: **JustUncleL**
Optimized and Enhanced by: **Antigravity AI**

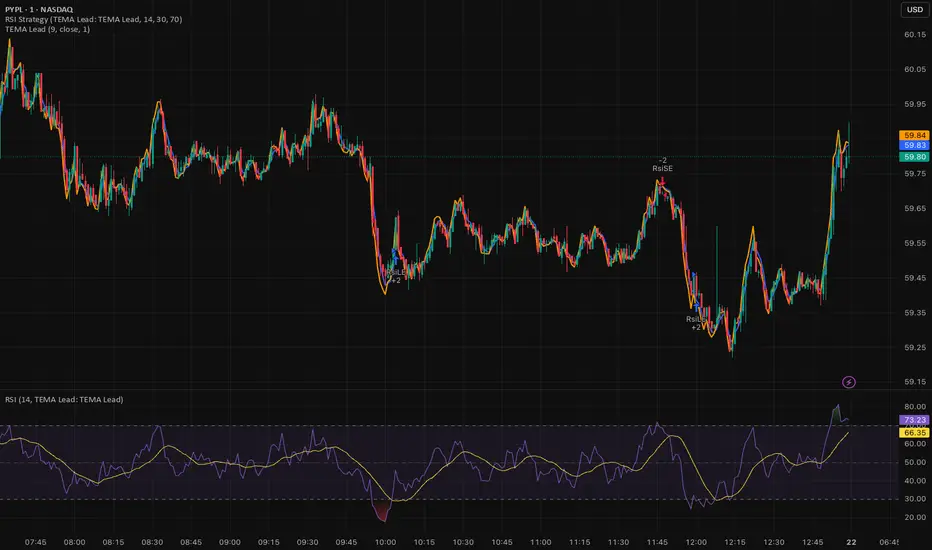
Triple EMA (TEMA) + Slope LeadThis indicator plots a standard Triple EMA (TEMA) and an optional slope-lead version. TEMA is a low-lag moving average built from three EMAs, allowing it to track price more closely than a single EMA. The Lead Strength (k) adds a small forward “push” based on the recent TEMA slope:
TEMA_lead = TEMA + k × (TEMA − TEMA ). Higher k values make the line react earlier but increase sensitivity in chop.
Used as a source for other indicators (RSI, MACD, stochastic, regime filters, etc.), TEMA or TEMA-Lead may improve signal quality by reducing noise, aligning momentum readings with trend direction, and producing earlier, cleaner transitions at turns, often without the excessive lag introduced by heavier smoothing.
RSI (Any Source) StrategyThis is a simple RSI crossover/crossunder strategy. It calculates RSI on a user-selected Source (default close) using the chosen Length (default 14). It enters a long when RSI crosses up through the Oversold level (default 30), and enters a short when RSI crosses down through the Overbought level (default 70). It does not include explicit exits—each new signal effectively flips/replaces the position via a new entry.

Least Squares Moving Average Zero Lag LeadLSMA Zero‑Lag + Lead Indicator
This indicator is a modified Least Squares Moving Average (LSMA) designed to reduce lag and optionally introduce a controlled forward‑leaning (lead) component. It is intended to be used either directly on price or as a smoother, more responsive input source for other indicators such as RSI, MACD, or regime filters.
1. What LSMA Is Doing
LSMA (Least Squares Moving Average) fits a straight‑line regression to the last N bars and evaluates that line at the current bar. Unlike simple or exponential averages, LSMA implicitly models trend direction and slope, which makes it more responsive during directional moves.
2. Zero‑Lag Adjustment
The zero‑lag version applies a simple error‑correction technique:
ZL = 2 × LSMA − LSMA(previous)
This cancels part of the inherent regression delay, producing a smoother line that reacts faster to turns while remaining stable in trends.
3. Lead Component (Optional)
On top of the zero‑lag LSMA, a slope‑based lead is added:
Lead = ZL + k × (ZL − ZL(previous))
Here, the recent slope is projected forward by a user‑controlled factor (k). This does not predict price, but it shifts the average slightly in the direction of current momentum, improving responsiveness for signal generation.
4. Why This Helps RSI and Similar Indicators
RSI and many oscillators operate on raw price changes, which can be noisy and lag‑prone. Feeding RSI with LSMA ZL or LSMA ZL + Lead instead of raw close price:
• Reduces noise without excessive smoothing
• Aligns RSI swings with underlying trend direction
• Improves timing of overbought/oversold transitions
• Reduces late signals after sharp reversals
In practice, this produces an RSI that reacts faster in trends but stays calmer in chop.
5. Practical Usage Tips
• Use LSMA ZL as a clean, low‑lag replacement for price in oscillators
• Add small lead values (0.5–1.0) only if earlier signals are needed
• Avoid high lead values in choppy markets
• Combine with regime or volatility filters for best results
This indicator is best thought of as a signal‑conditioning layer rather than a standalone trading system.

Gann Octave Pro - Angles & Time Cycles 🎯 Gann Octave Pro - Angles & Time Cycles
## Complete Gann Trading System - Price, Angles & Time in One Indicator
A professional-grade Gann analysis tool combining **Octave Price Levels**, **Gann Angles (1x1, 2x1, 1x2)**, and **Advanced Time Cycle Projections**. Perfect for traders seeking precision market timing through geometric confluence.
---
## 🌟 Key Features
### 📐 Octave Price Levels
- **5 Key Levels**: 0%, 25%, 50%, 75%, 100%
- **Color-Coded**: Green (support) → Blue (50% pivot) → Red (resistance) → Black (boundaries)
- **Dynamic Updates**: Auto-adjusts to swing structure
- **Trading Edge**: 50% level is the most powerful reversal zone
### 📏 Gann Angles
- **1x1 Angle** (Black) - Natural 45° trend line
- **2x1 Angle** (Red) - Steep acceleration zone
- **1x2 Angle** (Red) - Gradual support/resistance
- **Customizable Extension**: Fixed bars or % of swing length
### ⏰ Advanced Time Cycles
**Three Calculation Methods:**
1. **Angle-Level Confluence** ⭐ (Recommended)
- Calculates intersections of Gann angles with octave levels
- Most sophisticated timing system
- Based on price-time geometry
2. **Swing Duration** - Uses actual swing bar length
3. **Harmonic (Swing/8)** - Classic Gann harmonic division
**Cycle Visualization:**
- **Full Cycles** (Purple, solid) - Major turning points, labeled "◆ FC1 (176 bars) "
- **Sub-Cycles** (Blue, dotted) - Minor pivots, labeled "S1 "
- **Mid-Cycles** (Orange, dashed) - Half-cycle inflection points
- **Past Display**: Shows 4 complete past cycles for validation
- **Future Projection**: Projects 8 future cycles for anticipation
---
## 🎯 How to Use
### Quick Start
1. Apply to chart (works all timeframes/instruments)
2. Select period: Default 44 bars (adjust based on timeframe)
3. Choose cycle method: "Angle-Level Confluence" for best results
4. Observe past cycles to validate timing accuracy
### Trading Strategies
**Triple Confluence Setup** (Highest Probability)
- Price at octave level (especially 50%)
- Price touches Gann angle (1x1 most reliable)
- Time cycle arrives (full cycle preferred)
- **Entry**: On confluence | **Stop**: Below/above octave level | **Target**: Next level
**Cycle Anticipation**
- Enter 1-2 bars before cycle line if price at octave level
- Exit at next cycle or target octave level
- **Edge**: Anticipate cycles instead of reacting
**Angle Breakout + Cycle**
- Price breaks 1x1 angle + next cycle within 20 bars
- Hold through cycle, exit at 2x1 angle or next major level
---
## ⚙️ Customization
### Period Selection (88-Based)
11 harmonic options: 3, 6, 11, 22, **44**, 88, 176, 352, 704, 1408, 2816 bars
- **Intraday** (15m-1h): Period 3-4
- **Swing Trading** (4h-Daily): Period 4-5
- **Position Trading** (Daily-Weekly): Period 5-6
### Visual Controls
- **Colors**: Independent for all elements
- **Line Widths**: Separate controls (1-5) for levels, angles, cycles
- **Label Size**: Tiny/Small/Normal/Large (unified)
- **Label Position**: Top/Middle/Bottom
- **Show/Hide**: Toggle any component
### Alerts
- 50% octave level breakouts
- Customizable messages
---
## 💡 Pro Tips
1. **Validate First**: Observe 2-3 past cycles before trading
2. **Adjust to Volatility**: High volatility = lower period (22-44), Low = higher (88-176)
3. **Multiple Timeframes**: Apply on different timeframes for confirmation
4. **Respect 50% Level**: Most powerful reversal zone in Gann theory
5. **Focus on Full Cycles**: Highest probability setups (◆ FC markers)
6. **Combine with Price Action**: Indicator shows WHERE/WHEN, price action shows HOW
---
## 🚀 What Makes It Unique
✅ **Intelligent Confluence Cycles** - Unique angle-level intersection calculation
✅ **Historical Validation** - See past cycles to trust future projections
✅ **Professional Design** - Color-coded hierarchy, clean labels, no clutter
✅ **Complete Automation** - Everything updates in real-time
✅ **Three-Dimensional Analysis** - Price + Angles + Time = complete picture
---
## 📊 Best Markets
- Stock indices (S&P 500, NASDAQ, Dow)
- Forex majors (EUR/USD, GBP/USD, USD/JPY)
- Commodities (Gold, Silver, Oil)
- Crypto (BTC, ETH)
- Liquid stocks
✅ Complete Gann system (price + angles + time)
✅ 3 time cycle methods
✅ Auto swing detection
✅ 4 past + 8 future cycle projections
✅ Professional visualization
✅ Extensive customization
✅ Real-time alerts
✅ Works all markets/timeframes
---
## ⚠️ Disclaimer
This indicator is for educational purposes and applies W.D. Gann methodology principles. Not financial advice. Always use proper risk management, position sizing, and stop losses. Practice on paper before live trading. Past performance doesn't guarantee future results.
---
**The market moves in patterns of price and time. This indicator helps you see them.**
Trade with geometry. Trade with time. Trade with confidence.

Butterworth LPF Flip + AutoTune (PF)Butterworth LPF Flip + AutoTune (PF)
This strategy trades price trend flips using two Butterworth low-pass filters (a FAST filter and a SLOW filter). A trade is taken when the FAST filter crosses the SLOW filter. Optionally, the script can auto-tune the filter lengths by simulating many Fast/Slow combinations and selecting the pair with the best Profit Factor (PF).
What the Script Does
- Computes two 2‑pole Butterworth low‑pass filters on price.
- Enters LONG when FAST crosses above SLOW.
- Enters SHORT when FAST crosses below SLOW.
- Optionally simulates many Fast/Slow length combinations internally.
- Chooses the Fast/Slow pair with the highest Profit Factor.
- Trades only the selected best pair.
Manual Mode (Default)
1. Leave Auto‑Tune OFF.
2. Set:
- FAST cutoff period (bars)
- SLOW cutoff period (bars)
3. The strategy will trade using only these values.
Use this mode for normal trading or live deployment.
Auto‑Tune Mode
1. Enable Auto‑Tune.
2. Define Fast and Slow ranges:
- FAST min / max / step
- SLOW min / max / step
3. The script simulates ALL Fast × Slow combinations bar‑by‑bar.
4. Each combination tracks:
- Gross Profit
- Gross Loss
- Closed trades
- Profit Factor (PF = GP / GL)
5. At the end of the chart, the best PF pair is selected and used for trading.
Interpreting the End Box
The status label at the end of the chart reports:
- Whether Auto‑Tune is enabled
- Number of candidate pairs tested
- Best FAST period
- Best SLOW period
- Profit Factor of the best pair
- Win Rate (wins ÷ closed trades)
If PF is near 1.0 or trades are very low, expand the range or length of the test.
Best Practices
- Use Auto‑Tune ONLY for research and optimization.
- After finding good parameters, disable Auto‑Tune and trade manually.
- Keep Fast < Slow (logical separation).
- Longer charts produce more reliable PF results.
- Avoid very small step sizes (performance + noise).
Known Limitations
- Pine Script runs bar‑by‑bar; tuning is approximate, not vectorized.
- Large grids increase execution time.
- Results are historical and NOT predictive.
- Not suitable for live auto‑optimization.
Summary
This script is best viewed as a *research tool first, strategy second*. Use it to discover stable Fast/Slow regimes, then lock them in for simple, repeatable trading.
