Multi-RSI with Stochastic Oscillator - flack0xA sophisticated momentum analysis tool combining 4 customizable RSI oscillators with an innovative Close/Close Stochastic implementation. Designed for traders seeking comprehensive momentum insights across multiple timeframes in a single, organized indicator.
Key Features:
4 Independent RSI Oscillators with default periods: 2, 3, 9, 27
Innovative Close/Close Stochastic - Compares closing prices to closing price ranges (not high/low)
Complete Customization - Individual control over periods, colors, line widths, and visibility
Reference Levels - Customizable overbought (70), oversold (30), and midline (50) levels
Smart Alert System - Crossover notifications for key momentum shifts
Unique Close/Close Stochastic Methodology:
Unlike traditional Stochastic oscillators that use high/low ranges.
Benefits of Close/Close Approach:
Eliminates Gap Noise - Ignores overnight gaps and intraday wicks
Smoother Signals - Reduces whipsaws common in traditional Stochastic
Position-Relevant - Focuses on actual settlement prices traders care about
Cleaner Momentum Reading - Pure closing price momentum without intraday volatility
Oszillatoren

Hurst Momentum Oscillator | AlphaNattHurst Momentum Oscillator | AlphaNatt
An adaptive oscillator that combines the Hurst Exponent - which identifies whether markets are trending or mean-reverting - with momentum analysis to create signals that automatically adjust to market regime.
"The Hurst Exponent reveals a hidden truth: markets aren't always trending. This oscillator knows when to ride momentum and when to fade it."
━━━━━━━━━━━━━━━━━━━━━━━━━━━━━━━━━━━━━━━━
📐 THE MATHEMATICS
Hurst Exponent (H):
Measures the long-term memory of time series:
H > 0.5: Trending (persistent) behavior
H = 0.5: Random walk
H < 0.5: Mean-reverting behavior
Originally developed for analyzing Nile river flooding patterns, now used in:
Fractal market analysis
Network traffic prediction
Climate modeling
Financial markets
The Innovation:
This oscillator multiplies momentum by the Hurst coefficient:
When trending (H > 0.5): Momentum is amplified
When mean-reverting (H < 0.5): Momentum is reduced
Result: Adaptive signals based on market regime
━━━━━━━━━━━━━━━━━━━━━━━━━━━━━━━━━━━━━━━━
💎 KEY ADVANTAGES
Regime Adaptive: Automatically adjusts to trending vs ranging markets
False Signal Reduction: Reduces momentum signals in mean-reverting markets
Trend Amplification: Stronger signals when trends are persistent
Mathematical Edge: Based on fractal dimension analysis
No Repainting: All calculations on historical data
━━━━━━━━━━━━━━━━━━━━━━━━━━━━━━━━━━━━━━━━
📊 TRADING SIGNALS
Visual Interpretation:
Cyan zones: Bullish momentum in trending market
Magenta zones: Bearish momentum or mean reversion
Background tint: Blue = trending, Pink = mean-reverting
Gradient intensity: Signal strength
Trading Strategies:
1. Trend Following:
Trade momentum signals when background is blue (trending)
2. Mean Reversion:
Fade extreme readings when background is pink
3. Regime Transition:
Watch for background color changes as early warning
━━━━━━━━━━━━━━━━━━━━━━━━━━━━━━━━━━━━━━━━
🎯 OPTIMAL USAGE
Best Conditions:
Strong trending markets (crypto bull runs)
Clear ranging markets (forex sessions)
Regime transitions
Multi-timeframe analysis
Market Applications:
Crypto: Excellent for identifying trend persistence
Forex: Detects when pairs are ranging
Stocks: Identifies momentum stocks
Commodities: Catches persistent trends
━━━━━━━━━━━━━━━━━━━━━━━━━━━━━━━━━━━━━━━━
Developed by AlphaNatt | Fractal Market Analysis
Version: 1.0
Classification: Adaptive Regime Oscillator
Not financial advice. Always DYOR.

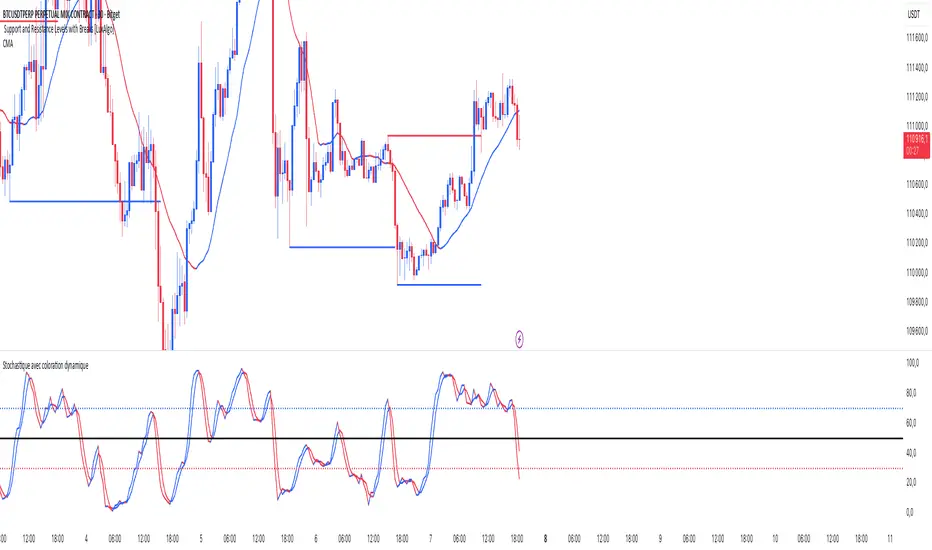
Stochastic ColorStochastic Color. A momentum indicator that compares a particular closing price of an asset to a range of its prices over a specific period of time. It helps identify overbought and oversold conditions in the market. The indicator ranges from 0 to 100, with readings above 80 typically considered overbought and readings below 20 considered oversold. It is often used to anticipate potential price reversals.
SMI Ergodic Oscillator ColorSMI Ergodic Oscillator Color. A variation of the True Strength Index (TSI), the SMI Ergodic Oscillator is a momentum indicator used to identify trend direction and potential reversals. It consists of a double-smoothed price momentum line and a signal line, helping traders spot buy and sell signals when the two lines cross. It is particularly useful for filtering out market noise and confirming the strength of a trend.
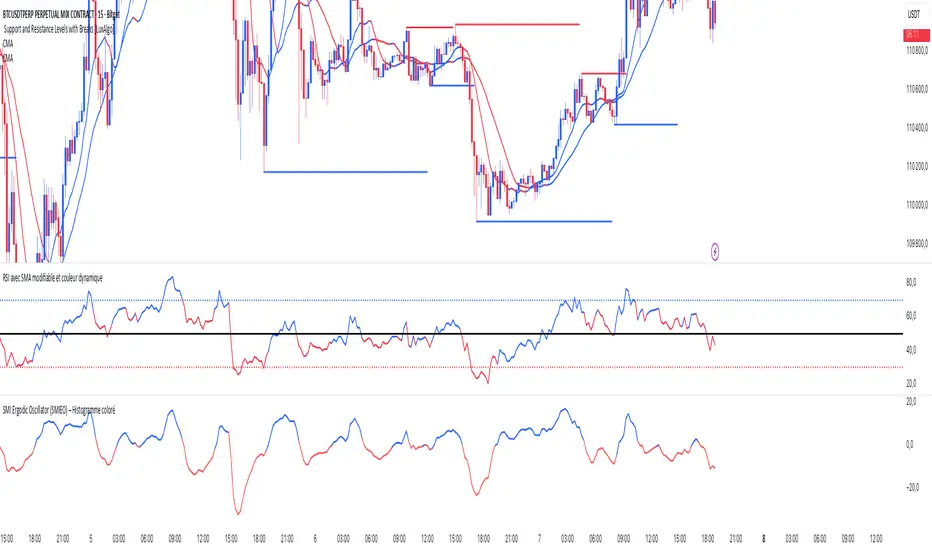
RSI SMA ColorRSI 14 with SMA 21 Color. A momentum oscillator that measures the speed and change of price movements. It ranges from 0 to 100 and is typically used to identify overbought or oversold conditions in a market. An RSI above 70 may indicate that an asset is overbought, while an RSI below 30 may suggest it is oversold.

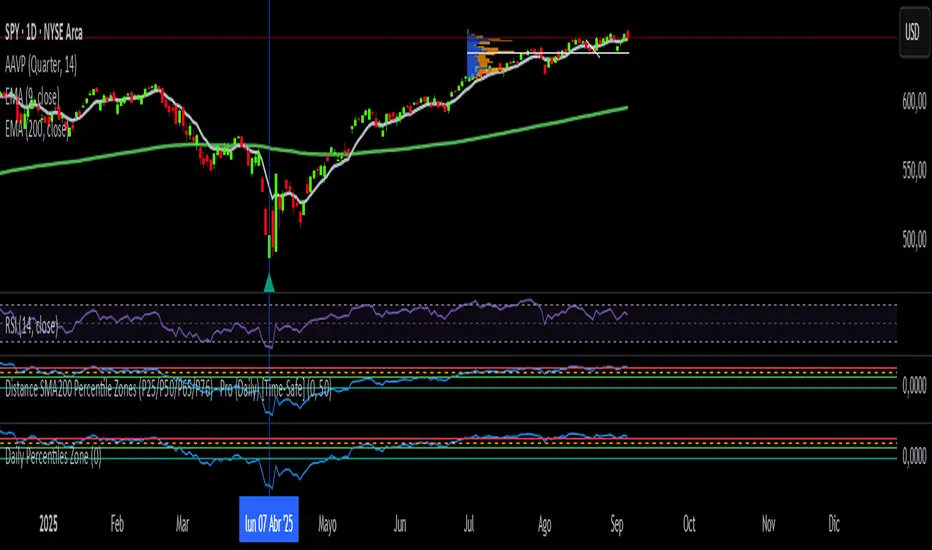
1H intraday Percentiles ZonesThe 1H intraday Percentiles Zones indicator measures the percentage distance between price and its 200-period EMA on the 1-hour timeframe. It classifies this distance into historical percentile zones (P25, P50, P65, P76), helping traders identify when the asset is cheap, fairly valued, overextended, or very expensive relative to its 1H trend.

Daily SMA200 Distance – Percentile Zones PROIndicator Description — Weekly/Daily SMA200 Distance – Percentile Zones
The SMA200 Distance – Percentile Zones indicator measures the percentage distance between the price and its 200-period Simple Moving Average (SMA200), and classifies it into historical percentile zones.
This tool helps traders and investors understand the market context of an asset relative to its long-term trend:
Cheap Zone (< P25): price at historically low levels compared to SMA200.
Value Zone (P25–P50): neutral range, where price trades around its long-term average.
Acceptable Zone (P50–P65): moderately high levels, still reasonable within an uptrend.
Not Recommended Zone (P65–P76): overextended territory, with increasing correction risk.
Very Expensive Zone (≥ P76): extreme levels, historically linked to overvaluation and potential market tops.
Percentiles are calculated dynamically from the entire historical dataset (since the SMA200 becomes available), providing a robust and objective statistical framework for decision-making.
✅ In summary:
This indicator works as a quantitative valuation map — showing whether the asset is cheap, fairly valued, acceptable, risky, or very expensive relative to its historical behavior against the SMA200.
RSI with KAMA and Custom Buy/Sell SignalsUses Kaufman MA on the RSI to generate signals when crossing user thresholds

EMA/SMA Zones 9, 21, 30, 50, 100, 200 + othersMeant for swing trading on the daily chart, feel free to copy and remove/add sections as you wish (Used chatGPT for a lot of it).

Kameniczki AI RSI Pro v2.0Kameniczki AI RSI Pro v2.0 is an advanced technical indicator based on RSI (Relative Strength Index) with artificial intelligence that provides comprehensive market analysis with emphasis on safety and signal reliability. The indicator combines traditional RSI calculations with modern AI technologies for detecting high-quality trading opportunities.
Key Features:
AI Signal Quality Assessment
- Automatic signal quality rating on 0-100% scale
- Strict filtering to prevent false signals
- Trend confirmation with "falling knife" protection
- Momentum filter for detecting strong trends
Multi-Timeframe Analysis
- RSI analysis across 5 timeframes (5M, 15M, 30M, 1H, 4H)
- Alignment score calculation for trend direction confirmation
- Configurable threshold for MTF alignment (50-90%)
Smart Money Detection
- Detection of smart money accumulation and distribution
- Volume vs. price analysis for institutional activity identification
- Smart money strength calculation (0-100%)
Anomaly Detection System
- Early warning system for market anomalies
- Monitoring of price, volume, and volatility anomalies
- 4 anomaly levels: NORMAL, MEDIUM, HIGH, CRITICAL
- Comprehensive anomaly scoring (0-100 points)
Volume-Weighted RSI
- Volume-weighted RSI calculations
- Adaptive RSI lengths based on volatility
- Three RSI variants: Fast (7), Medium (14), Slow (21)
RSI Divergence Detection
- Automatic bullish and bearish divergence detection
- 20-bar lookback period for accurate identification
- Integration with AI signal quality
Dashboard and Visualization
Information Dashboard
- **SIGNAL**: Main trading signal with percentage score
- **ANOMALY**: Market anomaly status with color coding
- **MTF**: Multi-timeframe alignment percentages
- **SMART MONEY**: Accumulation/distribution status
- **DIVERGENCE**: Current RSI divergences
Signal Types
- **STRONG BUY/SELL**: Highest quality with trend confirmation
- **BUY/SELL**: Normal signals with percentage score
- **NEUTRAL**: No clear direction
Visual Effects
- Glowing colors for high AI quality (90%+)
- Modern AI color schemes
- RSI momentum histogram
- Critical zones for extreme levels
Settings
RSI Core Settings
- Base RSI Length: 5-100 (default 14)
- Fast RSI Length: 3-21 (default 7)
- Slow RSI Length: 14-50 (default 21)
- RSI Source: Price source for calculations
AI Enhancement
- Enable AI Signal Quality: AI quality rating
- AI Quality Threshold: 30-95% (default 70%)
- Enable Smart Money Detection: Smart money detection
- Enable Volume Weighting: Volume weighting
Multi-Timeframe Analysis
- Enable MTF Analysis: Multi-timeframe analysis
- MTF Weight: 10-50% (default 30%)
- MTF Alignment Threshold: 50-90% (default 75%)
Visual Settings
- Enable Glowing Effects: Bright colors for high quality
- Line Width: 1-5 (default 2)
- Zone Transparency: 50-95% (default 80%)
- Dashboard Position: 6 positioning options
- Customizable signal colors
Alert Settings
- Enable Alerts: Main alerts
- Enable Divergence Alerts: Divergence alerts
- Enable Smart Money Alerts: Smart money alerts
Alert System
Main Alerts (AI Quality ≥ 85%)
- SUPER RSI STRONG BUY/SELL: Highest priority
- SUPER RSI BUY/SELL: Normal signals
- Price, RSI, trend, and stress level information
Specialized Alerts
- BULLISH/BEARISH DIVERGENCE: RSI divergences
- ANOMALY CRITICAL/HIGH: Market anomalies
- SMART MONEY ACCUMULATION/DISTRIBUTION: Smart money activity
- MTF ALIGNMENT: Multi-timeframe alignment
Technical Specifications
Calculation Methods
- Volume-weighted RSI with adaptive lengths
- ATR-based volatility analysis
- EMA trend confirmation (20, 50, 200)
- Stress level calculation (KAMENICZKI AI 1.5.5)
Safety Mechanisms
- Momentum filter against counter-trend trading
- Trend confirmation requirements
- Volume confirmation for extreme signals
- Falling knife protection
Performance Optimization
- Max bars back: 500
- Efficient global variables
- Optimized functions for speed
Usage
The indicator is designed for professional traders who need reliable and safe signals with emphasis on quality over quantity. It combines traditional technical analysis with modern AI technologies for maximum accuracy and risk minimization.

Scalping Oversold/Overbought (RSI + Stochastic + VWAP + MA50)scalping di time frame 1 minute
simple baiii
the moment cross first candle kita buy saja at
second candle
the moment cross below vwap or MA50 kita sell
saja bai , apa problem.
tak payah nak pening kepala dengan macam
teknik turtle soup la , fvg la macam2
ko scalping jer kan
TRAPPER TRENDLINES — RSIBuilds dynamic RSI trendlines by connecting the two most recent confirmed RSI swing points (highs→highs for resistance, lows→lows for support). Includes optional channel shading for the 30–70 zone, an RSI moving average, clean break alerts, and simple bullish/bearish divergence alerts versus price.
How it works
RSI pivots: A point on RSI is a swing high/low only if it is the most extreme value compared with a set number of bars on the left and the right (the Pivot Lookback).
RSI trendlines:
Resistance connects the last two confirmed RSI swing highs.
Support connects the last two confirmed RSI swing lows.
Lines can be Full Extend (update into the future) or Pivot Only.
Channel block: Optional fill of the 30–70 range for fast visual context.
Alerts:
Breaks of RSI support/resistance trendlines.
Basic bullish/bearish RSI divergences versus price pivots.
Inputs
RSI
RSI Length: Default 14 (standard).
Pivot Lookback: Bars to the left/right required to confirm an RSI swing.
Overbought / Oversold: 70 / 30 by default.
Line Extension: Full Extend or Pivot Only.
Visuals
Show RSI Moving Average / Signal Length: Optional smoothing line on RSI.
RSI/Signal colors: Customize plot colors.
Show 30–70 Channel Block: Toggle the middle-zone fill.
Tint pane background when RSI in channel: Optional subtle background when RSI is between OB/OS.
Divergences & Alerts
Enable RSI TL Break Alerts: Alert conditions for RSI line breaks.
Enable Divergence Alerts: Bullish/Bearish divergence alerts versus price.
Pairing with price for confluence/divergence
For accurate confluence and clearer divergences, align this RSI tool with your price trendline tool (for example, TRAPPER TRENDLINES — PRICE):
Set RSI Pivot Lookback equal to the Pivot Left/Right size used on price.
Example: Price uses Pivot Left = 50 and Pivot Right = 50 → set RSI Pivot Lookback = 50.
Keep RSI Length = 14 and OB/OS = 70/30 unless you have a specific edge.
Interpretation:
Confluence: Price reacts at its trendline while RSI reacts at its own line in the same direction.
Divergence: Price makes a higher high while RSI makes a lower high (bearish), or price makes a lower low while RSI makes a higher low (bullish), using matched pivot windows.
Suggested settings
Higher timeframes (4H / 1D / 1W): Pivot Lookback = 50; optional RSI MA length 14; channel block ON.
Intraday (15m / 30m / 1H): Pivot Lookback = 30; optional RSI MA length 14.
Always mirror your price pivot size to this RSI Pivot Lookback for consistent swings.
Reading the signals
RSI trendline touch/hold: Momentum reacting at structure; look for confluence with price levels.
RSI Trendline Break Up / Down: Momentum shift; consider price structure and retests.
Bullish/Bearish Divergence: Confirm only when pivots are matched and the new swing is confirmed.
Notes & limitations
Pivots require future bars to confirm by design; trendlines update as new swings confirm.
Divergence logic compares RSI pivots to price pivots with the same lookback; mismatched windows can produce false positives.
No strategy entries/exits or performance claims are provided. This is an analytical tool.
Alerts (titles/messages)
RSI: Trendline Break Up — “RSI broke falling resistance line.”
RSI: Trendline Break Down — “RSI broke rising support line.”
RSI: Bullish Divergence — “Bullish RSI divergence confirmed.”
RSI: Bearish Divergence — “Bearish RSI divergence confirmed.”
Quick start
Add the indicator to a separate pane.
Set Pivot Lookback to match your price tool’s pivot size (e.g., 50).
Optionally toggle the RSI MA and Channel Block for clarity.
Enable alerts if you want notifications on RSI line breaks and divergences.
Use with TRAPPER TRENDLINES — PRICE or any price-based trendline tool for confluence/divergence analysis.
Compliance
This script is for educational purposes only and does not constitute financial advice. Trading involves risk. Past performance does not guarantee future results. No performance claims are made.

Simplified Market ForecastSimplified Market Forecast Indicator
This indicator pairs nicely with the Contrarian 100 MA and can be located here:
Overview
The "Simplified Market Forecast" (SMF) indicator is a streamlined technical analysis tool designed for traders to identify potential buy and sell opportunities based on a momentum-based oscillator. By analyzing price movements relative to a defined lookback period, SMF generates clear buy and sell signals when the oscillator crosses customizable threshold levels. This indicator is versatile, suitable for various markets (e.g., forex, stocks, cryptocurrencies), and optimized for daily timeframes, though it can be adapted to other timeframes with proper testing. Its intuitive design and visual cues make it accessible for both novice and experienced traders.
How It Works
The SMF indicator calculates a momentum oscillator based on the price’s position within a specified range over a user-defined lookback period. It then smooths this value to reduce noise and plots the result as a line in a separate lower pane. Buy and sell signals are generated when the smoothed oscillator crosses above a user-defined buy level or below a user-defined sell level, respectively. These signals are visualized as triangles either on the main chart or in the lower pane, with a table displaying the current ticker and oscillator value for quick reference.
Key Components
Momentum Oscillator: The indicator measures the price’s position relative to the highest high and lowest low over a specified period, normalized to a 0–100 scale.
Signal Generation: Buy signals occur when the oscillator crosses above the buy level (default: 15), indicating potential oversold conditions. Sell signals occur when the oscillator crosses below the sell level (default: 85), suggesting potential overbought conditions.
Visual Aids: The indicator includes customizable horizontal lines for buy and sell levels, shaded zones for clarity, and a table showing the ticker and current oscillator value.
Mathematical Concepts
Oscillator Calculation: The indicator uses the following formula to compute the raw oscillator value:
c1I = close - lowest(low, medLen)
c2I = highest(high, medLen) - lowest(low, medLen)
fastK_I = (c1I / c2I) * 100
The result is smoothed using a 5-period Simple Moving Average (SMA) to produce the final oscillator value (inter).
Signal Logic:
A buy signal is triggered when the smoothed oscillator crosses above the buy level (ta.crossover(inter, buyLevel)).
A sell signal is triggered when the smoothed oscillator crosses below the sell level (ta.crossunder(inter, sellLevel)).
Entry and Exit Rules
Buy Signal (Blue Triangle): Triggered when the oscillator crosses above the buy level (default: 15), indicating a potential oversold condition and a buying opportunity. The signal appears as a blue triangle either below the price bar (if plotted on the main chart) or at the bottom of the lower pane.
Sell Signal (White Triangle): Triggered when the oscillator crosses below the sell level (default: 85), indicating a potential overbought condition and a selling opportunity. The signal appears as a white triangle either above the price bar (if plotted on the main chart) or at the top of the lower pane.
Exit Rules: Traders can exit positions when an opposite signal occurs (e.g., exit a buy on a sell signal) or based on additional technical analysis tools (e.g., support/resistance, trendlines). Always apply proper risk management.
Recommended Usage
The SMF indicator is optimized for the daily timeframe but can be adapted to other timeframes (e.g., 1H, 4H) with careful testing. It performs best in markets with clear momentum shifts, such as trending or range-bound conditions. Traders should:
Backtest the indicator on their chosen asset and timeframe to validate signal reliability.
Combine with other indicators (e.g., moving averages, support/resistance) or price action for confirmation.
Adjust the lookback period and buy/sell levels to suit market volatility and trading style.
Customization Options
Intermediate Length: Adjust the lookback period for the oscillator calculation (default: 31 bars).
Buy/Sell Levels: Customize the threshold levels for buy (default: 15) and sell (default: 85) signals.
Colors: Modify the colors of the oscillator line, buy/sell signals, and threshold lines.
Signal Display: Toggle whether signals appear on the main chart or in the lower pane.
Visual Aids: The indicator includes dotted horizontal lines at the buy (green) and sell (red) levels, with shaded zones between 0–buy level (green) and sell level–100 (red) for clarity.
Ticker Table: A table in the top-right corner displays the current ticker and oscillator value (in percentage), with customizable colors.
Why Use This Indicator?
The "Simplified Market Forecast" indicator provides a straightforward, momentum-based approach to identifying potential reversals in overbought or oversold markets. Its clear signals, customizable settings, and visual aids make it easy to integrate into various trading strategies. Whether you’re a swing trader or a day trader, SMF offers a reliable tool to enhance decision-making and improve market timing.
Tips for Users
Test the indicator thoroughly on your chosen asset and timeframe to optimize settings.
Use in conjunction with other technical tools for stronger trade confirmation.
Adjust the buy and sell levels based on market conditions (e.g., lower levels for less volatile markets).
Monitor the ticker table for real-time oscillator values to gauge market momentum.
Happy trading with the Simplified Market Forecast indicator!

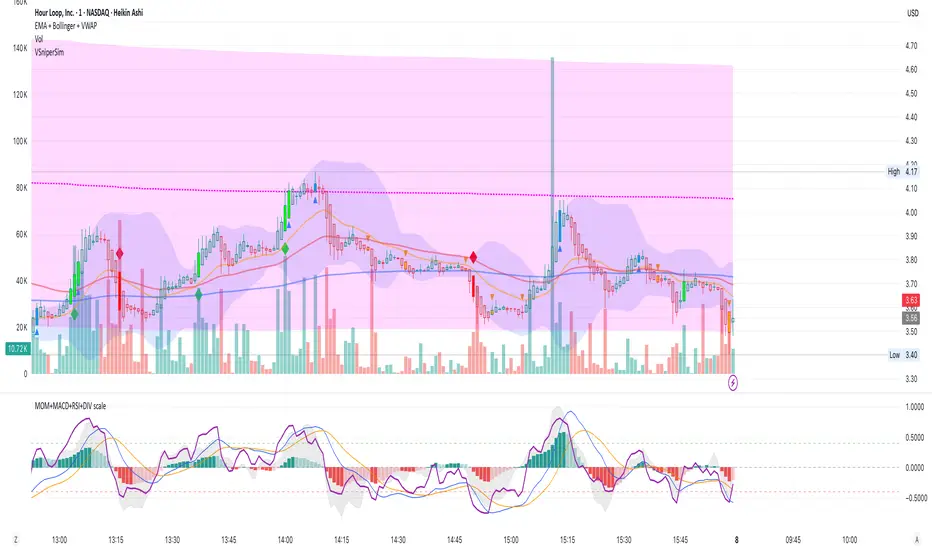
MOM + MACD + RSI + DIV bySaMAll indicators in ONE
MOMENTUM
MACD
RSI
DIVERGENCE
All in one scaled for perfect market watching
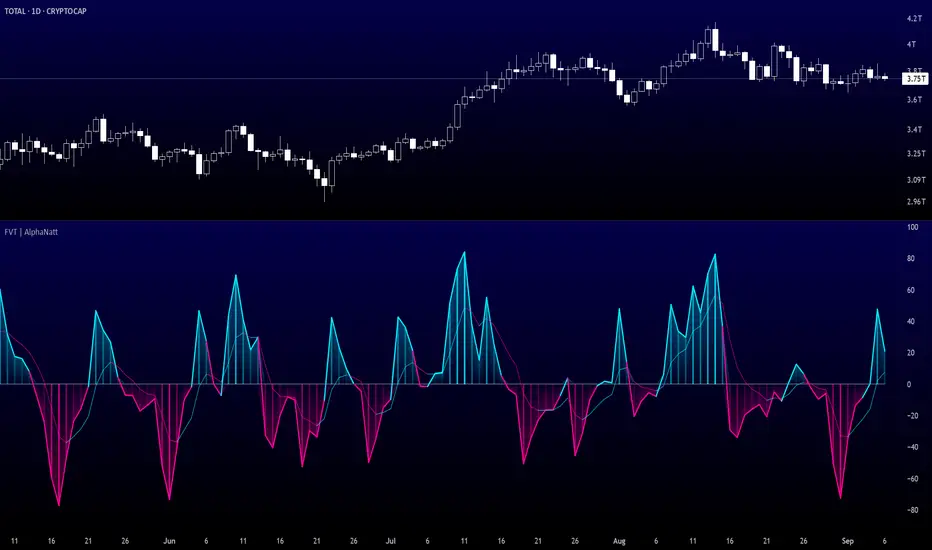
Fisher Volume Transform | AlphaNattFisher Volume Transform | AlphaNatt
A powerful oscillator that applies the Fisher Transform - converting price into a Gaussian normal distribution - while incorporating volume weighting to identify high-probability reversal points with institutional participation.
"The Fisher Transform reveals what statistics professors have known for decades: when you transform market data into a normal distribution, turning points become crystal clear."
━━━━━━━━━━━━━━━━━━━━━━━━━━━━━━━━━━━━━━━━
🎲 THE MATHEMATICS
Fisher Transform Formula:
The Fisher Transform converts any bounded dataset into a Gaussian distribution:
y = 0.5 × ln((1 + x) / (1 - x))
Where x is normalized price (-1 to 1 range)
Why This Matters:
Market extremes become statistically identifiable
Turning points are amplified and clarified
Removes the skew from price distributions
Creates nearly instantaneous signals at reversals
Volume Integration:
Unlike standard Fisher Transform, this version weights price by relative volume:
High volume moves get more weight
Low volume moves get filtered out
Identifies institutional participation
Reduces false signals from retail chop
━━━━━━━━━━━━━━━━━━━━━━━━━━━━━━━━━━━━━━━━
💎 KEY ADVANTAGES
Statistical Edge: Transforms price into normal distribution where extremes are mathematically defined
Volume Confirmation: Only signals with volume support
Early Reversal Detection: Fisher Transform amplifies turning points
Clean Signals: Gaussian distribution reduces noise
No Lag: Mathematical transformation, not averaging
━━━━━━━━━━━━━━━━━━━━━━━━━━━━━━━━━━━━━━━━
⚙️ SETTINGS OPTIMIZATION
Fisher Period (5-30):
5-9: Very sensitive, many signals
10: Default - balanced sensitivity
15-20: Moderate smoothing
25-30: Major reversals only
Volume Weight (0.1-1.0):
0.1-0.3: Minimal volume influence
0.5-0.7: Balanced price/volume
0.7: Default - strong volume weight
0.8-1.0: Volume dominant
━━━━━━━━━━━━━━━━━━━━━━━━━━━━━━━━━━━━━━━━
📊 TRADING SIGNALS
Primary Signals:
Zero Cross Up: Bullish momentum shift
Zero Cross Down: Bearish momentum shift
Signal Line Cross: Early reversal warning
Extreme Readings (±75): Potential reversal zones
Visual Interpretation:
Cyan zones: Bullish momentum
Magenta zones: Bearish momentum
Gradient intensity: Strength of move
Histogram: Raw momentum power
━━━━━━━━━━━━━━━━━━━━━━━━━━━━━━━━━━━━━━━━
🎯 OPTIMAL USAGE
Best Market Conditions:
Range-bound markets (reversals clear)
High volume periods
Major support/resistance levels
Divergence hunting
Trading Strategies:
1. Extreme Reversal:
Enter when oscillator exceeds ±75 and reverses
2. Zero Line Momentum:
Trade crosses of zero line with volume confirmation
3. Signal Line Strategy:
Early entry on signal line crosses
4. Divergence Trading:
Price makes new high/low but Fisher doesn't
━━━━━━━━━━━━━━━━━━━━━━━━━━━━━━━━━━━━━━━━
Developed by AlphaNatt | Quantitative Trading Systems
Version: 1.0
Classification: Statistical Transform Oscillator
Not financial advice. Always DYOR.
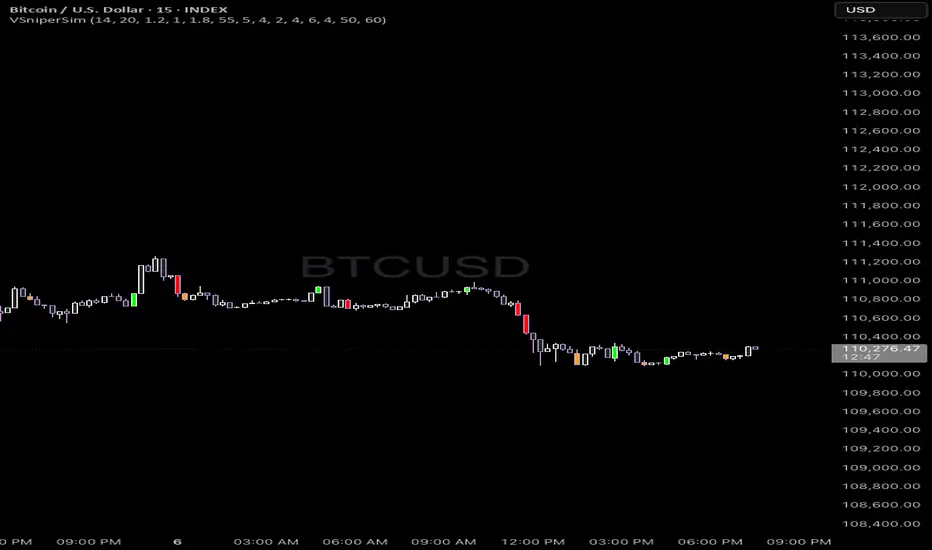
Vector Sniper Pro What it is
Vector Sniper (Simplified) is a single, original algorithm that flags impulsive “vector” moves only when volatility, volume, and structure align. It is not a mashup of other indicators; everything below is computed from raw OHLCV with a small, transparent ruleset.
⸻
Core idea (signal = force × participation × context)
1. Force (Volatility):
• We z-score true range: trZ = (ATR(1) - SMA(ATR(1), N)) / StDev(ATR(1), N).
• A move must exceed a user-set Volatility Z-Score.
2. Participation (Volume):
• We z-score raw volume: volZ = (Vol - SMA(Vol, N)) / StDev(Vol, N).
• Volume must also exceed a Volume Z-Score.
3. Context (Structure, Body, Imbalance, Traps):
• Body% filter: real body / range ≥ Min Body %.
• Delta-volume proxy: (bullVol − bearVol) / volume, where bullVol = volume*(close−low)/range and bearVol = volume*(high−close)/range. We require positive imbalance for bulls, negative for bears.
• Structure break (optional): price must take out the prior N-bar high/low.
• Trap detection (optional): spring/upthrust patterns defined by lower-low/upper-high followed by a close back inside.
If the above align, you get a Bull Vector (green) or Bear Vector (red). “Extreme” vectors require the same conditions at a higher multiple (Ext Mult).
⸻
Noise control (pre-signal gate)
Before a vector is allowed, a pre-signal score (0–7) must pass:
• Checks include spring/upthrust, no-supply/no-demand, imbalance, volume > average, VWAP side alignment, EMA trend alignment, proximity to structure break, and candle direction.
• You choose a minimum score, persistence (must occur ≥N times inside last M bars), cooldown after a pass, and hysteresis vs the opposite side.
This prevents one-off blips and keeps signals directional.
⸻
Optional confluence
• VWAP alignment: require price on the correct side and VWAP slope with it.
• EMA filter: require EMA trend agreement.
• HTF bias (optional): compare HTF close vs HTF EMA on a selected timeframe.
• Implemented with request.security and no look-ahead; bias updates when the higher timeframe bar closes.
⸻
Visuals & alerts
• Candle colors (5 total):
• Green = Bull Vector, Red = Bear Vector.
• Blue = Pre-Bull, Orange = Pre-Bear.
• Gray = Neutral.
• Markers (optional): diamonds = “Extreme” vectors; small triangles = pre-signals.
• Built-in alerts: Bull Vector, Bear Vector, Extreme Bull/Bear, Pre-Bull, Pre-Bear.
• Add from: Alerts → Condition → this script → choose event.
⸻
How to use (practical)
1. Start with defaults. Turn on VWAP and EMA filters; add HTF bias if you want fewer but cleaner signals.
2. Hunt for alignment: Pre-signal (blue/orange) → Vector (green/red) in the same direction.
3. Use your own risk model for entries/exits; the script does not place orders or compute stops/targets.
⸻
Inputs (plain English)
• ATR/Volume Periods & Z-Scores: sensitivity to volatility/participation.
• Extreme Multiplier: threshold for “Extreme” vectors.
• Structure Break (bars) & Traps: contextual confirms.
• Pre-signal gate: Min Score, Persistence (N in last M), Cooldown, Opposite-side lockout.
• Confluence: VWAP side, EMA trend, optional HTF bias (timeframe + EMA length).
• Visuals: candle painting and markers.
⸻
Design notes / limitations
• Signals evaluate on bar close. Intrabar they can form and cancel; for consistency, trade on closed bars.
• HTF bias is derived from closed HTF bars; no future data is used.
• This is an indicator, not financial advice. Backtest forward and manage risk.
⸻
Why this isn’t a “mashup”:
All components are purposeful and documented: z-score volatility + z-score volume (force & participation), body% and delta-volume (quality), structure & traps (context), and a scored, persistent pre-filter with VWAP/EMA/HTF alignment (noise control).