Market Sessions & LevelsOverview
This Pine Script indicator identifies key trading levels and market sessions, making it easier for traders to analyze price movements. It highlights the previous day's high and low, tracks premarket price action, and marks the first 5-minute high and low after the market opens.
Features
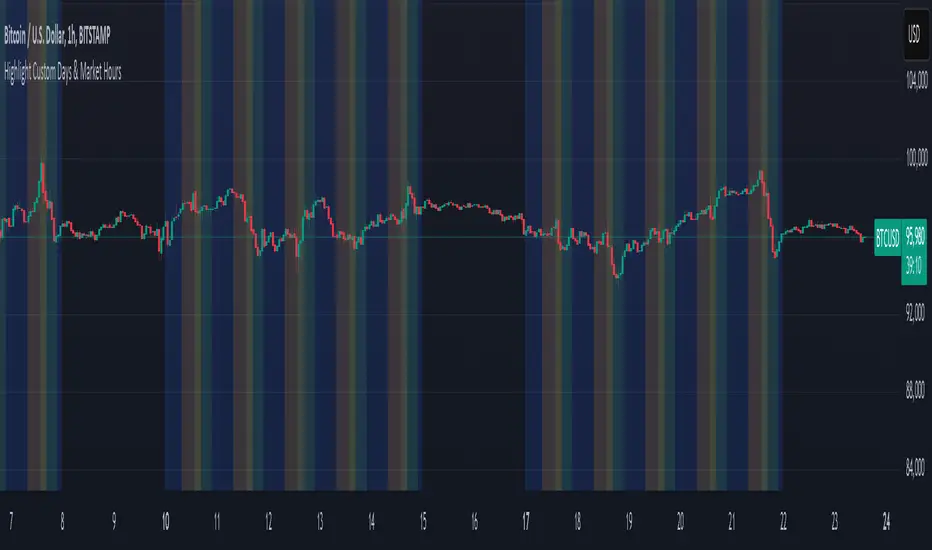
✅ Identifies Market Sessions:
Pre-Market Session (4:30 AM - 9:30 AM EST)
Regular Market Session (9:30 AM - 4:00 PM EST)
✅ Tracks Key Levels:
Previous Day’s High & Low
Premarket High & Low
First 5-Minute High & Low after market open
✅ Visual Cues for Easy Analysis:
Plots horizontal lines for each level with distinct colors
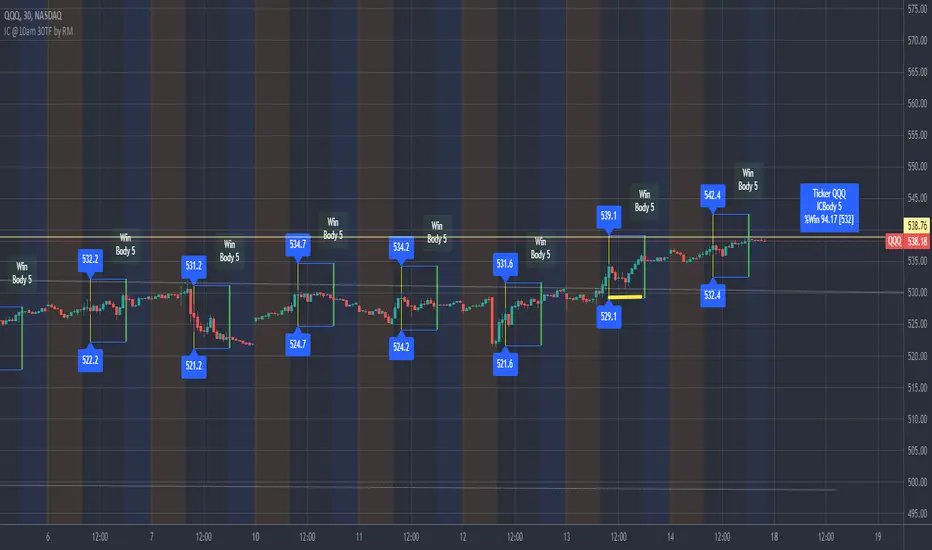
Displays labels for key price levels on the chart
How It Helps Traders
📊 Pre-Market Preparation: Helps traders spot key resistance/support levels before the market opens.
🚀 Momentum Trading: The first 5-minute high/low can act as breakout or reversal zones.
📉 Historical Price Context: Uses the previous day's high/low to gauge market sentiment.
Customization
The script can be easily modified to adjust session timings, colors, or additional levels based on your trading strategy.
💡 How to Use:
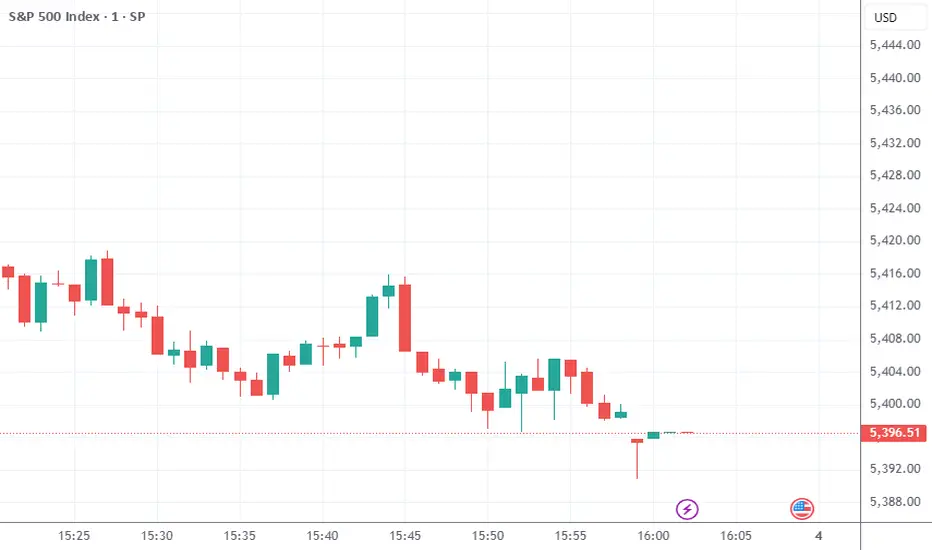
Apply the script to a 1-minute or 5-minute chart for the most accurate premarket and first 5-minute tracking.
Look for price reactions at the plotted levels to determine potential trade setups.
Pine Script® Indikator