Total Futures Volume & Open Interest (Aggregated Curve)Description
Most futures indicators only look at the front contract, but that often tells an incomplete — and sometimes misleading — story.
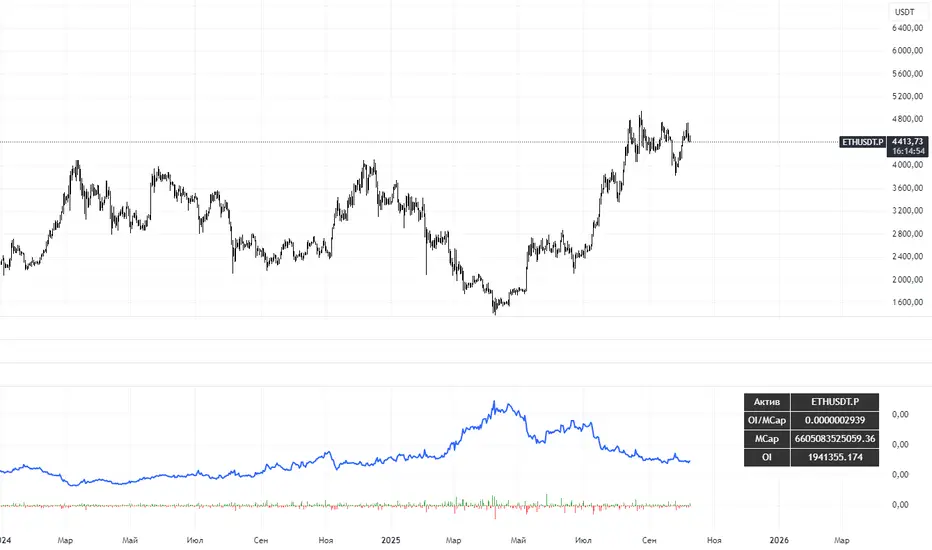
This indicator solves that problem by aggregating Volume and Open Interest across the entire futures curve, not just the nearest expiry.
Instead of focusing on a single contract, the script automatically scans up to 40 futures contracts ahead (roughly one year forward) for the same underlying root symbol and sums their data into a single, unified series.
🔍 Why this matters
Open Interest is about commitment, not just activity.
A drop in front-month OI can simply mean rolls, not liquidation
Rising total OI confirms new money entering the market, not just contract switching
Divergences between price and aggregated OI often signal positioning stress, exhaustion, or regime shifts
By looking at total participation across all maturities, you get a much cleaner view of:
Real capital inflows vs. mechanical rolls
Structural positioning changes
Whether volatility is driven by speculation or true exposure changes
This is especially useful during high-volatility phases, contract roll periods, and major macro moves, where front-month data alone can be deceptive.
⚙️ How it works
Automatically iterates through the last 40 futures contracts of the same root symbol starting from ~1 year ahead expiry.
Aggregates: Total Open Interest and Total Volume
Lets you choose what to display directly from the indicator settings
Fully dynamic — no manual symbol selection, no roll management
The result is a continuous, roll-agnostic view of futures participation.
🧠 How to use it
Confirm breakouts with rising aggregated OI
Detect false moves when price expands but total OI contracts
Analyze post-spike behavior to see whether moves were driven by forced liquidation or fresh positioning
Compare volatility spikes against true market engagement
Pine Script® Indikator