Ehlers Signal To Noise Ratio [CC]The Signal To Noise Ratio was created by John Ehlers (Rocket Science For Traders pgs 81-82) and this indicator is perfect for all of the scalpers out there! This will let you know when the stock is at a high volatility or not and when to buy or sell. If the indicator crosses over the dotted line then that means the stock is volatile and it is trading flat then it will be below the dotted line. Buy when the indicator line is green and sell when it is red.
This was a custom request so let me know if there are any other scripts you would like me to publish or if you want something custom done!
Noise

[LunaOwl] 11 kinds of Adaptive MA Model作品: 11種自適應性平滑模型
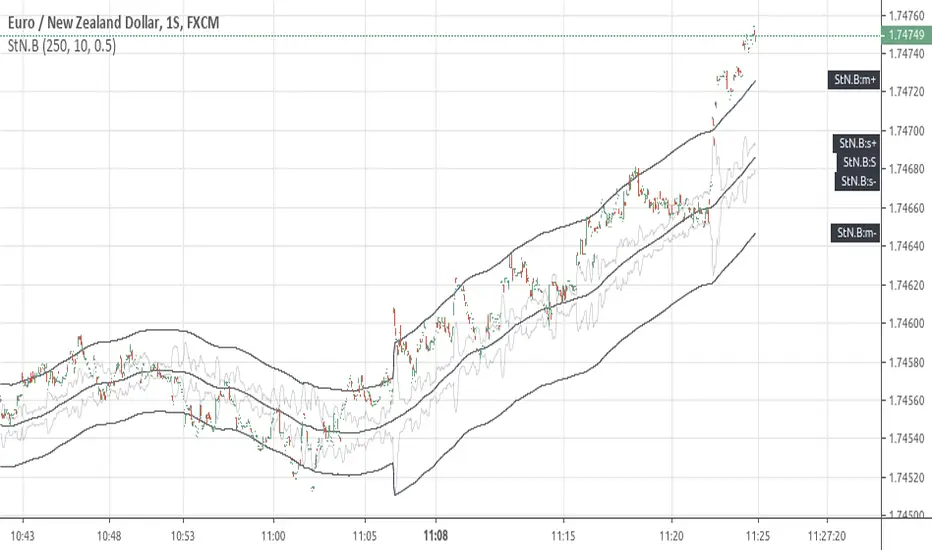
It integrates eleven kinds of adaptive moving average method. At first, I just wanted to make a ATR. Later, the price series ±N*ATR mult, to form two series. Then use the concept of support/resistance breakthrough to design it, and then two adaptive series formation channels were formed. Take the average of the two series as the signal. When the price crosses the signal, it's judged to be long or short.
整合了十一種能夠自適應性的移動平均模型。起初只是想要做一個基本款ATR指標,後來將價格加減N個ATR倍數,形成兩條序列形成通道,再使用支撐阻力突破的概念去設計它,再形成兩條自適應性的序列形成通道,再取中間值當成信號。當價格與信號交叉,則判斷作多或者作空。
--------------------------*
Parameter 設置參數
Resolution: The default is "the same as the variety". Is a named constant for resolution input type of input function.
商品分辨率:預設與品種相同。是input函數的時間周期輸入類型的命名常量。
Smoothing: The default is Recursive Moving Average(RMA). It can choose other methods, the table is as follows.
平滑類型:預設是「遞回平均」,可以選擇其它方法,列表如下。
列表 / The table of moving averages is as follows:
//****中英對照表*****##______________________________________
1. 遞回平均 || Recursive Moving Average
2. 簡單平均 || Simple Moving Average
3. 指數平均 || Exponential Moving Average
4. 加權平均 || Weighted Moving Average
5. 船體平均 || Hull Moving Average
6. 成交量加權 || Volume Weighted Moving Average
7. 對稱加權 || Symmetric Weighted Moving Average
8. 雙重指數 || Double Exponential Moving Average
9. 三重指數 || Triple Exponential Moving Average
10. 高斯分佈 || Arnaud Legoux Moving Average
11. 提爾森T3 || Tillson T3 Moving Average
//##_________________________________________________________
Candle Mode: There are three versions, original, two-color and four-color.
燭台模式:預設模式只區分趨勢,可以改成原版蠟燭或四種顏色版本。
Length: The default is 14, usually no need to adjust.
平滑期數:預設值是14,基本上不用理它。
Occurrence: The default is 1. The range is 0~10. The larger the value, the more delayed. If zero will become too sensitive and noise.
滯後性:預設值是1。調整範圍是0~10,數值愈大信號愈延遲,如果值為0,會變得過於敏捷,那將會失去平滑的意義。
N multiple: The default is 0.618, can be set to 1. The range is 0.382~3.000.
倍數N:預設值是0.618,也可以設定1,最低是0.382,最大是3。
--------------------------*
1. Candle Mode can set the original candle, cancel candle trend color changes. However, the background will still be filled.
可以設定顯示原版的蠟燭線,背景與線並不會消失。
2. Four-color version of candles. It shows changes in trends and prices.
四色版本的蠟燭線,可以顯示趨勢與每日收盤價的變化。

[LunaOwl] 智慧型RSI (Smart RSI - a handy tool with less noise)Relative Strength Index is a common technical analysis tool, it is classified as a momentum oscillator, measuring the velocity and magnitude of directional price movements. it is most typically used on a 14-period timeframe, measured on a scale from 0 to 100, with high and low levels marked at 70 and 30.
相對強弱指標是常見的技術分析工具,它被歸類為動量振盪器,用於測量定向價格運動的速度和幅度,通常會使用14期數,擺盪範圍在0到100間,超買超賣分別標記成70、30。
after simple improvement and addition of logical judgment, it becomes a passive judge from subjective judgments, avoid the shortcomings of peoples in watching passivation, and the trade can be more consistent.
經過簡單的改良與添加邏輯判斷,能夠使RSI指標的使用,從主觀的判斷成為被動的確認指標,有效避免人們判斷指標鈍化的主觀缺失,並能夠使得交易更加一致。
--------------------------*
1) parameter
RSI period 1 - default is 14, same as general RSI.
RSI period 2 - default is 5, due to its own formula, the amplitude of the oscillator will become larger and more agile or fast. When the parameter is small.
exponential moving avg of RSI - using the result of RSI period 1 as the source of Ema's formula, the default length is 14, which can filter the excessive agility of RSI period 2 to reduce noise, and compared to using the baseline as the criterion for long and short judgments, The characteristics of exponential moving avg are more suitable to become flexible filtering standards.
Overbought - default is 70, you can set your overbought level.
Oversold - same as above, the default is 30.
2) Options
Open Candle color(開啟蠟燭線趨勢) - choose whether to start the color of the candle.
Open background color(開啟指標背景色) - the default is false, you can turn on.
--------------------------*
1. 設置參數
RSI期數1:預設值是14,是普通的RSI指標。
RSI期數2:預設值是5,由於RSI公式的算法,造成參數愈小擺盪幅度就會變大,反應比較快。
指數平均化的RSI期數1:將RSI期數1的結果帶入指數移動平均公式,預設值14,它能過濾RSI期數2過度敏捷的缺點,減少雜訊,相較於單純使用基準線作為多空判斷標準,用EMA的判斷標準更加因時制宜。
超買線:預設值是70,可以隨意調。
超賣線:預設值是30,一樣的。
2. 設定選項
開啟蠟燭線趨勢:顧名思義。已經幫您開好了。
開啟指標背景色:顏色太淺的話可以調深一點。
--------------------------*
ver.2- adjust new style design and create two options.
修改2: 調整新的樣式設計與建立兩個選項。
--------------------------*
ver.3- Create alert condition. maybe I should refer to the Alert Creation Framework,
there is also room for improvement.
修改3: 建立快訊選項。我應該參考警報創建框架,還有進步空間。
--------------------------*
Indicator Style - 指標樣式
The design uses casual light color style, light gray between overbought and oversold.
--------------------------*
Market Example - 市場範例
1. Bitcoin/Tether, Binance, 1 day
2. Bitcoin/USD, Coinbase, 4 hour
3. EUR/USD, Forex Market, 4 hour
4. GBP/USD, Forex Market, 30 min
5. TAIEX, Taiwan SE Weighted Index, 1 week
--------------------------*
postscript - 後記感想
The purpose of publishing Chinese Scripts is to make Pine close to more Chinese user.
I hope English skills enhancement...staggered writing makes me feel hard.
發布中文腳本的目的,是希望可以讓 Pine 親近更多中文圈的使用者。希望我的英語進步,中英文交錯撰寫有一些困難。
--------------------------*
If you find my works useful, you can give me encouragement. I can buy more books to sophisticated themselves.
如果您發現我的作品有用,可以給我鼓勵。讓我可以買更多書籍來精進自己。

Sequential Filter - An Original Filtering ApproachRemoving irregular variations in the closing price remain a major task in technical analysis, indicators used to this end mostly include moving averages and other kind of low-pass filters. Understanding what kind of variations we want to remove is important, irregular (noisy) variations have mostly a short term period, fully removing them can be complicated if the filter is not properly selected, for example we might want to fully remove variations with a period of 2 bars and lower, if we select an arithmetic moving average the filter output might still contain such variations because of the ripples in the frequency response passband, all it would take is a variation of high amplitude for that variation to be clearly visible.
Although all it would take for better filtering is a filter with better performance in the frequency domain (gaussian, Butterworth, Bessel...) we can design innovative approaches that does not rely on the model of classical moving averages, today a new technical indicator is proposed, the technical indicator fully remove variations lower than the selected period.
The Indicator Approach
In order for the indicator output to change the closing price need to produce length consecutive up's/down's, length control the variation threshold of the indicator, variations lower than length are fully removed. Lets see a visual example :
Here length = 3, the closing price need to make 3 consecutive up's/down's, when the sequence happen the indicator output is equal to src , here the closing price, else the indicator is equal to its precedent value, hence removing other variations. The value of 3 is the value by default, this is because i have seen in the past that the average smallest variations period where in general of 3 bars.
Because the indicator focus only on the variation sign, it totally ignore the amplitude of the movement, this provide an effective way to filter short term retracement in a fluctuation as show'n below :
The candle option of the indicator allow the indicator to only focus on the body color of a candle, thus ignoring potential gaps, below is an example with the candle option off :
If we activate the "candle" option we end up with :
Note that the candle option is based on the closing and opening price, if you use the indicator on another indicator output make sure to have the candle option off.
Length and Indicator Color
The closing price is infected by noise, and will rarely make a large sequence of consecutive up's/down's, the indicator can therefore be useful to detect consecutive sequence of length period, here 6 is selected on BTCUSD :
A consecutive up's/down's of period 6 can be considered a relatively rare event.
It is important to note that the color of the indicator used by default has nothing to do with the consecutive sequence detected, that is the indicator turning red doesn't necessarily mean that a consecutive down's sequence has occurred, but only that this sequence has occurred at a lower value than the precedent detected sequence. This is show'n below :
In order to make the indicator color based on the detected sequence check the "Color Based On Detected Sequence" option.
Conclusion
An original approach on filtering price variations has been proposed, i believe the indicator code is elegant as well as relatively efficient, and since high values of length can't really be used the indicator execution speed will remain relatively fast.
Thanks for reading !

RSI + EMA+ MTF Stop-LossThis is a simple RSI with multiple MTF (No security) to help with direction short and long-term.
The rsi for the current chart has a noise reduction, while the rest are based on ma's.
I have supplied an extra flexible mtf rsi ma for potential adjustable/long-term stop-loss or direction identification.
Enjoy

[RS]Signal to Noise BandsEXPERIMENTAL:
Bands using Signal to Noise Calculation.
The bands calculation is similar to bolingers in the aspect that both use standard deviation.
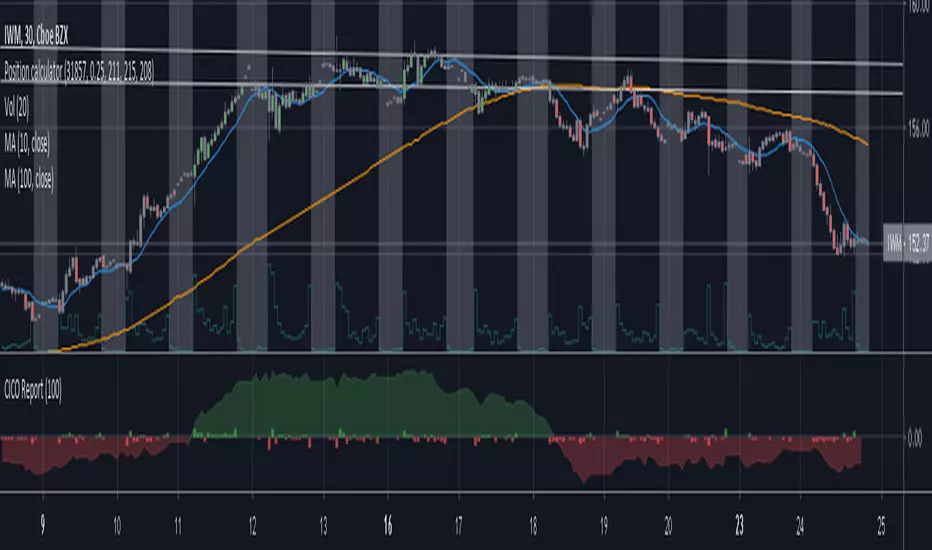
Cash in/Cash out Report (CICO) - Quiets market noiseThe cash in/cash out report (CICO for short) was built with the intent to quiet the market noise. The blunt way to say it, this indicator quiets the market manipulators voice and helps the retail investor make more money. I believe money is better of in the 99% hands versus the greedy hoarding that is currently going on. There are dozens of companies in the SP500 that have the same tax rate as unborn babies, nada. These hoarders also have machine learning high frequency trading bots that purposely create fear and anxiety in the markets. When all of the major markets move at the exact same time of day on frequent occasions, I see red flags. I recommend looking into Authorized participants in the ETF market to understand how the markets can be manipulated, specifically Creation and Redemption.
Enough of my rant. This indicator is open source. Directions on how to use the indicator can be found within the code. The basic summary is, clear your charts to bare minimums. Make the colors gray on all candles. Then apply this indicator. The indicator will color the "buy" and "sell" signals on the chart. Keep in mind, markets are manipulated to create fear in the retail investors little heart and can change drastically at any second. This indicator will show real time changes in running sum into and out of the market, it is estimated by average prices and not exact.
Once the chart is all greyed out and the indicator is applied you will see an area colored red and green. What this indicator does is takes a running sum of the new money into and out of the market. It takes the average of the high and low price times the volume. If the price is going up the value is positive, going down will be negative. Then the running sum is displayed. The area section is the running sum and the column bars are each value. When a market is steadily increasing in value you will see the large green area grow. When markets shift, values and display will change in color and vector. Full descriptions are available within the script in the comment sections.
I hope this help you make more money. If this helps you grow profits, give it a like!
Happy investing 99%er!
Motion Smoothness Index Introduction
Its holiday time for me, i have been working here a lot. But no leaving before publishing. Telling when market price is smooth or rough is not the easiest task, so today i present a trend metric indicator that allow you to give you this kind of information.
The Indicator
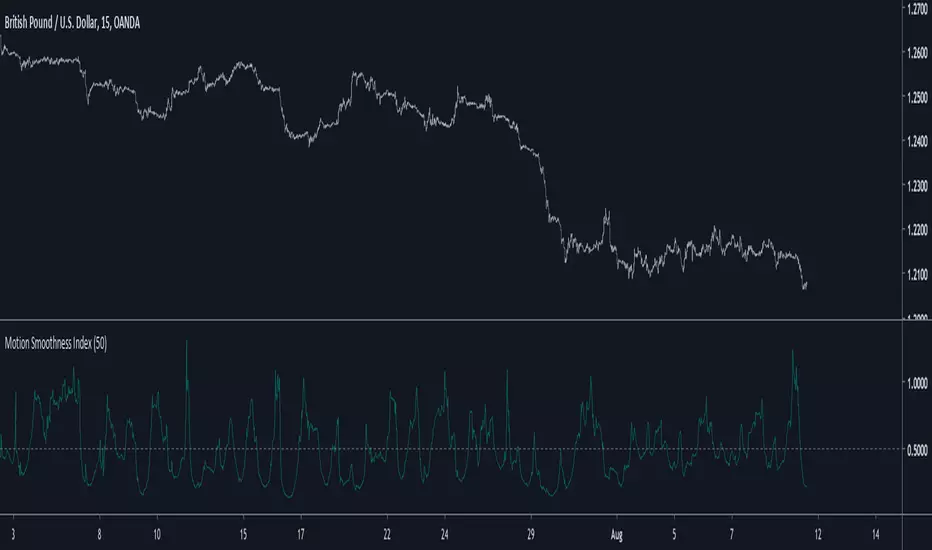
The indicator is in an approximate range of (0,1) with mean x̄ decaying for higher length's, when the indicator is below 0.5 the market is smooth, else rough, this is the simple interpretation. The indicator is simply the ratio of the price residual standard deviation and the price standard deviation.
Higher value of length will make the indicator less accurate when it comes to detect rough market price, you can still use the indicator direction or its running mean to give you insights but 0.5 is still the recommended detection threshold.
In More Depth
Even tho market is random by nature there can still be structures in the price (cycles and trends), the fractional BM model will tell you that market price is sometimes auto-correlated (trending) or non auto-correlated (ranging), knowing what is the current market state is therefore important, when price is rough it can means an excess in noise thus exhibiting an uncorrelated market at the contrary of a smoother price that can allow for auto-correlation.
Now, market is infected by noise, and thats really unfortunate but the noise posses various properties that can allow for all the structures we see in market price. So thinking about the market allowing for possible profits during auto-correlated states is encouraging.
Conclusion
Although the indicator measure smoothness/roughness it can still be interpreted as a trend/range state detector. I hope it provide to be useful.
I wish you all good holidays and see you next time ! Thanks for reading !
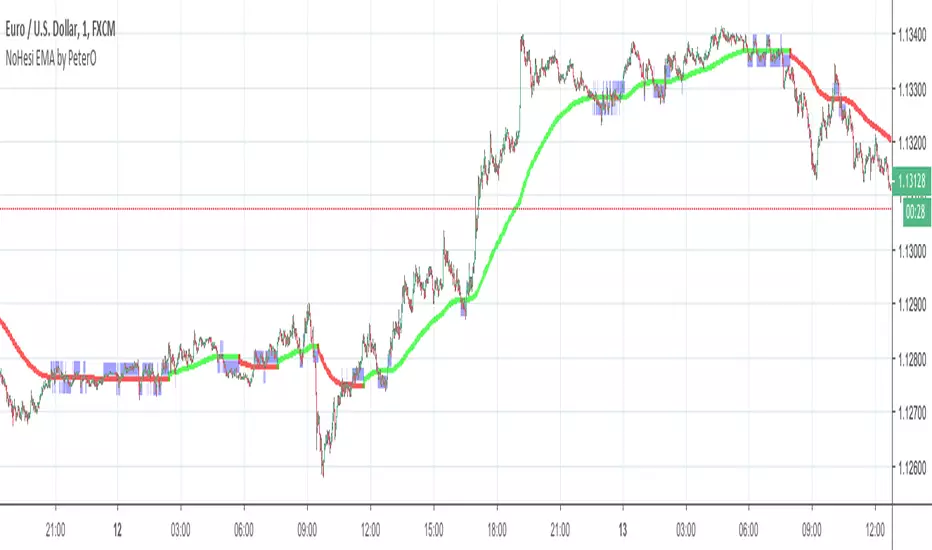
EMA NoHesi - cutting noise in EMA and any other data seriesNoise is common issue in variety of indicators. NoHesi is my take on reducing this noise.
Moving Averages are great indicators to show and maintain the trend. But sometimes - especially in pullback areas, smooth reversal zones or flat markets - MAs suggest trend changes, while it would be best for them to stay quiet :)
NoHesi function smoothens this noise, without adding unnecessary delay. NoHesi will make MA stay in the same direction as long as the move is not significant. If significant - MAs will report trend-change instantly.
Check the chart for illustration - NoHesi EMA keeps showing the same direction, despite its numerous attempts to change it (marked blue).
NoHesi can be applied to any data series: MAs, RSI , ADX , etc. EMA seemed like the most obvious example, so I used it for this presentation.
Hope it helps in your research!
P.S. When applying this to EMAs in other markets/timeframes, you will need to adjust "hesitation" parameter.
Signal to Noise Ratio [SNR]Intro
This script measures the Signal to Noise ratio of a security and plots it in deciBels scale!
Usage
Ideally, you would want the ratio to be above 10 dB, meaning the Signal strength is 10x the noise strength.
As a baseline, you should not rely on indicators that use any kind of moving average if the SNR is below 6 dB - meaning Signal strength is only 4x noise strength.
I've written the SNR as a functional block so you may simply copy and paste, then call getSNR() to get the ratio in dB.
Principle
I consider a bar's High and Low to be the range of that period and (High + Low)/2 to be the "real" value of the signal.
This script compares a bars range (noise) to the perceived signal using a Hilbert Transform.
Cheers,
DasanC

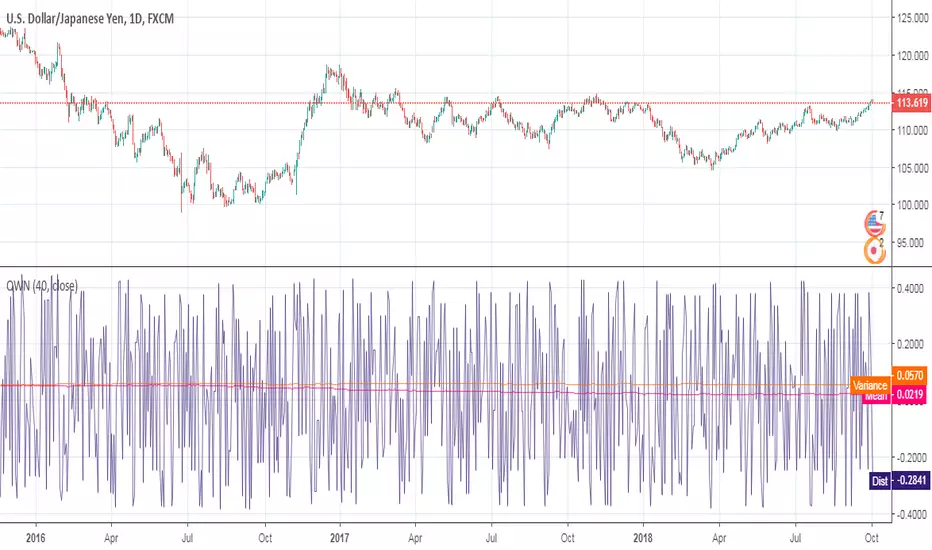
[RESEARCH] Quasi White NoiseQuasi White Noise script.
An experimental approach to implement a white noise using Pine Script. Uses Connors RSI under the hood.
en.wikipedia.org