MVRV Ratio Indicator [captainua]MVRV Ratio Indicator - Market Value to Realized Value Ratio
Overview
This professional indicator calculates and visualizes the MVRV (Market Value to Realized Value) ratio (raw, non-Z-score) with optional MVRV-Z overlay, comparing current market capitalization to realized capitalization to help identify potential market tops and bottoms for cryptocurrency markets.
Unlike MVRV-Z which normalizes the ratio using standard deviation (creating a Z-score), the raw MVRV ratio provides direct comparison between market cap and realized cap. This indicator enhances the raw ratio with historical percentile bands, percentile rank calculation, divergence detection, historical event logging, dynamic color gradients, enhanced visualization options, optional MVRV-Z comparison, and NEW advanced metrics including Risk Score, MVRV Momentum, Time in Zone tracking, and Price Target calculations.
NEW Features in This Version:
• Risk Score (0-100): Composite indicator based on MVRV level and percentile rank for instant risk assessment
• MVRV Momentum: Rate of change indicator showing trend direction (↑ Increasing, ↓ Decreasing, → Flat)
• Time in Zone: Tracks how long MVRV has been in the current zone (top/bottom/neutral) in bars
• Price Targets: Calculates price levels at key MVRV thresholds (fair value, top, bottom)
• Input Validation: Warns about invalid parameter combinations (e.g., extreme thresholds out of order)
• Multiple Smoothing Options: SMA, EMA, WMA, RMA for noise reduction
• Performance Optimized: Cached request.security() calls, ta.percentrank() for efficiency
• Human-Readable Timestamps: Event log now shows dates (YYYY-MM-DD) instead of bar indices
Core Calculations
MVRV Ratio Calculation:
The script calculates MVRV ratio using the standard formula: MVRV Ratio = Market Cap / Realized Cap. This formula provides a direct ratio without normalization, showing how many times the current market cap exceeds (or falls below) the realized cap.
Market Capitalization (Market Cap): The total market value of all coins in circulation, calculated as current price × circulating supply. This represents the market's current valuation of the asset.
Realized Capitalization (Realized Cap): The sum of the value of each coin when it last moved on-chain, representing the average cost basis of all coins.
Raw Ratio Interpretation:
- Ratio > 3.5: Extreme overvaluation (market cap significantly above realized cap)
- Ratio 2.5-3.5: Moderate overvaluation
- Ratio 1.0-2.5: Fair value to moderate overvaluation
- Ratio 0.8-1.0: Fair value to moderate undervaluation
- Ratio < 0.8: Undervaluation (market cap close to or below realized cap)
Risk Score (NEW):
Composite risk indicator ranging from 0-100:
- 80-100: Very High Risk (extreme overvaluation)
- 60-80: High Risk (overvaluation)
- 40-60: Moderate Risk (fair value range)
- 20-40: Low Risk (undervaluation)
- 0-20: Very Low Risk (extreme undervaluation)
The risk score uses percentile rank when available, or normalizes MVRV ratio to the 0-100 scale based on configured thresholds.
MVRV Momentum (NEW):
Rate of change indicator showing trend direction:
- ↑ Increasing: MVRV ratio rising (momentum > 0.01)
- ↓ Decreasing: MVRV ratio falling (momentum < -0.01)
- → Flat: MVRV ratio stable
- Displays percentage change over configurable period (default: 14 bars)
Time in Zone (NEW):
Tracks duration in current zone:
- Top Zone: Bars spent above top threshold (3.5)
- Bottom Zone: Bars spent below bottom threshold (0.8)
- Neutral Zone: Bars spent between thresholds
- Resets when zone changes
- Helps identify prolonged extreme conditions
Price Targets (NEW):
Calculates price levels at key MVRV thresholds:
- Price @ Fair Value: Price when MVRV = 1.0
- Price @ Top Threshold: Price when MVRV = 3.5
- Price @ Bottom Threshold: Price when MVRV = 0.8
- Based on estimated realized price (current price / MVRV ratio)
Data Source Selection:
The indicator supports multiple data source options for maximum flexibility:
Glassnode (Recommended):
- Uses Glassnode Market Cap data
- Calculates MVRV from Market Cap / Realized Cap
- Symbol format: GLASSNODE:{TOKEN}_MARKETCAP
- Requires Glassnode data subscription
- Also requires CoinMetrics for Realized Cap
- Best for comprehensive analysis with MVRV-Z comparison
IntoTheBlock:
- Direct MVRV ratio data from IntoTheBlock
- Simplest option - no calculations required
- Works for BTC and other supported tokens
- Symbol format: INTOTHEBLOCK:{TOKEN}_MVRV
- Requires IntoTheBlock data subscription on TradingView
Historical Percentile Bands:
The indicator calculates rolling percentile bands over a configurable period (default: 500 bars):
- 5th Percentile: Very low historical values (extreme undervaluation range)
- 25th Percentile: Lower quartile (undervaluation range)
- 50th Percentile: Median (fair value center)
- 75th Percentile: Upper quartile (overvaluation range)
- 95th Percentile: Very high historical values (extreme overvaluation range)
Percentile bands use ta.percentile_nearest_rank() for efficient calculation.
Percentile Rank:
Percentile rank shows where the current MVRV ratio sits in the historical distribution (0-100%):
- 0-25%: Bottom quartile (undervaluation)
- 25-50%: Lower half (moderate undervaluation to fair value)
- 50-75%: Upper half (fair value to moderate overvaluation)
- 75-100%: Top quartile (overvaluation)
Now uses efficient ta.percentrank() instead of array-based calculation.
Input Validation (NEW):
The indicator validates input parameters and displays warnings for:
- Extreme High Threshold should be > Top Threshold
- Extreme Low Threshold should be < Bottom Threshold
- Min Lookback Range must be < Max Lookback Range
- Top Threshold should be > Moderate Overvalued
- Moderate Overvalued should be > Fair Value
- Fair Value should be > Bottom Threshold
- Rapid Increase Threshold should be > 0
- Rapid Decrease Threshold should be < 0
Smoothing Options (Enhanced):
Multiple smoothing types available:
- SMA: Simple Moving Average (equal weight)
- EMA: Exponential Moving Average (more weight to recent)
- WMA: Weighted Moving Average (linear weight)
- RMA: Running Moving Average (Wilder's smoothing)
Reference Levels
Overvalued (Potential Top) - 3.5:
The 3.5 level indicates potentially extreme overvaluation. When MVRV ratio exceeds this threshold:
- Market cap is significantly above realized cap
- Potential selling opportunities for profit-taking
- Risk of market corrections or reversals
- Risk Score typically >80 (Very High Risk)
Moderately Overvalued - 2.5:
The 2.5 level indicates moderate overvaluation:
- Market cap is above realized cap but not extreme
- Caution warranted but not necessarily sell signal
- Risk Score typically 60-80 (High Risk)
Fair Value - 1.0:
The 1.0 level indicates fair valuation:
- Market cap equals realized cap
- Balanced market conditions
- Risk Score typically 40-60 (Moderate Risk)
Undervalued (Potential Bottom) - 0.8:
The 0.8 level indicates potentially undervalued conditions:
- Market cap is close to or below realized cap
- Potential buying opportunities for accumulation
- Risk Score typically <40 (Low Risk)
Visual Features
MVRV Ratio Line:
The main indicator line displays the calculated MVRV ratio with dynamic color gradient:
- Bright Red: Extreme overvaluation (ratio ≥ top threshold + 0.5)
- Orange: High overvaluation (ratio ≥ top threshold)
- Cornflower Blue: Neutral/Fair value (around fair value level)
- Deep Sky Blue: Low/Undervaluation (ratio ≤ bottom threshold)
- Bright Green: Extreme undervaluation (ratio ≤ bottom threshold - 0.1)
Can also be displayed as histogram/bar chart.
Historical Percentile Bands:
Five percentile bands with optional fills:
- 5th Percentile (Blue): Very low historical range
- 25th Percentile (Blue): Lower quartile
- 50th Percentile (Gray): Historical median
- 75th Percentile (Orange): Upper quartile
- 95th Percentile (Red): Very high historical range
Reference Lines:
Horizontal reference lines at key levels (all customizable):
- Top Threshold (default 3.5): Purple/violet
- Moderate Overvalued (default 2.5): Orange
- Fair Value (1.0): Gray
- Bottom Threshold (default 0.8): Blue
Background Highlights:
Optional background color highlights:
- High Zone (Maroon/Red): MVRV ratio ≥ top threshold
- Low Zone (Green): MVRV ratio ≤ bottom threshold
Divergence Detection:
Advanced divergence detection between price and MVRV ratio:
- Regular Bullish Divergence: Price lower low + MVRV higher low
- Regular Bearish Divergence: Price higher high + MVRV lower high
- Hidden Bullish Divergence: Price higher low + MVRV lower low
- Hidden Bearish Divergence: Price lower high + MVRV higher high
- Visual markers with icons (🐂/🐻) and connecting lines
Historical Event Log (Enhanced):
Comprehensive event tracking:
- Tracks zone entries/exits, extreme values, cross events
- Now displays human-readable dates (YYYY-MM-DD) instead of bar indices
- Color-coded events (red for top/high, green for bottom/low)
- Configurable log size (5-50 events)
Information Table (Enhanced):
Comprehensive on-chart table with NEW metrics:
Current Values:
- MVRV Ratio: Current ratio value
- Percentile Rank: Position in historical distribution (0-100%)
- Risk Score (NEW): Composite risk indicator (0-100) with risk level
- Market Status: Current market condition
- Signal: Trading signal (Strong Buy/Buy/Hold/Sell/Strong Sell)
- MVRV Momentum (NEW): Trend direction with percentage change
- Time in Zone (NEW): Current zone and duration in bars
Price Information (Enhanced):
- Current Price: Current market price
- Est. Realized Price: Estimated realized price
- Price @ Fair Value (NEW): Price when MVRV = 1.0
- Price @ Top Threshold (NEW): Price when MVRV = 3.5
- Price @ Bottom Threshold (NEW): Price when MVRV = 0.8
Other Metrics:
- Percentile Bands: Range from 5th to 95th percentile
- MVRV-Z Score: Z-score value (when comparison enabled)
- Change (1D/1W/1M): Ratio change over timeframes
- To Top/Bottom: Percentage distance to key levels
- Historical Range: Percentage below ATH / above ATL
- 30D Volatility: Standard deviation
Historical Event Log:
- Recent events with dates and values
- Color-coded for quick identification
Alert System
Comprehensive alerting capabilities:
Zone Alerts:
- Top Zone Entry/Exit
- Bottom Zone Entry/Exit
Cross Alerts:
- Cross Above/Below Top Threshold
- Cross Above/Below Fair Value (1.0)
Extreme Value Alerts:
- Extreme High (configurable, default: 4.5)
- Extreme Low (configurable, default: 0.7)
Rate of Change Alerts:
- Rapid Increase/Decrease
Divergence Alerts:
- Bullish/Bearish Divergence
- Hidden Bullish/Bearish Divergence
All alerts support cooldown to prevent spam.
Usage Instructions
Getting Started:
1. Select data source (Glassnode recommended)
2. Enable Risk Score for composite risk assessment (0-100)
3. Enable MVRV Momentum to track trend direction
4. Enable Time in Zone to see zone duration
5. Enable Price Targets to see price levels at key thresholds
6. Use weekly timeframe for cleaner signals
Risk-Based Position Sizing:
Use Risk Score to guide position sizing:
- Risk Score >80 (Very High Risk): Reduce/exit positions
- Risk Score 60-80 (High Risk): Smaller positions, caution
- Risk Score 40-60 (Moderate Risk): Normal positions
- Risk Score 20-40 (Low Risk): Larger positions opportunity
- Risk Score <20 (Very Low Risk): Strong accumulation zone
Momentum-Based Analysis:
Use MVRV Momentum for trend confirmation:
- ↑ Increasing + High MVRV: Late bull market, caution
- ↑ Increasing + Low MVRV: Recovery phase, bullish
- ↓ Decreasing + High MVRV: Distribution, potential top
- ↓ Decreasing + Low MVRV: Capitulation, accumulation opportunity
Zone Duration Analysis:
Use Time in Zone for context:
- Extended time in Top Zone: Late cycle, increased reversal risk
- Extended time in Bottom Zone: Accumulation opportunity
- Quick zone transitions: Higher volatility regime
Price Target Usage:
Use Price Targets for planning:
- Price @ Fair Value: Natural equilibrium level
- Price @ Top Threshold: Potential distribution target
- Price @ Bottom Threshold: Potential accumulation target
Technical Specifications
- Pine Script Version: v6
- Indicator Type: Non-overlay (displays in separate panel)
- Repainting Behavior: Minimal - calculations based on confirmed bar data
- Performance: Optimized with cached request.security() calls and ta.percentrank()
- Input Validation: Validates parameter combinations with warnings
- Compatibility: Works on all timeframes (data sources provide daily resolution)
- Edge Case Handling: Zero-division protection, NA value handling, boundary checks
Performance Optimizations:
- Cached request.security() calls for Market Cap, Realized Cap, and IntoTheBlock data
- Efficient ta.percentrank() replaces array-based percentile calculation
- Consolidated duplicate code (color functions, state tracking)
- Single-line ternary expressions for Pine Script compatibility
Constants:
- MAX_HISTORY_BARS = 5000 (TradingView's limit)
- PERCENTILE_EXTREME_HIGH = 90.0
- PERCENTILE_HIGH = 75.0
- PERCENTILE_MID = 50.0
- PERCENTILE_LOW = 25.0
- MIN_PERCENTILE_SAMPLES = 10
- DEFAULT_VOLATILITY_HIGH = 0.1
Known Limitations
- Data availability: Requires valid data subscription (IntoTheBlock, Glassnode, or CoinMetrics)
- Token support: Works with tokens supported by the selected data source
- Historical data: Percentile calculations require sufficient history (200+ bars recommended)
- Timeframe: Always uses daily resolution data from providers; works on all chart timeframes
- History limit: All lookback periods capped at 5000 bars
Changelog
Latest Version:
- Added Risk Score (0-100) composite indicator
- Added MVRV Momentum with trend direction
- Added Time in Zone tracking
- Added Price Target calculations
- Added Input Validation with warnings
- Added multiple smoothing options (SMA, EMA, WMA, RMA)
- Improved performance with cached security calls
- Replaced array-based percentile with ta.percentrank()
- Human-readable timestamps in event log (YYYY-MM-DD)
- Fixed hline() conditional value bug
- Consolidated duplicate code
- Updated indicator name for clarity
For detailed usage instructions, see the script comments.
Mvrvratio

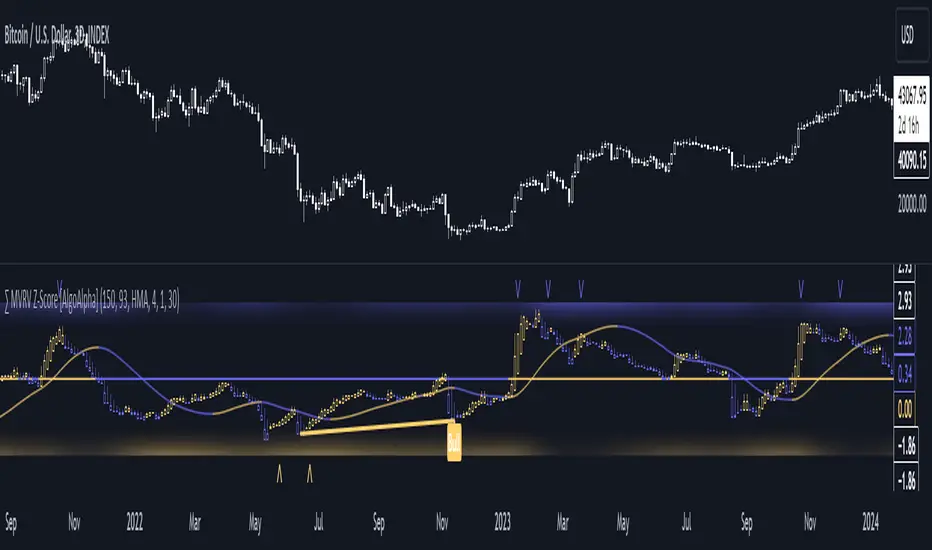
MVRV Z-Score [AlgoAlpha]Introducing the ∑ MVRV Z-Score by AlgoAlpha, a dynamic and sophisticated tool designed for traders seeking to gain an edge in INDEX:BTCUSD analysis. This script employs advanced statistical techniques on Bitcoin On-Chain data to offer a deeper understanding of market conditions, focusing on valuation extremes and momentum trends. Let's explore the features and functionalities that make this tool a valuable addition to your trading arsenal.
Key Features:
🔶 Adjustable Parameters: Customize the Z score lookback length, moving average lookback length, and choose from six moving average types, tailoring the analysis to your trading style.
🔶 Heiken Ashi Compatibility: Incorporate Heiken Ashi plots to visualize market trends, adding a layer of clarity to your technical analysis.
🔶 Divergence Alerts: Detect significant bullish and bearish divergences, allowing for timely identification of potential market reversals.
🔶 Configurable Alerts: Set alerts for overbought, oversold, and divergence conditions, ensuring you never miss an opportunity.
How to Use:
1. ➡️ Parameter Selection: Start by configuring the Z-Score and moving average settings according to your analysis needs. This includes selecting the lookback period and the type of moving average.
2. ➡️ Visualization Options: Choose to enable Heiken Ashi plots for an alternative view of the Z-Score, which can help in identifying trend directions more clearly.
3. ➡️ Monitor for Signals: Keep an eye out for divergence signals and overbought/oversold conditions as potential indicators for entering or exiting trades.
4. ➡️ Alert Setup: Configure alerts based on your selected parameters to receive notifications for important market movements and conditions.
How It Works:
The core of this tool is the Z-Score calculation, which assesses the standard deviation of the current market value from its mean, highlighting overvalued or undervalued market conditions. Here's a brief overview of the script's operational mechanics:
1. 📊 Calculating the Z-Score: The script first calculates the mean over a user-defined lookback period of the MVRV ratio, then it computes the Z-Score to identify deviations from the average.
meanValue = ta.sma(marketValue, zScoreLookback)
zScoreValue = (marketValue - meanValue) / ta.stdev(marketValue, zScoreLookback)
2. 📈 Applying a Moving Average: To smooth the Z-Score data and make trends more discernible, a moving average is applied. Users can choose from several types, such as SMA, EMA, or HMA, based on their preference.
3. 🔄 Heiken Ashi Visualization: For those opting for a more intuitive trend analysis, Heiken Ashi plots can be enabled, transforming the Z-Score data into candlestick charts that simplify trend identification.
4. 🔍 Identifying Divergences: The script is equipped to spot divergences between the market price action and the Z-Score, signaling potential bullish or bearish market reversals.
oscHigherLow = haClose > ta.valuewhen(findPivotLow, haClose , 1) and isInRange(findPivotLow )
priceLowerLow = low < ta.valuewhen(findPivotLow, low , 1)
bullishCondition = enablePlotBullish and priceLowerLow and oscHigherLow and findPivotLow
5. 🚨 Configurable Alerts: Lastly, the script allows for the setting of customizable alerts based on the Z-Score, moving averages, and identified divergences, enabling traders to react promptly to market changes.
The ∑ MVRV Z-Score by AlgoAlpha is an essential tool for traders looking to analyze and interpret market dynamics through a quantitatively rigorous lens. Whether you're focused on identifying market extremes or tracking trend momentum, this script offers the insights needed to support informed trading decisions. 🌟📊💡