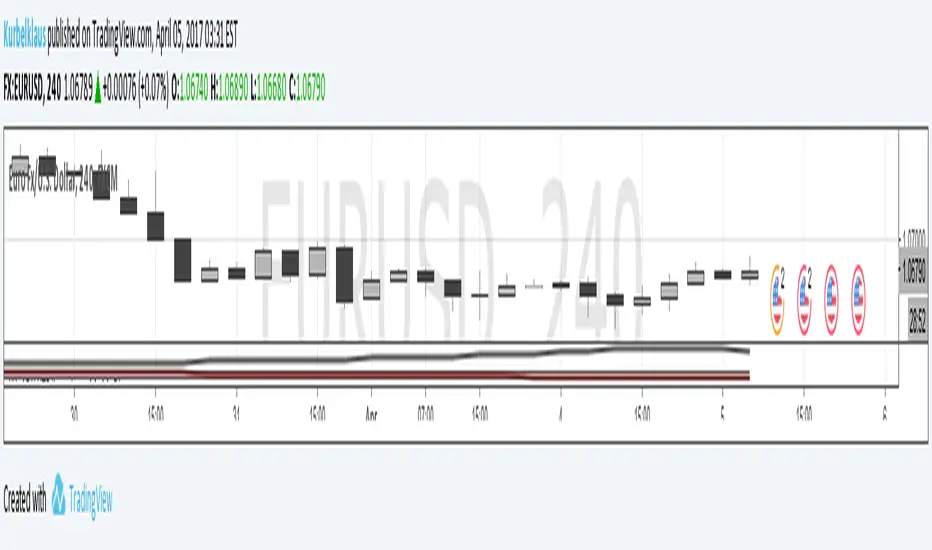
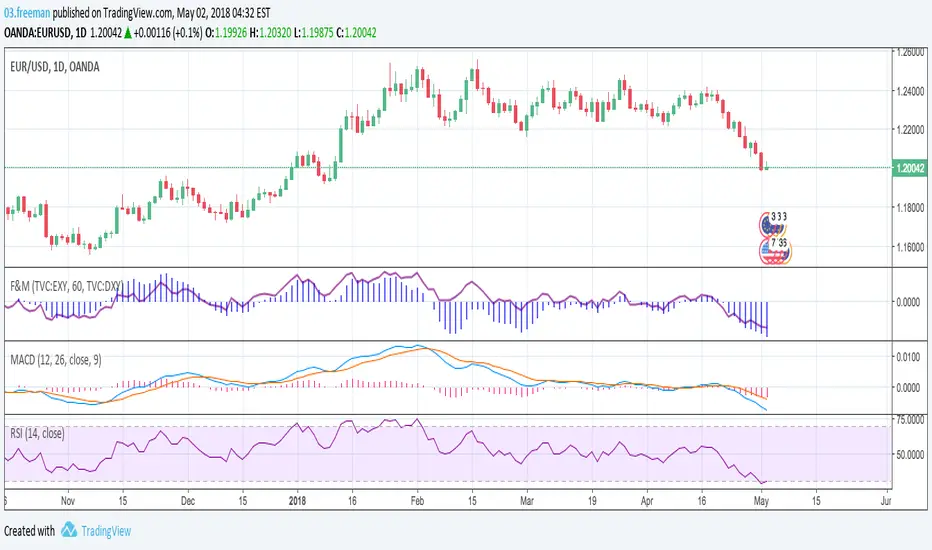
Strenght and MomentumThe scope of this script is to measure momentum and strenght of EURO and DOLLAR using their indexes.
Forza (line) above 0 means EURO is stonger than DOLLAR
Momento (histogram) above 0 means EURO has a positive momentum against DOLLAR
The added value to see MACD and RSI directly on EURUSD chart is that indexes consider also other pairs so their RSI and MACD has a larger view on forex markets.
Script has also an option for multi timeframes.
I think that could be used as filters for LONG or SHORT positions in lower time frames.
Multi-timeframe
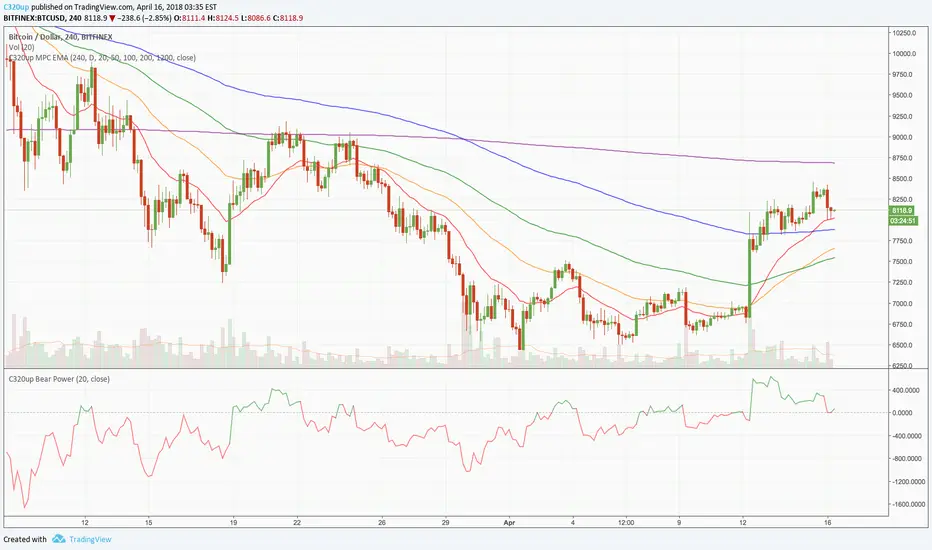
C320up MPC EMA 5 by Chart ResolutionC320up "MPC" EMA 5 by Chart Resolution
- This is a custom version of our C320up EMA by Chart Resolution.
This version has 5 EMA’s and is easier to quickly switch chart resolutions, this time using only 2 chart periods.
Why have filtered chart resolutions?
Some EMA’s don’t tend to give a useful indication at a given chart resolution, so any resolution not selected will not have the EMA lines appear on the screen.
Default resolutions are “240” Minutes (4 Hour), and “D” (1 Day).
With these settings the EMA lines will only appear on the 4 Hour and Daily charts.
Default EMA’s are 20, 50, 100, 200, and 1200.
Why 1200 you may ask. 1200 on the 4 Hour chart is equivalent to 200 on the Daily chart.
You can change these inputs to suit your requirements.
The first input is used to manually type in the chart resolution, as the TV built in drop downs don’t have all of the chart resolutions, 240 Minutes (4 Hour) for example.
If you don’t want them all to show on the screen, you can un-check them in the Style tab in settings.
Check out our scripts page for more indicators. (Including our Bear Power Indicator)
Any questions, just leave a comment.
If you want more control over the chart resolutions, try using this one:
"C320up EMA by Chart Resolution"
Simpler Trading MTF Trend 2018Any experienced trader knows that you can never get the whole ‘picture’ by looking at just one time frame. That is why we’ve created the Multi Time Frame Trend Analysis Indicator. With a glance at a single chart, you can determine across multiple timeframes the overall trend.
www.simplertrading.com

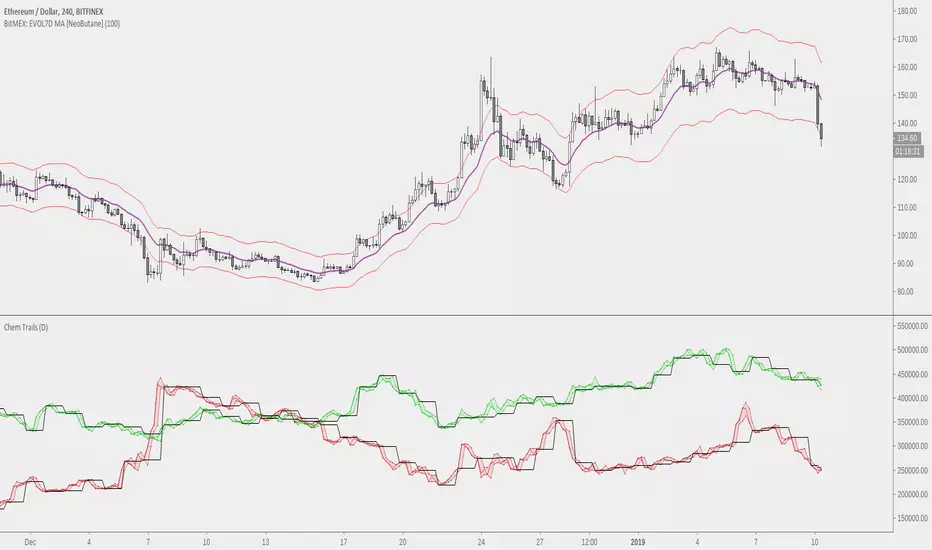
NeoButane Bitfinex BTC Longs vs. Shorts Tickers Simplified (MtF)With optional overlay for high/low candle values and daily resolution close. Now with MtF to add customization .
Made because I'm too lazy to constantly re-add tickers and to reduce noise.
Candle FMTFMultitimeframe candlesticks with shadows. Script draws each next candle gradually. Sorry for bad english. Good Luck in tradework!

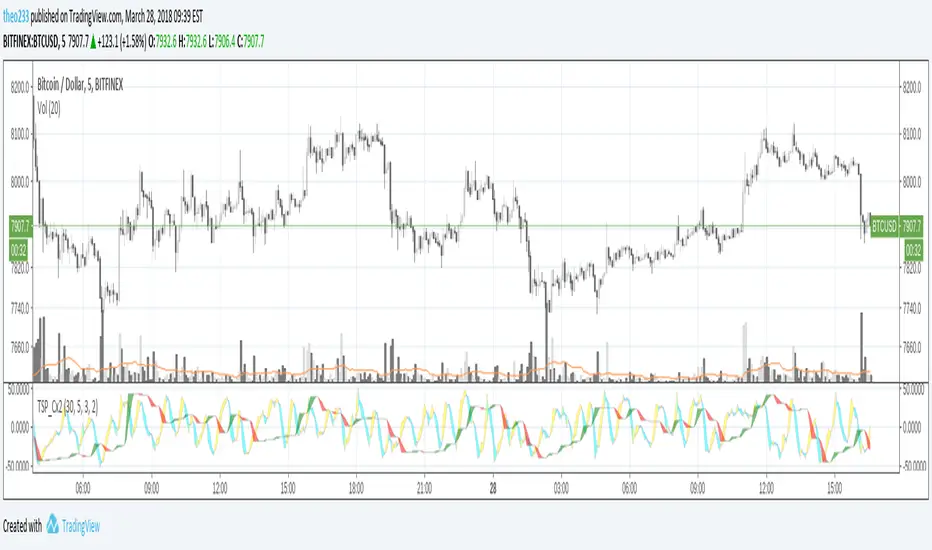
TSP Cycles DoubleDouble Cycles
You can setup higher timeframe cycle period's as argument, default is M30
Volume Weighted Average Range Bands [DW]This is an experimental study designed to identify the underlying trend bias and volatility of an instrument over any custom interval TradingView supports.
First, reset points are established at points where the opening price of the interval changes.
Next, Volume Weighted Average Price (VWAP) is calculated. It is the cumulative sum of typical price times volume divided by the cumulative volume. The cumulation starts over upon each reset point.
After that, Volume Weighted Average Range (VWAR) is calculated. The formula structure is the same as VWAP, except using range rather than typical price.
Lastly, the bands are calculated by multiplying the VWAR by the specified multiplier (approximate Golden Ratio by default) and by 1 through 5, then adding to and subtracting from the VWAP.
Custom Bar Colors are included.

Multi-Bollinger [DW]This is an experimental study designed to visualize trend activity and volatility using a set of two Bollinger Bands calculated with a basis moving average type of your choice.
The available moving averages in this script are:
-Exponential Moving Average
-Simple Moving Average
-Weighted Moving Average
-Volume Weighted Moving Average
-Hull Moving Average
-Least Squares Moving Average
-Arnaud Legoux Moving Average
-Coefficient of Variation Weighted Moving Average
-Fractal Adaptive Moving Average
-Kaufman's Adaptive Moving Average
In addition, a middle filter is calculated by taking the median of the two basis lines.
Multi-Timeframe functionality is included. You can choose any timeframe that Tradingview supports as the basis resolution for the bands.
Custom bar color scheme is included with four options to choose from.

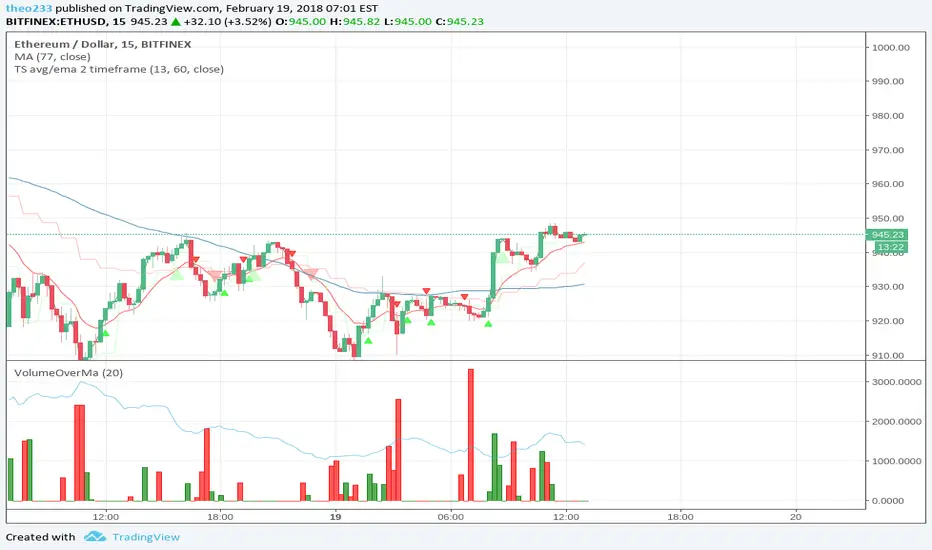
TS avg/ema 2 timeframeChart alerts of Cross between Average price and EMA on 2 timeframe
First timeframe comes from period
Second timeframe comes from input (default 1hour)
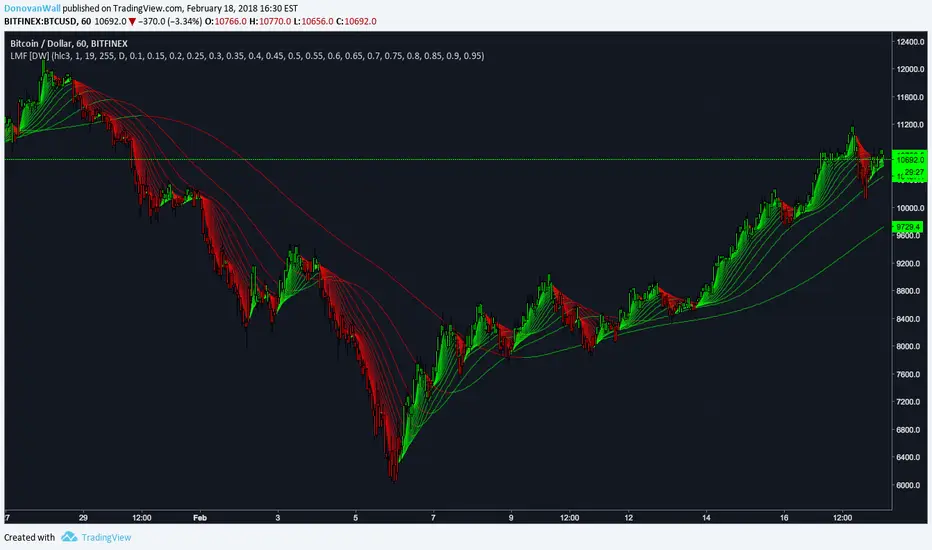
Laguerre Multi-Filter [DW]This is an experimental study designed to identify underlying price activity using a series of Laguerre Filters.
Two different modes are included within this script:
-Ribbon Mode - A ribbon of 18 Laguerre Filters with separate Gamma values is calculated.
-Band Mode - An average of the 18 filters generates the basis line. Then, Golden Mean ATR over the specified sampling period multiplied by 1 and 2 are added and subtracted to the basis line to generate the bands.
Multi-Timeframe functionality is included. You can choose any timeframe that TradingView supports as the basis resolution for the script.
Custom bar colors are included. Bar colors are based on the direction of any of the 18 filters, or the average filter's direction in Ribbon Mode. In Band Mode, the colors are based solely on the average filter's direction.
SuperTrend MultiTimeFrame with Alerts V.1SuperTrend Multi Time Frame with Multi Alerts ... you can insert alerts for all supertrend viewed on graph.
Different alerts for long and short.
This script plot 5min, 1H and 1D!
Enjoy!

MTF Polarity Grid [DW]This is an experimental study designed to track directional polarities across multiple timeframes and express them as a simple two color grid.
The polarity in this calculation is determined by divergence between a fast and slow McGinley Dynamic.
Your current resolution's polarity is the top row, the rows below are are for higher timeframes of your choice.

MTF Donchian Quadrants [DW]This is a simple Donchian Channel variation that separates the the channels into quadrants, and enables MTF calculation.
Average open and close plots are included for additional confirmation of a trend.

Hawkeye RoadkillWait for the Roadkill signal – then dive for the perfect kill!
Hawkeye Roadkill looks at multiple timeframes simultaneously, and then provides two entry signals, one based on the trend and the other on volume.
One of the biggest problems traders face is that whenever they see a signal or set up in one timeframe, they immediately look at a lower or higher timeframe chart to validate the signal for the confidence to enter the trade. This is a classic problem, and one that can be seen on virtually every trader’s screen, which can be cluttered with several charts, all with different timeframes and all giving different signals to the confused trader. Ultimately, the trader loses both money and confidence, and is no longer able to trade.
For example, if you are looking at a daily chart, does the weekly chart also suggest that your trade is valid? Or, if you are looking at a 15 minute timeframe, does the one-hour chart confirm your analysis? Often the two charts will differ in their signals, since a trend that has begun in one timeframe, may already be ending in another.
So you have two clear signals to get you into the market in your preferred timeframe.

Multiple Ichimoku CloudsFor anyone that uses the Ichimoku Cloud there is a consistent need to flip between timeframes to get information about this at all levels. However, that trouble is now over. In this script there are 4 Ichimoku Clouds that operate in 4 different time frames. To change the timeframe simply change the multiplication factor to the desired levels. How this script works is that it takes your current timeframe as an input then it applies multiplication factors to it to achieve larger timescales. In the example here we are looking at the XBTJPY pair on the 1 hour. Our first cloud is 1x scaling, meaning that it is the 1 hour cloud. The second and third are 2x and 4x respectively meaning that we are looking at the 2 hour cloud and the 4 hour cloud. Lastly the largest cloud is the 24x cloud, aka the daily cloud. Now you only really need one look at the clouds for all the essential information.
As always feel free to message me about anything regarding this script.
Be happy :)
MTF Previous Open/Close/RangeThis indicator will simply plot on your chart the Daily/Weekly/Monthly previous candle levels.
The "Auto" mode will allow automatic adjustment of timeframe displayed according to your chart.
Otherwise you can select manually.
Indicator plots the open/close and colors the high-low range area in the background.
Hope this simple indicator will help you !
You can check my indicators via my TradingView's Profile : @PRO_Indicators

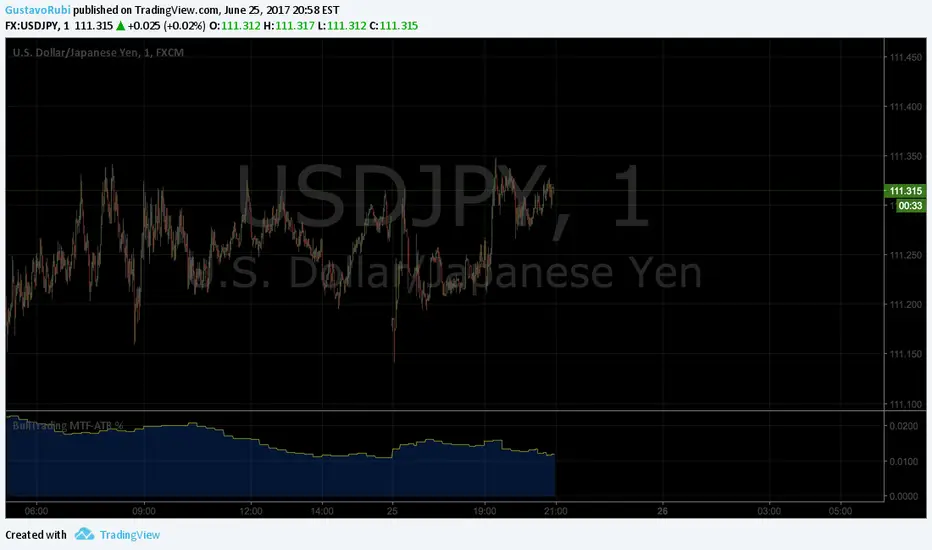
BullTrading MultiTimeFrame ATR %Good afternoon traders.
Have you ever got trapped on the middle of a consolidation? Well, it just happened to me trading the 1 minute chart last friday!
So, I coded this script to display a percentage of ATR for a given resolution.
Now, how can you benefit using this information?
For example:
Using the standard settings (resolution is calibrated 15 minutes in order to trade 1minute charts), just draw your prefered support and resistance. Then measure the number of pips between support and resistance. This number should be approximately the same the indicator is displaying. If the indicator is displaying a lower value, maybe it will be a good idea to tighten your support/resistance levels (if the price goes against you, you will have confidence and probability on your side to open an opposite position and reach your Take profit before a new reversal take place.
Change colors and resolution for your desired timeframe until you find your particular "sweet spot"
Have a nice trading week.
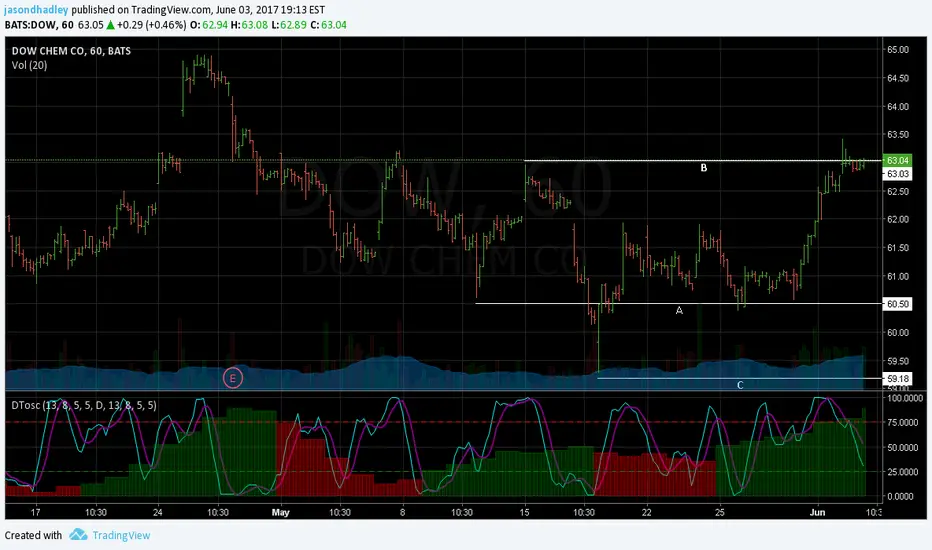
Dynamic Time Oscillator W/ MTF SupportThis script has the option to disable the MTF feature and use it as a plain DTOscillator.
The lines are the fast and slow signals for the current timeframe.
The columns are the second timeframe %K levels.
Green columns signify the second timeframe %K is greater than the second timeframe %D, Red is the reverse of this.
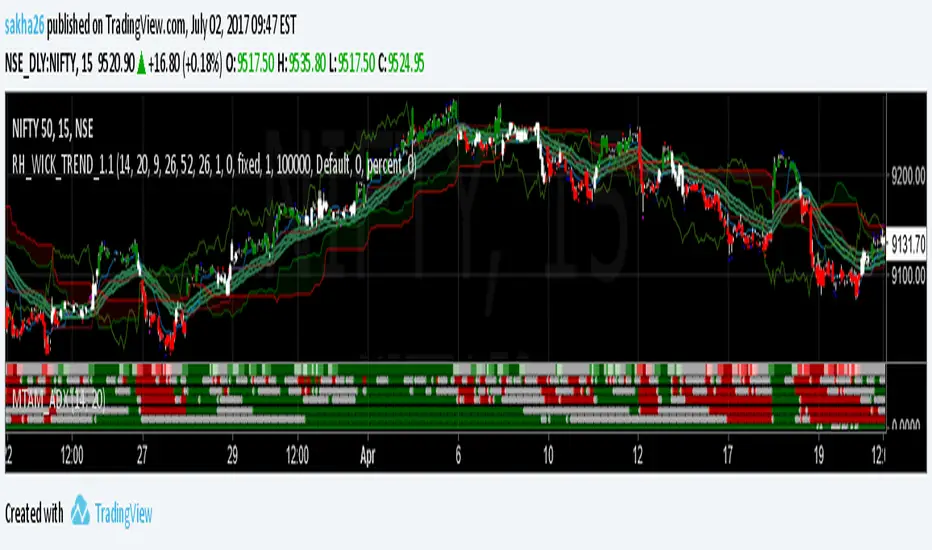
KK_Average Directional Index (ADX) Higher TFHey guys,
sometimes you just want to plot an Indicator value from a higher Timeframe on your Chart. For most Indicators this is pretty straightforward however there is one Indicator that has been giving me quite a headache while trying to do this: The Average Directional Index . Anyway after going through almost 200 versions of this script I finally found a solution that works and thought I would share this with you, since I'm sure some of you have encountered the same problem.
How it works
Go to your desired Instrument/Timeframe and add the Script
Under Settings in the field for "Higher ADX TF" put the Timeframe-code you want to pull the ADX Values from.
- Codes: Monthly - M, Weekly W, Daily - D
- Codes Intraday: The amount of hours in minutes, e.g. if you want to pull values from the 4h-Chart the code is 240 (60 for 1h, 15 for 15m ...)
In some cases (see below) the calculation might not be correct. So make sure the values are correct:
a) Write down the latest ADX of the higher TF while you are on the lower TF
b) Switch the Resolution to the higher TF
c) Compare the value you have just written down to the next to last value. They should be the same.
d) Switch back the Resolution to the lower TF and you're good to go.
Limitations
You can only pull values from higher Timeframes, e.g. you're on a 4h Chart, so you can only pull values from the Daily, Weekly and Monthly Chart. You can't pull values from the 1h Chart.
You can only pull values from Timeframes, where the higher Timeframe Close always has a corresponding Close on the lower Timeframe, e.g. you can't pull values from the 3h Chart when you are on a 2h Chart. This should be pretty rare.
The Script needs a certain amount of Data from the Higher TF before the calculated values are correct. I have tested this on several Instruments and the Script usually needs approximately 100 Bars on the higher Timeframe (often less) for the values to be correct (error < 1%).
So when the difference between your lower Timeframe and you higher Timeframe is large, e.g. you want to pull the Daily ADX value on a 15m-Chart, the calculation can be wrong. This can lead to errors in 2 Cases:
a) Backtesting: When you go over old data and get close to the last available Bar the Data will be wrong. This will limit the amount of data you can backtest.
b) Live values: When the difference between the two Timeframes is too large, it is possible that even live values are wrong, e.g. this will be the case when you are trying to pull the Daily ADX value on a 5 minute Chart. Always check if the calculation works with your desired combination of Timeframes before using it (see above).
I hope this is useful for you and whish all of you successful trading!
Best regards
Kurbelklaus