Momentum-Oszillatoren

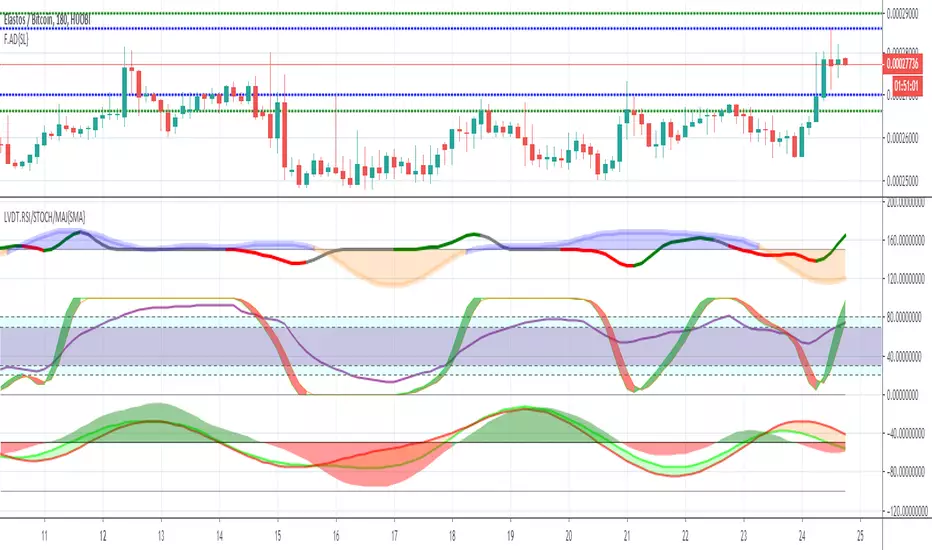
LIVIDITIUM RSI/STOCH/MAJ Oscillator Set {SMA}LVDT RSI oscillator
LVDT STOCHASTIC-RSI oscillator
LVDT MAJ (Momentum/Acceleration/Jerk) oscillators + signals ( Default = Disabled)
~JuniAiko
(=^~^=)v~
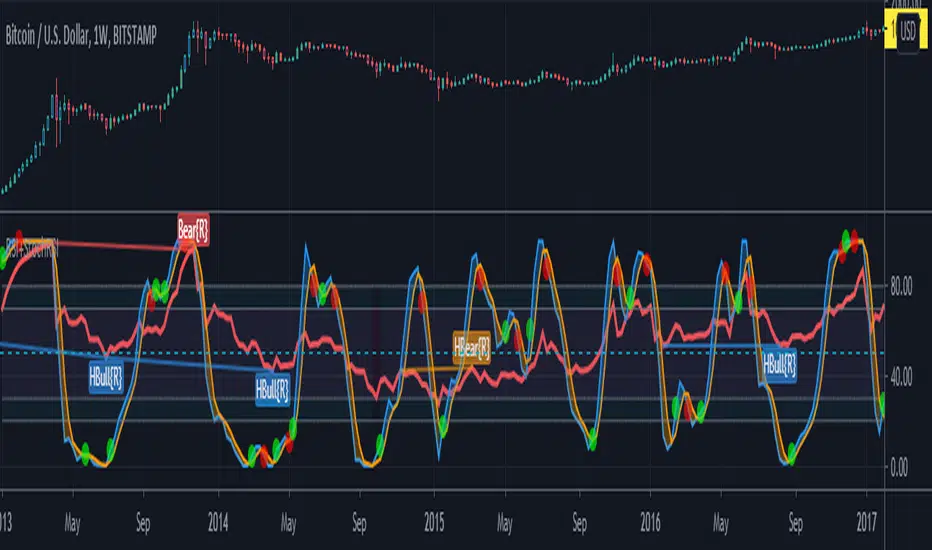
Pulse Profits+ Study v2.0Here is the updated version of our Pulse Profits+ study based on the combination of the Chande Momentum Oscillator and Elder's Force Index . This version was updated to include stop-loss and improved signals
Red background highlights mark sell signals and green highlights represent buy signals. All signals are accompanied by corresponding alerts that can be tailored for the various automated trading platforms.
All indicators can be found on our website in the bio and come with their strategy equivalents

Kairi Relative Index Leading IndicatorHere is a leading indicator based on the relatively obscure Kairi Relative Index. The Kairi comes from Japan and is similar to the popular RSI, although it is believed that it predates the RSI significantly.
The Kairi measures the difference between the current price and its SMA as a percentage of the moving average.
We made a few modifications to the Kairi to improve its timing and balance its sensitivity. First, we calculated a 'fast' and 'slow' Kairi Relative Index. To do this, it calculates the difference between the current price and a SMA with a length of 7 periods for the fast Kairi. Then, the difference between the current price and an SMA of length 24 is calculated for the slow Kairi.
The big modification is using a 25 period SMA of slow Kairi Relative Index values as the threshold for buy and sell signals. When the fast Kairi line crosses above the white line(the threshold) it is considered a bullish signal, while a bearish signal comes when it crosses back below the same white line. This solved the issue with the Kairi having slower reaction time than the RSI. As the chart shows, this setup allowed it to catch not only major trends but also predict unexpected price spikes.
Users can adjust all 3 lengths, as well as adjust the option to have the slow Kairi displayed on the chart(shown in second pane).

Adaptive Momentum Oscillator(AMO)Here is a new experimental indicator that we've been developing that is focused on gauging momentum.
The indicator fluctuates above and below zero, but instead of using zero as the threshold for differentiating positive and negative momentum, it uses an 89 period median(plotted as the thick white line).
The momentum over the previous 10 periods is then calculated and then smoothed using a 6 period Exponential Moving Average (EMA). This, as well as the choice to use a median as the central divider were done to eliminate the whipsaws that are often generated when making strategies based on pure momentum and crossings above/below 0. The EMA alternates between lime green when it is above the median and pink when it is below. The area between the EMA and median is filled in green when EMA > median and pink when the EMA is less than the median.
Then, a 29 period Simple Moving Average of momentum is calculated. Here, going with a SMA over EMA and a longer window(29) seemed to make sense as it is counteracts the high responsiveness of the EMA. The SMA is green when greater than the median and red when less than the median.
There's two ways to trade using this system. One way would be to go long when the momentum EMA crosses over the white median line and turns lime green, then short when it crosses back under the median line and turns white. Another option is to go long under the same conditions, but short when both the EMA and SMA are above the median and the EMA crosses under the SMA.
Not sure if this exact configuration has already been created by someone, but it'll be interesting to see how it holds up with more backtesting and then running it fully automated.
-Strategy version coming soon-

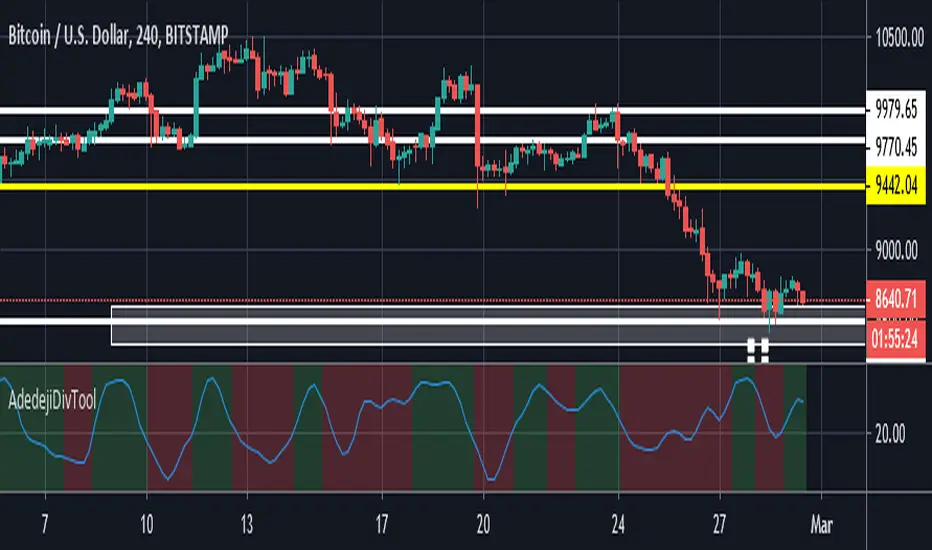
Cynotronic_Divergence tool_v1This tool was developed to accurately capture divergences. Back-testing has shown it's relatively more accurate in detecting all types of divergences (both hidden and regular).
The tool is NOT to be used in isolation; it's best used in conjunction with moving averages (preferably the 20 MA);
1. The indicator background indicates bullish (green background color) or bearish (red background color) sentiments;
2. Indicator reversal is most bullish when price action is above MA;
3. Indicator reversal + Green background + price above MA is extremely Bullish;
4. Indicator reversal + Green background + price below MA is indicative of an incoming distribution phase;
5. Indicator reversal + Red background + price above MA is slightly bullish;
6. Indicator reversal + Red background + price above MA is indicative of an incoming accumulation period.
Development/improvement is a continuous thing!
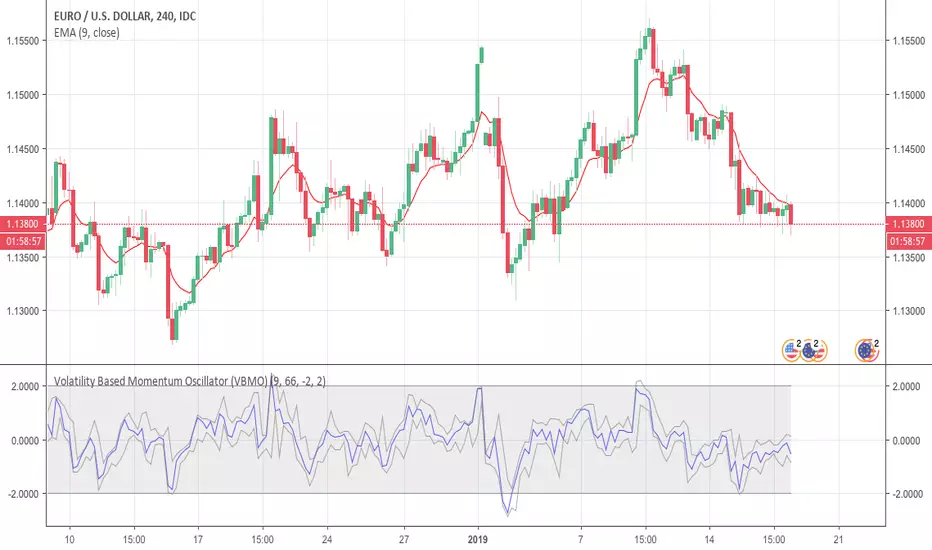
Volatility Based Momentum Oscillator (VBMO)There is a frequent and definitive pattern in price movement, whereby price will steadily drift lower, then accelerate before bottoming out. Similarly, price will often steadily rise, then accelerate into a climax top.
The Volatility Based Momentum Oscillator (VBMO) is designed to delineate between steady versus more accelerated and climactic price movements.
VBMO is calculated using a short-term moving average, the distance of price from this moving average, and the trading instrument’s historical volatility. Even though VBMO’s calculation is relatively simple, the resulting values can help traders identify, analyze and act upon many scenarios, such as climax tops, reversals, and capitulation. Moreover, since the units and scale for VBMO are always the same, the indicator can be used in a consistent manner across multiple timeframes and instruments.
For more details, there is an article further describing VBMO and its applicability.
Jurik VelocityHello friends,
Meet Velocity, Jurik's ultra-smooth alternative to the traditional momentum indicator. Designed to reveal the true pace of market movement without the typical noise and lag, it offers a more accurate view of acceleration and deceleration in price. Includes an optional normalization mode to ensure the scale remains consistent across all markets.
🛠 How It Works
What's wrong with classical momentum? The standard momentum indicator is often too noisy to be useful. Traders try to fix this by applying moving averages — which smooths it, but at the cost of responsiveness.
Velocity solves this by using Jurik's non-lagging smoothing method that removes noise without delay , maintaining the sharpness of turning points while filtering out irrelevant fluctuations.
Like the classical momentum, Velocity compares the current price with that from N periods ago, but with vastly improved clarity. It helps traders detect early shifts in trend strength, exhaustion points, and potential reversals — all while keeping a steady, normalized scale for cross-market consistency.
🔥 Key Features
Non-lagging Jurik smoothing — clarity and responsiveness without delay
Highlights bullish and bearish velocity peaks for precise timing
Integrated alert conditions for velocity peak events
📸 Visual Examples
Velocity with peaks highlighting
If you'd like access or have any questions, feel free to reach out to me directly via DM.
👋 Good luck and happy trading!
Bezahltes Script

Elder's Force Index Function (with source)TradingView has built in functions for RSI, Momentum, and many other oscillators. Why the source isn't available for Elder's Force Index is beyond me. To me it's one of the Holy Grail indicators. This is EFI indicator with a simple function inside the source code. You're can easily copy this function into any study(indicator) or strategy that uses built-in oscillators, as a replacement.
Example using EFI instead of RSI in built-in Divergence Indicator:
gyazo.com
//Discord: Sheldon#7775
//Server: discord.gg

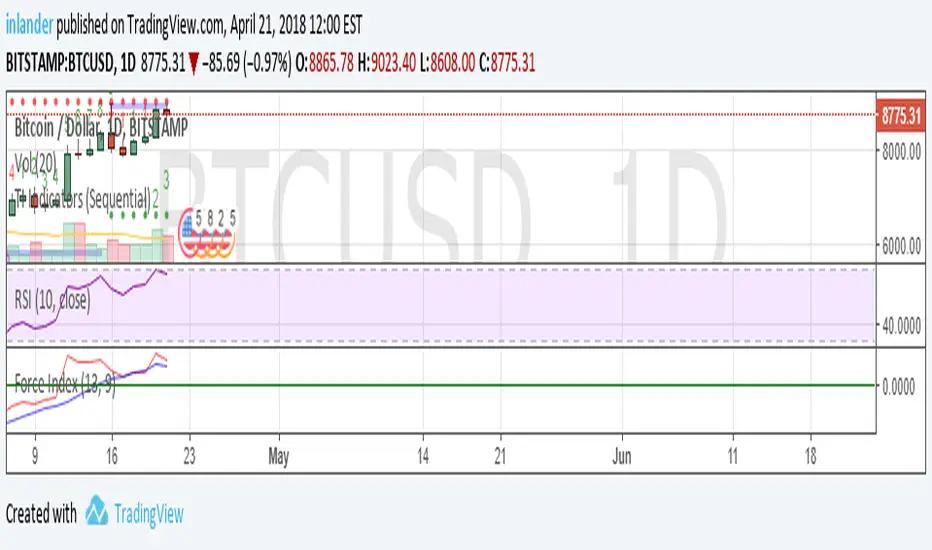
Pullback Trading [Fhenry0331]The indicator is taken from Alexander Elders "Triple Screen System," minus using the Weekly MACD as a filter/trend. I believe waiting for the force index and the weekly MACD histogram to line-up is uber conservative and a trader will miss too many signals (In my opinion).
The indicator is for a pullback trader. A trader that waits for a trend to develop then enters on a pullback.
The indicator defines an uptrend start: as the 13 ema crossing above the 26 ema. It defines a downtrend start: as the 13 ema crossing below the 26 ema.
The pullback in an uptrend: 13 ema is above the 26 ema. Elders-Force-Index is below the zero line. Price low has crossed below the 13 ema (one can also say price closes below the 13 ema if they so wish).
The pullback in a downtrend: 13 ema is below the 26 ema. Elders-Force-Index is above the zero line. Price high has also crossed above the 13 ema.
Please note that the pullback signals do not necessitate an automatic buy or sell (the instrument can be still pulling back deeper and not ready to resume it's trend.) One should place orders above (long) or below (short) bars with the pullback signals. Do so on signals until orders are filled.
Although the indicator is meant for pullbacks one can make an aggressive entry at the onset of a crossover of ema's.
For clarity background colors has been added to the indicator.
works well on daily time frame. Also look at intraday (5) minute time frame on trending stocks (news, earnings, volume, etc.)
Keep It Simple.
Enjoy!

Cumulative Force IndexVolume indicator adapted from Elder's Force Index.
From here:
stageanalysis.net

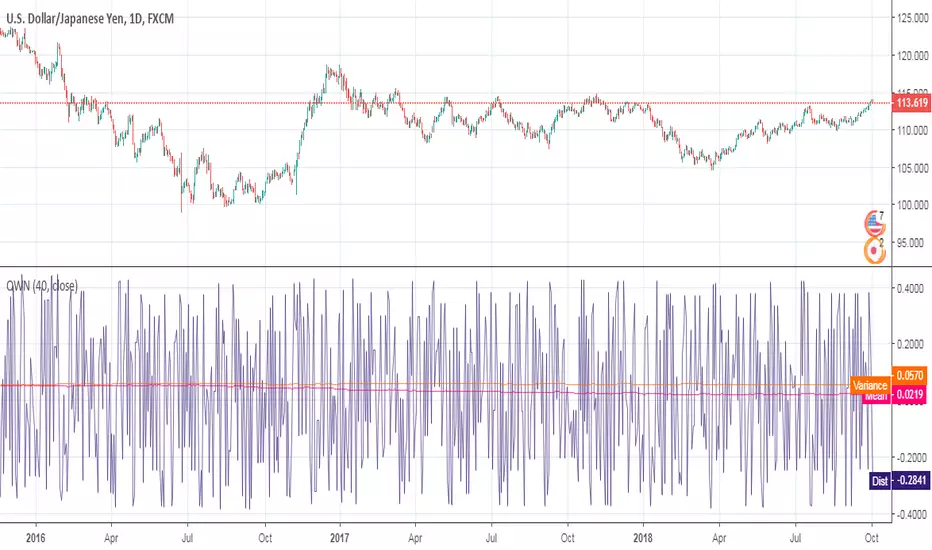
[RESEARCH] Quasi White NoiseQuasi White Noise script.
An experimental approach to implement a white noise using Pine Script. Uses Connors RSI under the hood.
en.wikipedia.org
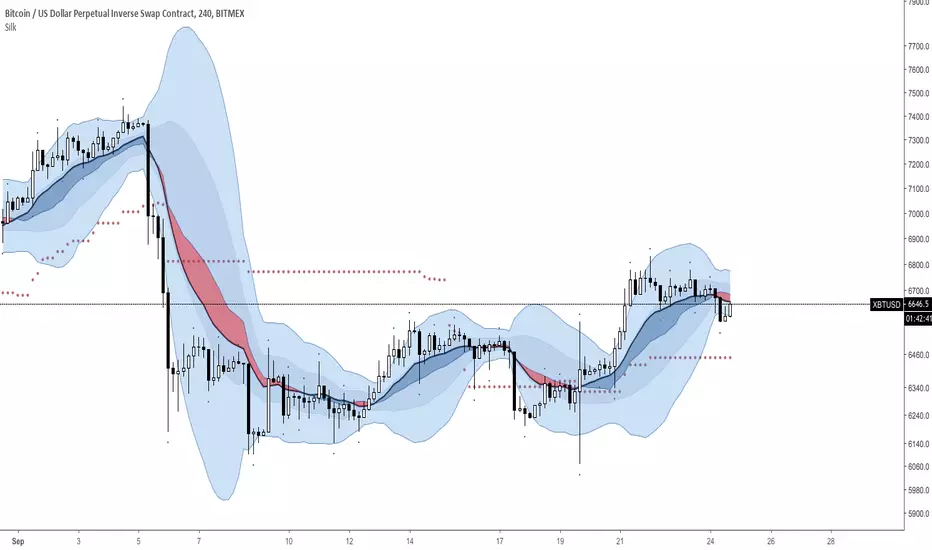
Silk Indicator (H4 & D1) : VWMA Flow vs EMA // BB vs Dev. St.RSIPictured as a Momentum Indicator, it shines best on the H4 and the D1.
A combination of VWMA, EMA's, BB, Stochastic RSI, the Kijun (Doubled Ichimoku Cloud), William's Fractals ('.') and too many Standard Deviations.
Simple Strategy:
Center Blue: Long
Center Red: Short
The center of the BB can help understand the market's momentum and its strength.
Please be advised, this indicator will only be free for a limited time.
Oscillator Divergence HistogramIdentify Divergences on 6 oscillators simultaneously.
From the bottom up.
0 to 1 (black): MACD
1 to 2 (green): Elders Force Index
2 to 3 (blue): RSI
3 to 4 (purple): Awesome Oscillator
4 to 5 (red): Commodity channel index
5 to 6 (orange): Stochastic
You can change the identification of the divergence in the settings and use the Oscillator Divergences indicator to visually see them when testing.
This detects the following divergences between price and the oscillator.
Regular Bullish Divergence: Price lower low | Oscillator higher low
Regular Bearish Divergence: Price higher high | Oscillator lower high
Hidden Bullish Divergence: Price higher low | Oscillator lower low
Hidden Bearish Divergence: Price lower high | Oscillator higher high
Early warning alert system. This identifies a developing divergence and can be used to set alerts.
Colors
Bearish: Maroon
Bullish: Green
Hidden Bearish: Light brown
Hidden Bullish: Light green
Developing early warning are lighter shades of the above.


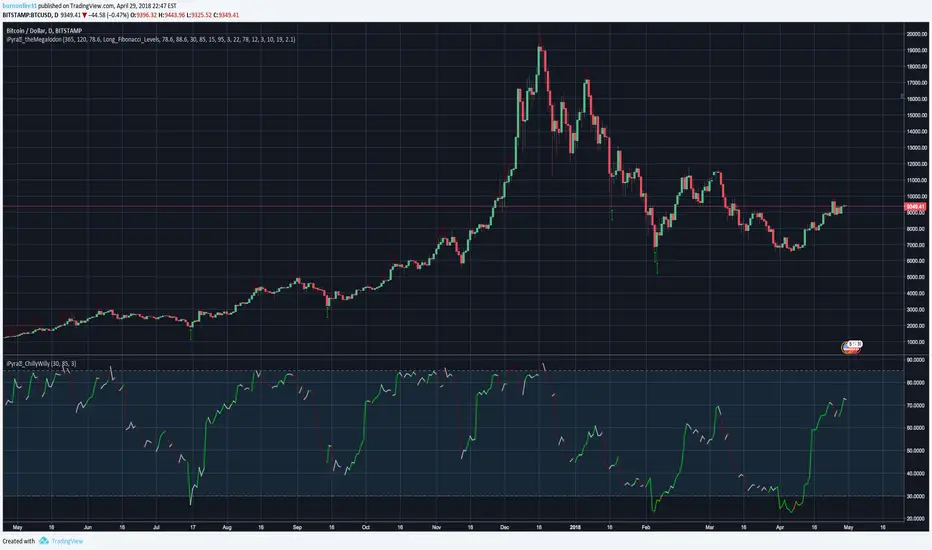
iPyra◬_ChillyWillyCHILLYWILLY
ChillyWilly looks for the momentum trades.
ChillyWilly combines the 4 different well known momentum indicators to bring the best signals.
ChillyWilly works with any kind of market state, any kind of trading, and any kind of asset.
ChillyWilly has more features than any other momentum indicator in the market: Combining shorter term momentum with longer term momentum, and looking for M's and W's for you.
--------------------------------------
ChillyWilly is designed for longer time frame traders and investors.
All you have to do is:
1- Use it like you would use RSI (ChillyWilly is ranging between 0-100 --> Closer to 0 means Long ~~ Closer to 100 means short)
2- Look for green or orange lines. (Orange means momentum is BOTH in a good location to long and showing a W ; Green means EITHER momentum is in a good location to long or showing a W)
3- Look for red or maroon lines. (Red means momentum is BOTH in a good location to short and showing a M ; Green means EITHER momentum is in a good location to short or showing a M)
------------------------------------------------------------
iPyra◬
Enlighten others
Elder's Force Index Double combined by iduThe idea is to see Elder's force index smoothed EMA in different time frame simultaneously.
Default intervals are (2) and (13)
Base on samuel16 script.


Colored Williams %RThis script is the same as Williams %R except that on green days we plot green and red on red days. If a bar opens and closes the same, we plot black.

MoD_CM_RSI_2_Strat_Lower_Indicatormodified version of "CM_RSI_2_Strat_Lower_Indicator". credit to CM for the hard work.
updates:
1. now includes inputs for SMA values and RSI values
2. contains option to trigger Alerts.
how to trigger alerts?
-In First Drop Down Box Select Name of Indicator
-In Drop Down to Right Select “RSI Alert....”
-Then Select “Greater Than”.
-Then Select “Value”
-To the Right of Value type in .99
-Select On Bar Close / Once on candle, whatever your preference.
