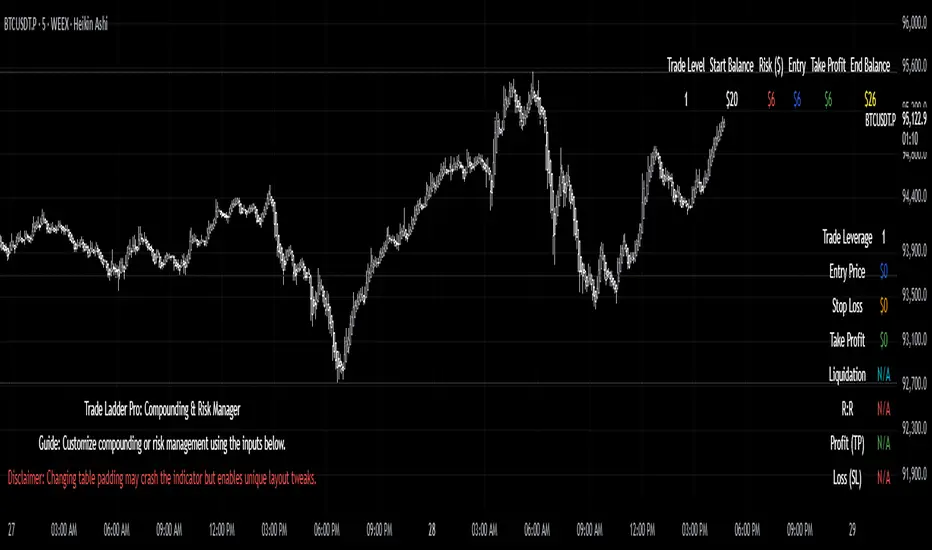
Trade Ladder Pro: Compounding & Risk ManagerTrade Ladder Pro: Compounding & Risk Manager
Inspired by the popular $20 to $52,000 trading challenge, this tool is designed to help you scale your trading account using systematic compounding and enhanced risk management techniques. Whether you’re aiming for disciplined growth or fine-tuning your risk/reward, Trade Ladder Pro offers a flexible approach to visualizing your trade levels.
How to Use:
Inputs:
Compounding Mode:
Set your starting balance, final balance goal, number of trades, and current trade level. You can move to the next trade after a successful trade in settings. The entries are not signals. They are there to help manage risk.
The script calculates the necessary compounding factor to grow your balance across the defined trades.
Risk Management Mode:
In addition to the above, specify a risk percentage and risk/reward ratio.
Input an entry price (or leave it at 0 to use the current price) to automatically compute the stop loss and take profit levels.
Display Options:
Choose the table’s position on the chart (e.g., Top Right, Top Left, Bottom Right, Bottom Left).
Pick between a vertical or horizontal layout for a display that suits your workflow.
Results:
The table will display the trade level, starting balance, risk amount, entry price, take profit, and (if in Risk Management mode) stop loss along with the projected ending balance.
Community & Feedback:
Your feedback is invaluable! Please share any tips or report any errors you encounter so we can continue to improve this tool. Happy trading!
Mj
MJ ECT== One Line Introduction ==
ECT is a multi-level, trend focused technical indicator based on a three-step hierarchical approach - comprising the tide, wave, and ripple - to trend identification.
== Indicator Philosophy ==
The author believes that market trends can be understood in a three-step hierarchy, with tide at the top, wave in the middle, and ripple at the bottom, corresponding to long-, middle-, and short-term momentum in the stock price. This indicator therefore comprises three technical indicators which aims to reflect the abovementioned features of a trend. These three components are True Strength Index (TSI), Exponential Moving Averages ( EMA ), and Commodity Channel Index ( CCI ).
== Indicator Components and Breakdown ==
True Strength Index (TSI) -> Tide
A 20-period TSI is used to visualize the bullish or bearish sentiment surrounding the stock. Crossovers above the zero line are interpreted as bullish while crossovers below the zero line are interpreted as bearish . This is painted into the background where green represents bullish and red represents bearish . While the background is red ( bearish ), no bullish positions should be taken. Hence, the TSI painted background acts as a directional bias filter and going against the bias is not recommended. After understanding the directional bias, the user can delve further into the areas of value for the stock in the Wave.
Exponential Moving Averages ( EMA ) -> Wave
Four EMA are used (20, 50, 100, 200) to identify the dynamic support and resistance waves in a trending market. Stock price pullbacks into any of these EMA represent areas of value where the user can consider taking positions. The correct EMA to use depends on individual stock's behavior, with multiple bounces on a specified EMA being the priority. After understanding which wave best reflects the area of value of a stock, the user can move on to the Ripple to time their entries.
Commodity Channel Index ( CCI ) -> Ripple
A 5-period CCI is used to identify short-term oversold conditions where prices are on discount. Discount is defined by the 5-period CCI crossing below -100 as it reflects a weekly oversold condition. The indicator will display a small triangle below the candle when this condition is met.
== Ready To Deploy Field Manual ==
When background is painted red, do nothing.
When background is painted green, begin thinking of bullish opportunities.
Look for the specific EMA that has the most bounces of stock price in recent months, this is the area of value to look for buying opportunity.
For the candles that intersect the EMA you identified above, watch for the appearance of a small triangle below the candle that tells you the entry timing.
When the entry timing signal triangle appears, remember the High of that candle and buy your position when the subsequent candle breaks above this High.
If the High is not broken above in the next immediate candle, remember the newer High of the newer candle (basically follow / trail the latest High until a break above is hit).
If the background turns from green to red, stop following the High and do not enter because the market sentiment has changed to bearish .
If you are holding an existing position and the background turns red, consider exiting the position. You may consider remembering the Low of the candle and exit your position if this Low is broken below on a subsequent candle.
== Best Wishes ==
The author wishes the best success for all users of this technical indicator.