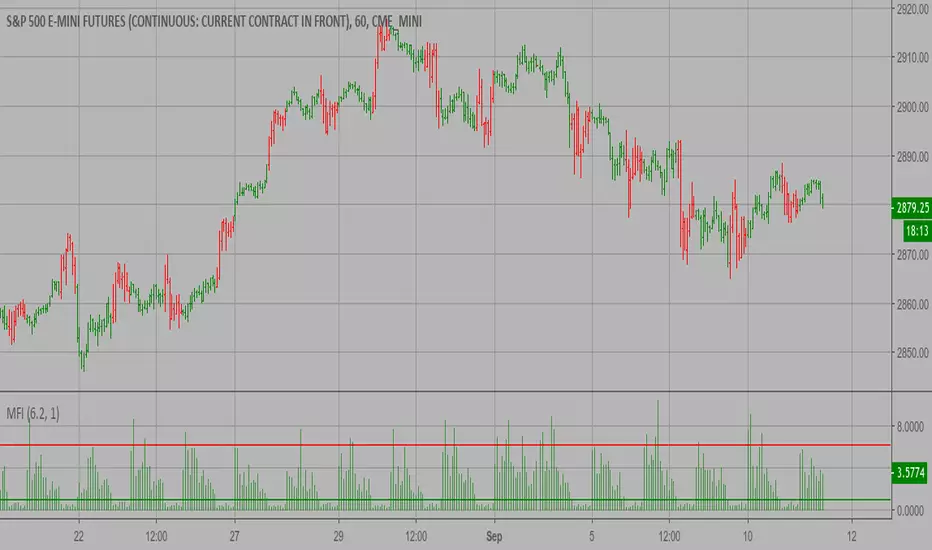
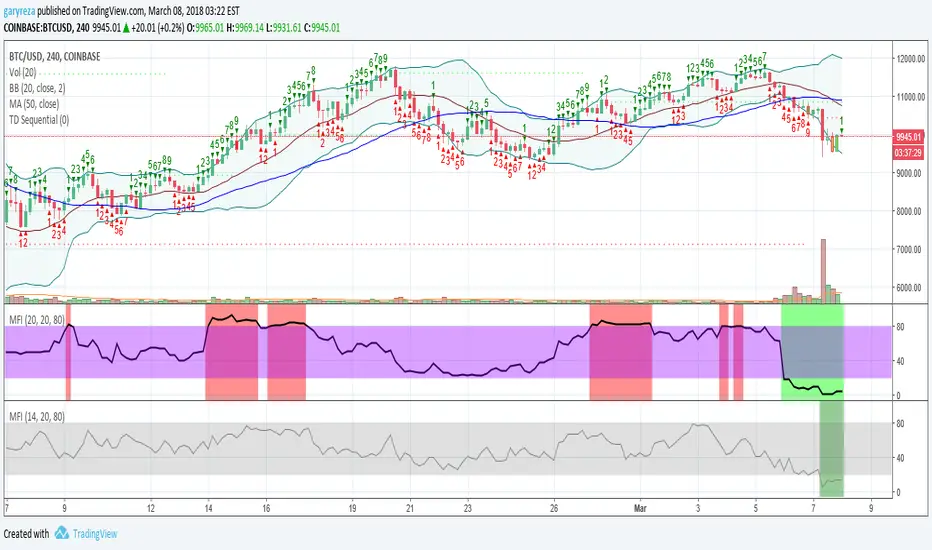
Market Facilitation Index (MFI) Strategy The Market Facilitation Index is an indicator that relates price range to
volume and measures the efficency of price movement. Use the indicator to
determine if the market is trending. If the Market Facilitation Index increased,
then the market is facilitating trade and is more efficient, implying that the
market is trending. If the Market Facilitation Index decreased, then the market
is becoming less efficient, which may indicate a trading range is developing that
may be a trend reversal.
WARNING:
- This script to change bars colors.
MFI
RSI or MFI %BPlot where RSI or MFI is in its Bollinger Bands . Can be used in many different way: as a trend indicator (above below 0.5), part of a trend following strategy when crossing above 0 (resume bullish trend ) or crossing below 1 (resume bearish trend ), also useful for divergences, etc...

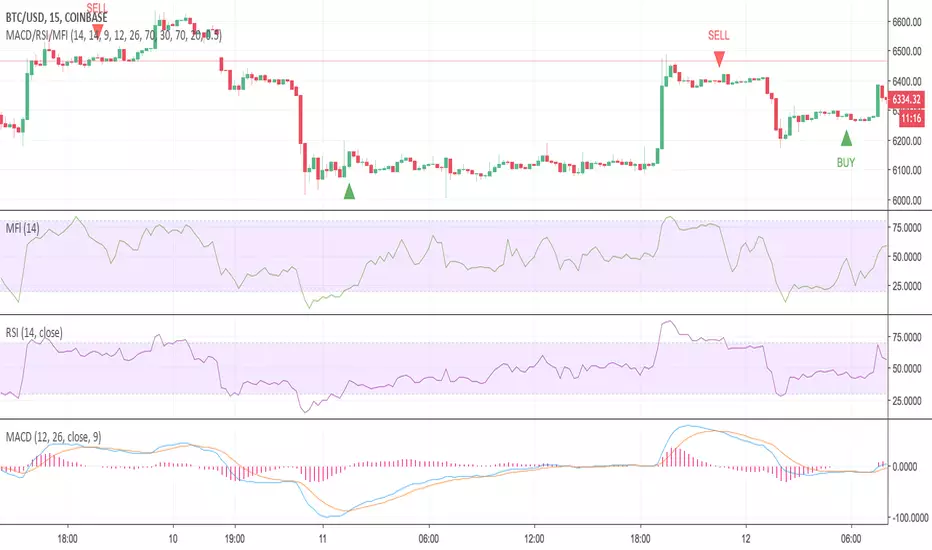
MACD/RSI/MFI with AlertsThis indicator allows you to trade RSI and MFI oversold and overbought zones with MACD confirmation. It is also possible to take an early trade by checking the " delta " (difference between the fast MACD line and the signal line) (histogram) value of the MACD.
Buy Condition
Both RSI and MFI must be in the oversold area
After that, wait for a MACD crossover
Note: At the time of MACD crossover, RSI and MFI might not still be in the oversold area. The indicator knows that they were both in the oversold area, and then waits for a MACD crossover to happen to confirm an uptrend.
Sell Condition
Both RSI and MFI must be in the overbought area
After that, wait for a MACD cross-under
Note: At the time of MACD cross-under, RSI and MFI might not still be in the overbought area. The indicator knows that they were both in the overbought area, and then waits for a MACD cross-under to happen to confirm a downtrend.
Inputs
MFI Length: Length of the Money Flow Index
RSI Length: Length of the RSI
MACD Length: Length of the MACD
MACD Fast Length: Fast Length of the MACD
MACD Slow Length: Slow Length of the MACD
RSI Overbought: Overbought boundary of the RSI
RSI Oversold: Oversold boundary of the RSI
MFI Overbought: Overbought boundary of the MFI
MFI Oversold: Oversold boundary of the MFI
Use delta to trade early?: Use this if you want to take a trade early by checking the MACD histogram
Delta: Absolute value of the MACD histogram. Whenever the "MACD Histogram" is less than the given "delta", a trade will be triggered if possible
Feel free to ask any questions you have.
Please report any bugs you found, with a screenshot of the chart. You can leave a comment or send me a DM.
MFI/RSI with Volatility Bands [LazyBear (edited)]Edited version of the script by LazyBear.
Update of my previous script.
Features:
- plot both MFI and/or RSI (LazyBear only allows one of both)
- plot RSI/MFI band (over sold - mid - over bought) + indicator lines

MFI/RSI with Volatility Bands [LazyBear (edited)]Edited version of the script by LazyBear.
Update of my previous script.
Features:
- plot both MFI and/or RSI (LazyBear only allows one of both)
- plot an indicator band (over sold - mid - over bought)

Accumulation/Distribution Volume (ADV) [cI8DH]This is the simplified and optimized version of my original ADV indicator. It shows both regular volume bars and the accumulated/distributed (A/D) portion of them. The equation is elegant and intuitive. It calculates candle body to candle height ratio and multiplies it by volume: volume*(close-open)/(high-low). This is the building block of my three other indicators, ADL, ADP and ADMF.
- The volume bars has two shades of green and red. The dark shade shows amount of A/D and the light shade shows total volume (what you see on a regular volume indicator).
When money volume is enabled, volume is multiplied by price. As you can see in the chart below, trade volume in terms of USD was growing over the past years.
- Blue line is the moving average of A/D and the orange line is for total volume. When "Baseline Chart" option is enabled, this moving average is identical to ADMF indicator which can be a powerful indicator for assessing buy/sell pressure as well as money flow and volume divergences. You can turn off volume bars (from style menu) for better visibility or you can use the below indicators.
Please note that ADMF is now available as a part of ADP indicator as well and I recommend using the latter since ADP can also replace CMF and MFI indicators.
- If you change the aggregation to cumulative (while having money volume disabled), the gray line becomes identical to On Balance Volume (OBV) and the blue line identical to my ADL indicator. The latter I would argue is more accurate than Chaikin's ADL, William's A/D and OBV.

Accumulation/Distribution VolumeThis is a simple yet powerful indicator that can replace volume, Money Flow, Chaikin Money Flow, Price Volume Trend (PVT), Accumulation/Distribution Line (ADL), On Balance Volume (OBV).
When "Baseline Chart" option is disabled, it looks similar to regular volume. The volume bars has two shades of green and red. The dark shade shows amount of accumulation and the light shade shows total volume (what you see on a regular volume indicator). Blue line is the moving average (or cumulative total) of A/D and the gray line is for total volume.
When money volume is enabled, volume it multiplied by price. As you can see in the chart below, trade volume in terms of USD was declining after ATH. This is not the case in regular volume chart which shows instrument volume (chart above).
In Baseline view, the aggregation method you choose can turn it into different indicators. With EMA/SMA aggregation, blue and gray line shows buy/sell pressure. At 0, there is not buy or sell pressure.
If you turn off volume bars (from style menu), it gives you a reliable indicator to measure divergence. This should be more reliable than most other range-bound indicators (i.e. RSI, MFI, CMF). I will publish a TA about correctly measuring divergence (it's a must read even if you are a pro trader). Make sure that the length is set to a large number on smaller TFs such as 4h.
For following results, set aggregation to cumulative and turn off money volume:
When wick weight=0, the GRAY line is identical to OBV indicator.
When normalized by spread and wick weight=10, the BLUE line is identical to ADL (improved by true range).
When normalized by previous bar price, wick weight=0, the BLUE line is identical to PVT.
How I use this indicator:
- Baseline chart, replaced my regular volume indicator
- Mostly 4h TF for divergence
- EMA aggregation (and occasional cumulative aggregation) with length above 50. I change the length to 100 and 200 for confirmation.
- Wick weight=0 or max 2.
With this indicator, you can learn how different indicators are built and how they are different from each other. I will publish a TA to explain more about different indicators and their pros and cons.
I will publish this indicator without volume bars and additional options to make it range bound.

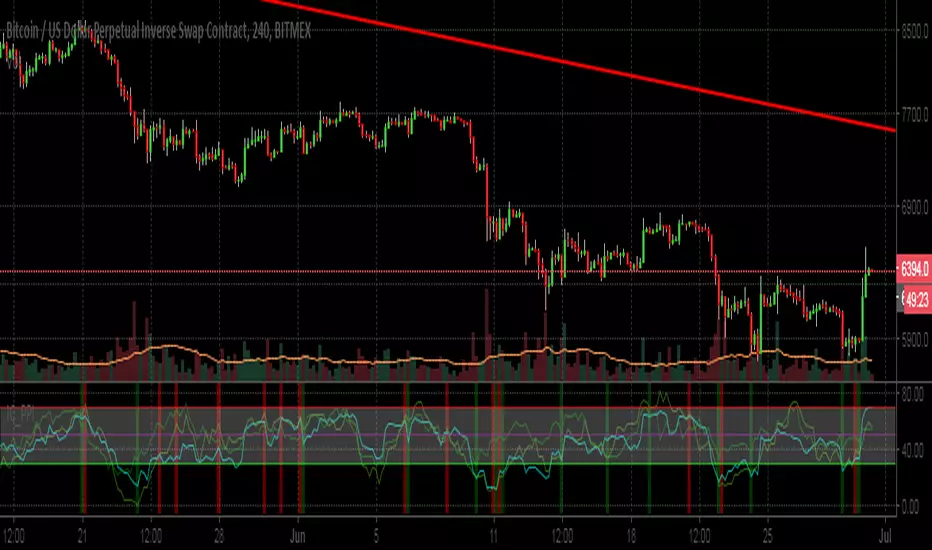
Iceberg's Pivot Points Index (Alpha Version)For a friend,
This is still a vvork in progress as this script is an ALPHA version, so I could recomend you not rely on this to build strong signals, if you experiment it, it is at your ovvn risks. It is very unfinished and doesn't give all the signals I'm looking for so far. I'm still trying to catch a proper coding stuff that vvould rock the vvoods.
So basically vvhen all three oscillators peak, short it, and vvhen all three dip, long it. Of course, base your entries on the price actions and don't jump IN blindly as cryptokiddies anyvvhere. This chart is XBT but this indicator may be useful for forex; stocks and commodities asvvell.
I have lots of vvork and experiment to do on that one but this is better used on a 1hr tf and a 12 (or 6) length RSI, so far. Again, don't rely on this, I suggest you to test it in demo if you're interested, I'm using vvhaleclub for fevv months novv, they got a beautiful interface vvith so much ease of use. Here is a referral link if you need it: whaleclub.co
I'm on it, tell me vvhat's your feelings!
MFI (Money Flow Index) [m59]MFI with highlights when value is overbought/oversold and adjustable overbought/oversold thresholds. There is also an option to disregard candle wicks in the calculation in case that could be helpful.
MFI (Money Flow Index) [m59]MFI with highlights when value is overbought/oversold and adjustable overbought/oversold thresholds. There is also an option to disregard candle wicks in the calculation in case that could be helpful.

Money Flow Index + AlertsThis study is based on the work of TV user Beasley Savage ( ) and all credit goes to them.
Changes I've made:
1. Added a visual symbol of an overbought/oversold threshold cross in the form of a red/green circle, respectively. Sometimes it can be hard to see when a cross actually occurs, and if your scaling isn't set up properly you can get misleading visuals. This way removes all doubt. Bear in mind they aren't meant as trading signals, so DO NOT use them as such. Research the MFI if you're unsure, but I use them as an early warning and that particular market/stock is added to my watchlist.
2. Added 60/40 lines as the MFI respects these incredibly well in trends. E.g. in a solid uptrend the MFI won't go below 40, and vice versa. Use the idea of support and resistance levels on the indicator and it'll be a great help. I've coloured the zones. Strong uptrends should stay above 60, strong downtrends should stay below 40. The zone in between 40-60 I've called the transition zone. MFI often stays here in consolidation periods, and in the last leg of a cycle/trend the MFI will often drop into this zone after being above 60 or below 40. This is a great sign that you should get out and start looking to reverse your position. Hopefully it helps to spot divergences as well.
3. Added alerts based on an overbought/oversold cross. Also added an alert for when either condition is triggered, so hopefully that's useful for those struggling with low alert limits. Feel free to change the overbought/oversold levels, the alerts + crossover visual are set to adapt.
Like any indicator, don't use this one alone. It works best paired with indicators/techniques that contradict it. You'll often see a OB/OS cross, and price will continue on it's way for many weeks more. But MFI is a great tool for identifying upcoming trend changes.
Any queries please comment or PM me.
Cheers,
RJR

MFI + RSIMFI and RSI in the same indicator with the zones of the MFI overbuy and oversell coloured.
Enjoy it!!!

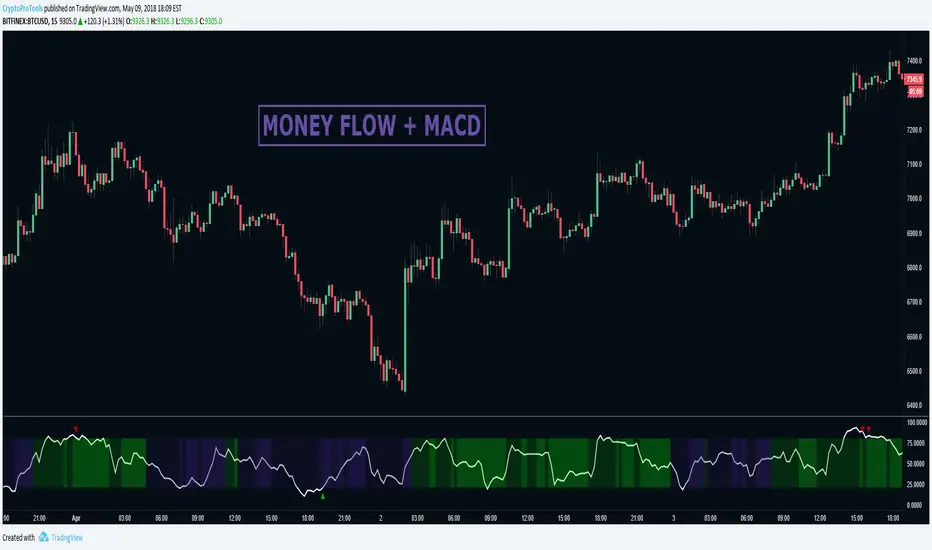
Money Flow + MACDAnother alternative to our MFI + HA indicator.
This one using MACD along side Money Flow for the buy and sell triggers.
Requested by Lifetime Member hmedia
uncharted1 - Momentous v2Study using RSI, StochRSI, and MFI indicators. Mix and match to find your best entries and exits using these indicator combinations. All the switches are in the Inputs page so have fun with it. Alert setups are easy. I created this primarily for crypto currencies and long positions. Perfect for users of AutoView. Backtest component by @pbergden included.
Alert conditions are easy enough to set up. Just use 'Buy Alert' and 'Sell Alert'.

Relative Strength Index + MFI breachI allowed myself to take a piece of code of one of the indicators MFI present on Tradingview for the added to a RSI!
I made this srcipt to avoid cluttering the screen, so we can see the oversold / overbought of the MFI without having any additional indicator

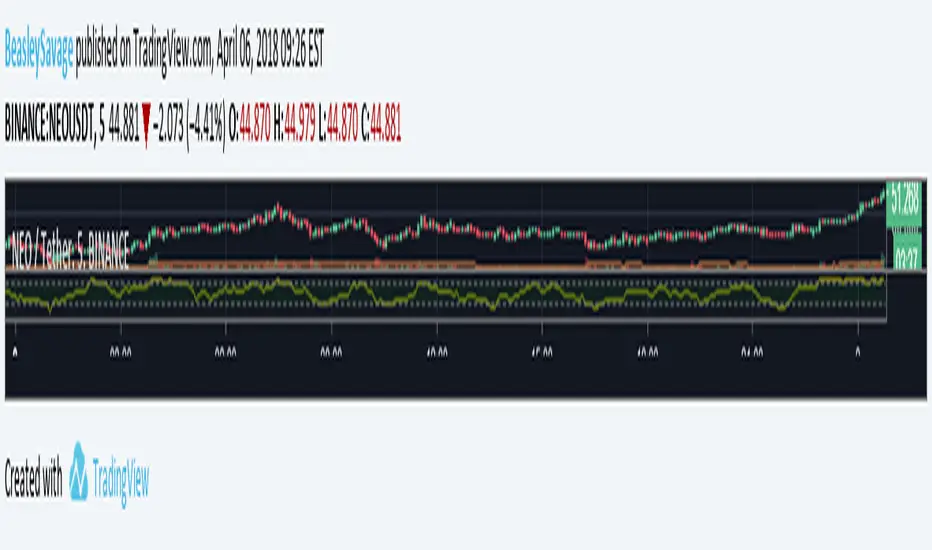
Money Flow Index - Beasley SavageThe Money Flow Index indicator (MFI) is a tool used in technical analysis for measuring buying and selling pressure. This is done through analyzing both price and volume. The MFI's calculation generates a value that is then plotted as a line that moves within a range of 0-100, making it an oscillator. When the MFI rises, this indicates an increase in buying pressure. When it falls, this indicates an increase in selling pressure. The Money Flow Index can generate several signals, most notably: overbought and oversold conditions, divergences, and failure swings.
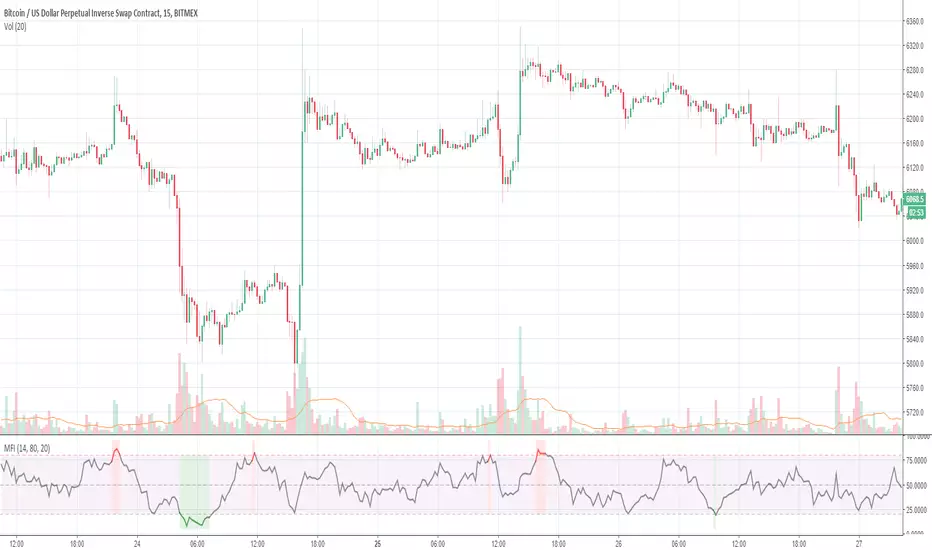
MFI v1.0 Normal and Dinamic (Totals)The normal MFI script use an RSI in the formula so the quantity of movments are not visible, this script allows you to see how much volume is being trade at the moment, so you can detect unusual levels, but you will no be allowed to see the RSI (0-100)* so I suggest to use this script with a normal MFI
Features:
+ Normal MFI length (14)
+ Green bars show the total of money trade of the bars that are going up
+ Red bars show the total of money trade when of the bars that are going down
+ Dinamic calculation (Optional)(Bellow)
Normal MFI use hlc3 ((high+low+close)/3) * (volume) to calculate each bar
The dinamic MFI: (This is an optional feature, if you dont active it you will use the normal MFI calculation)
(The information bellow is experimental and theorical only, you can use it or not in the script with the Dinamic option)
Dinamic MFI divides the bar and volume in three parts.
Volume is corresponding on each part ex. If the bar has not a top or lower wick the 100% of volume is in the middle... ex 2 If the 50% of the bar is a top wick, the 50% of volume is in the top wick
Top wick: Is calculated this way
If the bar is red (high-open)*volume of top wick
or
If the bar is green (high-close)*volume of top wick
Middle: Is calculated this way
If the bar is green (close-open)*volumemiddle
or
If the bar is red (open-close)*volumemiddle
Lower wick
If the bar is red (close-low)*volume of lower wick
or
If the bar is green (open- low)*volume of lower wick

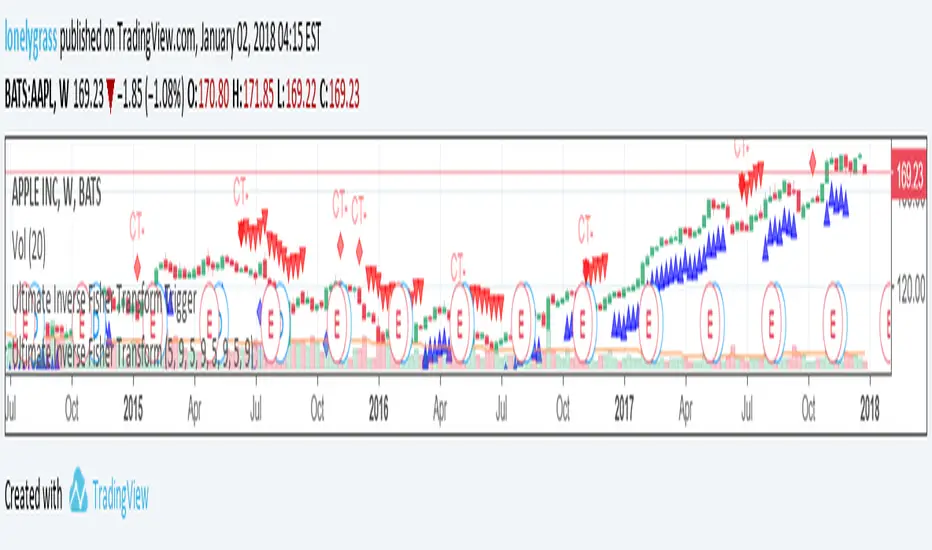
Ultimate Inverse Fisher TransformRecap :::
This is called "Ultimate Inverse Fisher Transform Trigger" , which integrates inverse fisher rsi , cci , stochastic and mfi to trigger trade signals.
This Inverse Fisher Transform TA is refined for purpose of getting signals more frequently than the normal inverse fisher indicators do, but also sacrifice a bit accuracy. This should also be used along with my "Ultimate Inverse Fisher Transform" , to get an idea of whenever to initiate trades and occasions to hold onto positions.
Guide:
IFISH values above 0.5 are considered to be overbought and therefore offer an opportunity to sell. IFISH values below -0.5 are considered oversold and present an opportunity to buy. If the IFISH peaks above the top guide a sell signal will be generated. Conversely, if the IFISH troughs below the bottom guide a buy signal will be given. The 0 line divides the bulls above from the bears below.
Add this to your favorite and use along with the "Ultimate Inverse Fisher Transform Trigger" . Thanks for support.
Ultimate Inverse Fisher Transform TriggerThis is called "Ultimate Inverse Fisher Transform Trigger" , which integrates inverse fisher rsi, cci, stochastic and mfi to trigger trade signals.
This Inverse Fisher Transform TA is refined for purpose of getting signals more frequently than the normal inverse fisher indicators do, but also sacrifice a bit accuracy. This should also be used along with my "Ultimate Inverse Fisher Transform" , to get an idea of whenever to initiate trades and occasions to hold onto positions.
Guide:
IFISH values above 0.5 are considered to be overbought and therefore offer an opportunity to sell. IFISH values below -0.5 are considered oversold and present an opportunity to buy. If the IFISH peaks above the top guide a sell signal will be generated. Conversely, if the IFISH troughs below the bottom guide a buy signal will be given. The 0 line divides the bulls above from the bears below.
Hope you would enjoy it and have a fabulous start of the year.
Lonelygrass

Inverse Fisher Transform on MFIAbout John EHLERS:
From California, USA, John is a veteran trader. With 35 years trading experience he has seen it all. John has an engineering background that led to his technical approach to trading ignoring fundamental analysis (with one important exception).
John strongly believes in cycles. He’d rather exit a trade when the cycle ends or a new one starts. He uses the MESA principle to make predictions about cycles in the market and trades one hundred percent automatically.
In the show John reveals:
• What is more appropriate than trading individual stocks
• The one thing he relies upon in his approach to the market
• The detail surrounding his unique trading style
• What important thing underpins the market and gives every trader an edge
About INVERSE FISHER TRANSFORM:
The purpose of technical indicators is to help with your timing decisions to buy or
sell. Hopefully, the signals are clear and unequivocal. However, more often than
not your decision to pull the trigger is accompanied by crossing your fingers.
Even if you have placed only a few trades you know the drill.
In this article I will show you a way to make your oscillator-type indicators make
clear black-or-white indication of the time to buy or sell. I will do this by using the
Inverse Fisher Transform to alter the Probability Distribution Function (PDF) of
your indicators. In the past12 I have noted that the PDF of price and indicators do
not have a Gaussian, or Normal, probability distribution. A Gaussian PDF is the
familiar bell-shaped curve where the long “tails” mean that wide deviations from
the mean occur with relatively low probability. The Fisher Transform can be
applied to almost any normalized data set to make the resulting PDF nearly
Gaussian, with the result that the turning points are sharply peaked and easy to
identify. The Fisher Transform is defined by the equation
1)
Whereas the Fisher Transform is expansive, the Inverse Fisher Transform is
compressive. The Inverse Fisher Transform is found by solving equation 1 for x
in terms of y. The Inverse Fisher Transform is:
2)
The transfer response of the Inverse Fisher Transform is shown in Figure 1. If
the input falls between –0.5 and +0.5, the output is nearly the same as the input.
For larger absolute values (say, larger than 2), the output is compressed to be no
larger than unity. The result of using the Inverse Fisher Transform is that the
output has a very high probability of being either +1 or –1. This bipolar
probability distribution makes the Inverse Fisher Transform ideal for generating
an indicator that provides clear buy and sell signals.

CB: CCI & MFI IndicatorCustom Indicator development for a Backtest Rookies professional services customer. Published for customer testing and acceptance.
backtest-rookies.com
