LuxyEnergyIndexThe Luxy Energy Index (LEI) library provides functions to measure price movement exhaustion by analyzing three dimensions: Extension (distance from fair value), Velocity (speed of movement), and Volume (confirmation level).
LEI answers a different question than traditional momentum indicators: instead of "how far has price gone?" (like RSI), LEI asks "how tired is this move?"
This library allows Pine Script developers to integrate LEI calculations into their own indicators and strategies.
How to Import
//@version=6
indicator("My Indicator")
import OrenLuxy/LuxyEnergyIndex/1 as LEI
Main Functions
`lei(src)` → float
Returns the LEI value on a 0-100 scale.
src (optional): Price source, default is `close`
Returns : LEI value (0-100) or `na` if insufficient data (first 50 bars)
leiValue = LEI.lei()
leiValue = LEI.lei(hlc3) // custom source
`leiDetailed(src)` → tuple
Returns LEI with all component values for detailed analysis.
= LEI.leiDetailed()
Returns:
`lei` - Final LEI value (0-100)
`extension` - Distance from VWAP in ATR units
`velocity` - 5-bar price change in ATR units
`volumeZ` - Volume Z-Score
`volumeModifier` - Applied modifier (1.0 = neutral)
`vwap` - VWAP value used
Component Functions
| Function | Description | Returns |
|-----------------------------------|---------------------------------|---------------|
| `calcExtension(src, vwap)` | Distance from VWAP / ATR | float |
| `calcVelocity(src)` | 5-bar price change / ATR | float |
| `calcVolumeZ()` | Volume Z-Score | float |
| `calcVolumeModifier(volZ)` | Volume modifier | float (≥1.0) |
| `getVWAP()` | Auto-detects asset type | float |
Signal Functions
| Function | Description | Returns |
|---------------------------------------------|----------------------------------|-----------|
| `isExhausted(lei, threshold)` | LEI ≥ threshold (default 70) | bool |
| `isSafe(lei, threshold)` | LEI ≤ threshold (default 30) | bool |
| `crossedExhaustion(lei, threshold)` | Crossed into exhaustion | bool |
| `crossedSafe(lei, threshold)` | Crossed into safe zone | bool |
Utility Functions
| Function | Description | Returns |
|----------------------------|-------------------------|-----------|
| `getZone(lei)` | Zone name | string |
| `getColor(lei)` | Recommended color | color |
| `hasEnoughHistory()` | Data check | bool |
| `minBarsRequired()` | Required bars | int (50) |
| `version()` | Library version | string |
Interpretation Guide
| LEI Range | Zone | Meaning |
|-------------|--------------|--------------------------------------------------|
| 0-30 | Safe | Low exhaustion, move may continue |
| 30-50 | Caution | Moderate exhaustion |
| 50-70 | Warning | Elevated exhaustion |
| 70-100 | Exhaustion | High exhaustion, increased reversal risk |
Example: Basic Usage
//@version=6
indicator("LEI Example", overlay=false)
import OrenLuxy/LuxyEnergyIndex/1 as LEI
// Get LEI value
leiValue = LEI.lei()
// Plot with dynamic color
plot(leiValue, "LEI", LEI.getColor(leiValue), 2)
// Reference lines
hline(70, "High", color.red)
hline(30, "Low", color.green)
// Alert on exhaustion
if LEI.crossedExhaustion(leiValue) and barstate.isconfirmed
alert("LEI crossed into exhaustion zone")
Technical Details
Fixed Parameters (by design):
Velocity Period: 5 bars
Volume Period: 20 bars
Z-Score Period: 50 bars
ATR Period: 14
Extension/Velocity Weights: 50/50
Asset Support:
Stocks/Forex: Uses Session VWAP (daily reset)
Crypto: Uses Rolling VWAP (50-bar window) - auto-detected
Edge Cases:
Returns `na` until 50 bars of history
Zero volume: Volume modifier defaults to 1.0 (neutral)
Credits and Acknowledgments
This library builds upon established technical analysis concepts:
VWAP - Industry standard volume-weighted price measure
ATR by J. Welles Wilder Jr. (1978) - Volatility normalization
Z-Score - Statistical normalization method
Volume analysis principles from Volume Spread Analysis (VSA) methodology
Disclaimer
This library is provided for **educational and informational purposes only**. It does not constitute financial advice. Past performance does not guarantee future results. The exhaustion readings are probabilistic indicators, not guarantees of price reversal. Always conduct your own research and use proper risk management when trading.
Mean

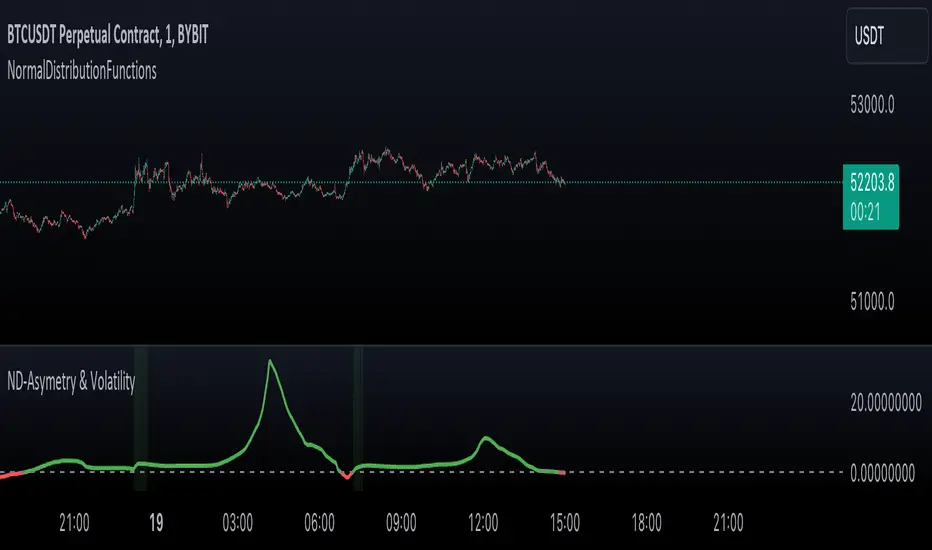
NormalDistributionFunctionsLibrary "NormalDistributionFunctions"
The NormalDistributionFunctions library encompasses a comprehensive suite of statistical tools for financial market analysis. It provides functions to calculate essential statistical measures such as mean, standard deviation, skewness, and kurtosis, alongside advanced functionalities for computing the probability density function (PDF), cumulative distribution function (CDF), Z-score, and confidence intervals. This library is designed to assist in the assessment of market volatility, distribution characteristics of asset returns, and risk management calculations, making it an invaluable resource for traders and financial analysts.
meanAndStdDev(source, length)
Calculates and returns the mean and standard deviation for a given data series over a specified period.
Parameters:
source (float) : float: The data series to analyze.
length (int) : int: The lookback period for the calculation.
Returns: Returns an array where the first element is the mean and the second element is the standard deviation of the data series for the given period.
skewness(source, mean, stdDev, length)
Calculates and returns skewness for a given data series over a specified period.
Parameters:
source (float) : float: The data series to analyze.
mean (float) : float: The mean of the distribution.
stdDev (float) : float: The standard deviation of the distribution.
length (int) : int: The lookback period for the calculation.
Returns: Returns skewness value
kurtosis(source, mean, stdDev, length)
Calculates and returns kurtosis for a given data series over a specified period.
Parameters:
source (float) : float: The data series to analyze.
mean (float) : float: The mean of the distribution.
stdDev (float) : float: The standard deviation of the distribution.
length (int) : int: The lookback period for the calculation.
Returns: Returns kurtosis value
pdf(x, mean, stdDev)
pdf: Calculates the probability density function for a given value within a normal distribution.
Parameters:
x (float) : float: The value to evaluate the PDF at.
mean (float) : float: The mean of the distribution.
stdDev (float) : float: The standard deviation of the distribution.
Returns: Returns the probability density function value for x.
cdf(x, mean, stdDev)
cdf: Calculates the cumulative distribution function for a given value within a normal distribution.
Parameters:
x (float) : float: The value to evaluate the CDF at.
mean (float) : float: The mean of the distribution.
stdDev (float) : float: The standard deviation of the distribution.
Returns: Returns the cumulative distribution function value for x.
confidenceInterval(mean, stdDev, size, confidenceLevel)
Calculates the confidence interval for a data series mean.
Parameters:
mean (float) : float: The mean of the data series.
stdDev (float) : float: The standard deviation of the data series.
size (int) : int: The sample size.
confidenceLevel (float) : float: The confidence level (e.g., 0.95 for 95% confidence).
Returns: Returns the lower and upper bounds of the confidence interval.
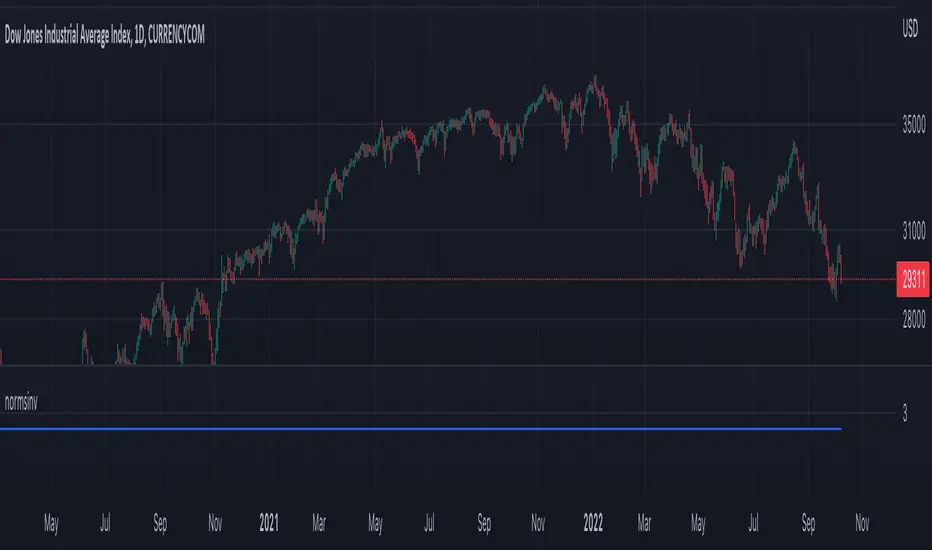
normsinvLibrary "normsinv"
Description:
Returns the inverse of the standard normal cumulative distribution.
The distribution has a mean of zero and a standard deviation of one; i.e.,
normsinv seeks that value z such that a normal distribtuion of mean of zero
and standard deviation one is equal to the input probability.
Reference:
github.com
normsinv(y0)
Returns the inverse of the standard normal cumulative distribution. The distribution has a mean of zero and a standard deviation of one.
Parameters:
y0 : float, probability corresponding to the normal distribution.
Returns: float, z-score
MomentsLibrary "Moments"
Based on Moments (Mean,Variance,Skewness,Kurtosis) . Rewritten for Pinescript v5.
logReturns(src) Calculates log returns of a series (e.g log percentage change)
Parameters:
src : Source to use for the returns calculation (e.g. close).
Returns: Log percentage returns of a series
mean(src, length) Calculates the mean of a series using ta.sma
Parameters:
src : Source to use for the mean calculation (e.g. close).
length : Length to use mean calculation (e.g. 14).
Returns: The sma of the source over the length provided.
variance(src, length) Calculates the variance of a series
Parameters:
src : Source to use for the variance calculation (e.g. close).
length : Length to use for the variance calculation (e.g. 14).
Returns: The variance of the source over the length provided.
standardDeviation(src, length) Calculates the standard deviation of a series
Parameters:
src : Source to use for the standard deviation calculation (e.g. close).
length : Length to use for the standard deviation calculation (e.g. 14).
Returns: The standard deviation of the source over the length provided.
skewness(src, length) Calculates the skewness of a series
Parameters:
src : Source to use for the skewness calculation (e.g. close).
length : Length to use for the skewness calculation (e.g. 14).
Returns: The skewness of the source over the length provided.
kurtosis(src, length) Calculates the kurtosis of a series
Parameters:
src : Source to use for the kurtosis calculation (e.g. close).
length : Length to use for the kurtosis calculation (e.g. 14).
Returns: The kurtosis of the source over the length provided.
skewnessStandardError(sampleSize) Estimates the standard error of skewness based on sample size
Parameters:
sampleSize : The number of samples used for calculating standard error.
Returns: The standard error estimate for skewness based on the sample size provided.
kurtosisStandardError(sampleSize) Estimates the standard error of kurtosis based on sample size
Parameters:
sampleSize : The number of samples used for calculating standard error.
Returns: The standard error estimate for kurtosis based on the sample size provided.
skewnessCriticalValue(sampleSize) Estimates the critical value of skewness based on sample size
Parameters:
sampleSize : The number of samples used for calculating critical value.
Returns: The critical value estimate for skewness based on the sample size provided.
kurtosisCriticalValue(sampleSize) Estimates the critical value of kurtosis based on sample size
Parameters:
sampleSize : The number of samples used for calculating critical value.
Returns: The critical value estimate for kurtosis based on the sample size provided.
