Session AnchorsDescription
This indicator highlights the four main global trading sessions — London, New York AM, New York PM, and Asia — as color-coded boxes on the chart. Each session is defined by fixed start/end times (New York time) and dynamically updates with the evolving high and low during that interval. This provides a clear view of how volatility and structure shift as trading activity passes from one region to another.
How to use
• Works on any timeframe.
• Toggle sessions on/off based on your trading hours.
• Observe price behavior as one session closes and another opens.
• Use session boxes as context for liquidity, volatility, and structure analysis.
Originality
This script delivers a clean, customizable visualization of global market hours and session ranges, avoiding extra overlays so traders can isolate session-based behavior without distraction.
⚠️ Disclaimer
This indicator does not generate signals. It provides a structural mapping of global sessions for contextual analysis only.
Marketvolatility

Dual-Phase Trend Regime Oscillator (Zeiierman)█ Overview
Trend Regime: Dual-Phase Oscillator (Zeiierman) is a volatility-sensitive trend classification tool that dynamically switches between two oscillators, one optimized for low volatility, the other for high volatility.
By analyzing standard deviation-based volatility states and applying correlation-derived oscillators, this indicator reveals not only whether the market is trending but also what kind of trend regime it is in —Bullish or Bearish —and how that regime reacts to market volatility.
█ Its Uniqueness
Most trend indicators assume a static market environment; they don't adjust their logic when the underlying volatility shifts. That often leads to false signals in choppy conditions or late entries in trending phases.
Trend Regime: Dual-Phase Oscillator solves this by introducing volatility-aware adaptability. It switches between a slow, stable oscillator in calm markets and a fast, reactive oscillator in volatile ones, ensuring the right sensitivity at the right time.
█ How It Works
⚪ Volatility State Engine
Calculates returns-based volatility using standard deviation of price change
Smooths the current volatility with a moving average
Builds a volatility history window and performs median clustering to determine typical "Low" and "High" volatility zones
Dynamically assigns the chart to one of two internal volatility regimes: Low or High
⚪ Dual Oscillators
In Low Volatility, it uses a Slow Trend Oscillator (longer lookback, smoother)
In High Volatility, it switches to a Fast Trend Oscillator (shorter lookback, responsive)
Both oscillators use price-time correlation as a measure of directional strength
The output is normalized between 0 and 1, allowing for consistent interpretation
⚪ Trend Regime Classification
The active oscillator is compared to a neutral threshold (0.5)
If above: Bullish Regime, if below: Bearish Regime, else: Neutral
The background and markers update to reflect regime changes visually
Triangle markers highlight bullish/bearish regime shifts
█ How to Use
⚪ Identify Current Trend Regime
Use the background color and chart table to immediately recognize whether the market is trending up or down.
⚪ Trade Regime Shifts
Use triangle markers (▲ / ▼) to spot fresh regime entries, which are ideal for confirming breakouts within trends.
⚪ Pullback Trading
Look for pullbacks when the trend is in a stable condition and the slow oscillator remains consistently near the upper or lower threshold. Watch for moments when the fast oscillator retraces back toward the midline, or slightly above/below it — this often signals a potential pullback entry in the direction of the prevailing trend.
█ Settings Explained
Length (Slow Trend Oscillator) – Used in calm conditions. Longer = smoother signals
Length (Fast Trend Oscillator) – Used in volatile conditions. Shorter = more responsive
Volatility Refit Interval – Controls how often the system recalculates Low/High volatility levels
Current Volatility Period – Lookback used for immediate volatility measurement
Volatility Smoothing Length – Applies an SMA to the raw volatility to reduce noise
-----------------
Disclaimer
The content provided in my scripts, indicators, ideas, algorithms, and systems is for educational and informational purposes only. It does not constitute financial advice, investment recommendations, or a solicitation to buy or sell any financial instruments. I will not accept liability for any loss or damage, including without limitation any loss of profit, which may arise directly or indirectly from the use of or reliance on such information.
All investments involve risk, and the past performance of a security, industry, sector, market, financial product, trading strategy, backtest, or individual's trading does not guarantee future results or returns. Investors are fully responsible for any investment decisions they make. Such decisions should be based solely on an evaluation of their financial circumstances, investment objectives, risk tolerance, and liquidity needs.

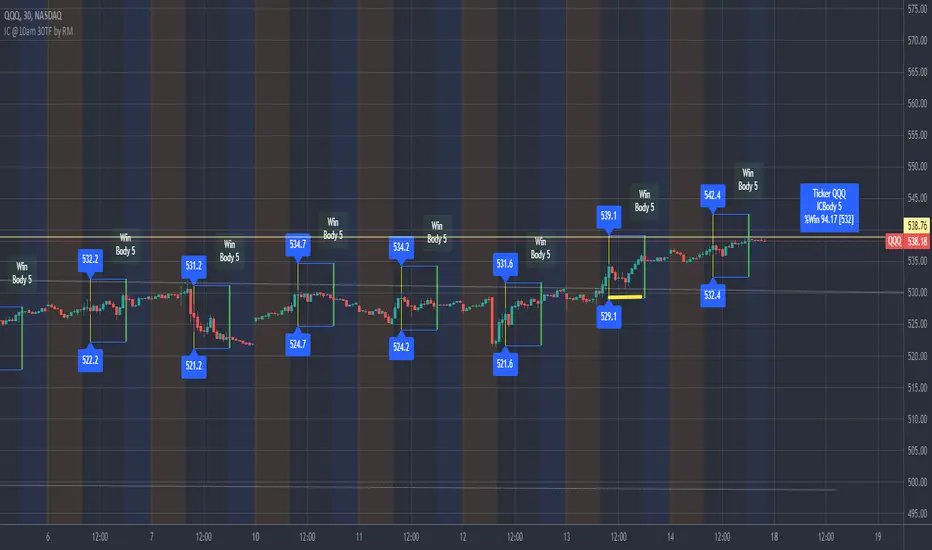
IronCondor 10am 30TF by RMThe IronCondor 10am 30TF indicator shows Iron Condor trades win rate over a large number of days.
The default ETFs in this indicators are "QQQ", "SPY", "RUT" , "CBTX" and "SPX", other entries have not been tested.
Iron Condor quick explanation:
- Iron Condors trades have four options, generally, are based around a Midpoint price (Current Market Price Strike) and
- Two equally distances Strikes for the SELL components (called the Body of the Iron Condor)
- Further away from the two SELLs, another Two BUYs for protection (not considered in this indicator)
- Iron Condors are used for Passive Income based on small gains most of the time.
The IronCondor 10am 30TF has its logic created based on the premises that:
- Most days the market prices stay within a range.
- As example the S&P market prices would stay within 1% on about 80% of the time
- The moving markets (bullish or bearish) occur about 20% of the time
- The biggest market price volatility generally occurs before market opens and then around the first hour or so of trade in the day.
- After the first hour or so of the market the prices would be most likely to stay within a range.
The operation is simple:
- At the Trade Star time in the day (say 10:30 Hrs.) draws a vertical yellow line, then
- Creates two blue horizontal lines for the SELL limits in the Iron Condor Body, at +/- 1% price boundary (check Ticker list below for values)
- At the Trade End time (say 16:00 Hrs.) checks that none of the SELL limits have been broken by highs or lows during the trade day
(The check is done calculating at Trade End time the high/lows 10 bars back for 30 min TF - timeframe)
- There is a label at each Trade End time with Win/Loss and Body value.
- There is one final label with overall calculated past performance in Win percentage out of 'n' trades
Defaults and User Entries:
- The User can modify the Midpoint price called 'IronCondor Midpoint STRIKE' (default is the Candle Close at the selected time)
- The User can modify the Body value called 'IronCondor Body' (default is the Ticker's selected value as per list below)
"QQQ" or "SPY" Body = 5
"RUT" or "CBTX" Body = 20
"SPX" Body = 60
* Disclaimer: This is not a Financial tool, it cannot used as any kind of advice to invest or risk moneys in any market,
Markets are volatile in nature - with little or no warning - and will drain your account if you are not careful.
Use only as an academic demonstrator => * Use at your own risk *
TechniTrend: Advance Custom Candle Finder (CCF)🟦 Description:
The TechniTrend: Advanced Custom Candle Finder (CCF) is a versatile tool designed to help traders identify custom candlestick patterns using various configurable criteria. This indicator provides a flexible framework to filter and highlight specific candles based on volume, volatility, candle characteristics, and other important metrics. Below is a detailed explanation of each filter and its customization options:
🟦 Volume-Based Filters
🔸Volume Spike Filter:
Enable filtering based on volume spikes. Use the Volume Spike Multiplier to define what constitutes a significant increase in volume compared to the average. A spike indicates unusually high trading interest.
🔸Volume Range Filter:
Filter candles based on specific volume ranges. Set Minimum Volume and Maximum Volume thresholds to isolate candles with trading volumes within your desired boundaries.
🟦 Candle Body & Wick Filters
🔸Body Size Filter:
Filter candles based on the size of their body. A Body Size Multiplier determines what is considered a large body relative to historical averages.
🔸Body Percentage Filter:
Filter based on the proportion of the body to the entire candle size. Use the Body Percentage Threshold to highlight candles where the body makes up a certain percentage of the total candle range.
🔸Wick-to-Body Ratio Filter:
Identify candles with specific wick-to-body ratios. A higher Wick-to-Body Ratio can indicate indecision or reversals.
🟦 Volatility & Range Filters
🔸Volatility Filter:
Highlight candles based on price changes relative to volume. The Volatility Multiplier sets the threshold for what is considered a volatile candle.
🔸Candle Range Filter:
Filter based on the range (High - Low) of each candle. Use Minimum Candle Range and Maximum Candle Range to specify your desired candle size in points or pips.
🔸Short-Term and Long-Term Volatility Filters:
Analyze volatility over different periods. Enable Short-Term Volatility or Long-Term Volatility filters to compare recent volatility against historical averages, helping you detect sudden market shifts.
🟦 Candle Color & Open/Close Filters
🔸Candle Color Filter:
Filter based on the candle's color. Choose between Bullish (close > open) or Bearish (close < open) to focus on specific market sentiments.
🔸Open/Close Price Range Filter:
Filter based on the difference between the open and close prices. Use Minimum Open/Close Range and Maximum Open/Close Range to specify your acceptable range in price movements.
🟦 Core Functionality
The CCF indicator combines these filters to provide a final signal whenever a candle meets all the enabled criteria. By default, it highlights any qualifying candle directly on the chart and changes the background color for added visibility.
🟦 Key Features:
🔸Highly Customizable Filters: Adjust the parameters for each filter to tailor the indicator to your specific needs.
🔸Multiple Conditions: Combine several conditions to identify complex candlestick patterns.
🔸Real-Time Alerts: Receive instant notifications when a matching candle pattern is found based on your custom criteria.
🟦 How to Use:
🔸Enable the filters you wish to apply (e.g., Volume Spike, Candle Body Size, Volatility).
🔸Adjust the thresholds for each filter to fine-tune the pattern recognition criteria.
🔸Observe the chart to see visual cues for candles that match your specified conditions.
🟦 Notes:
🔸Ensure that you clearly understand each filter’s role. Over-filtering with very strict criteria may reduce the number of signals.
🔸This indicator is designed to be a customizable tool, not providing buy or sell recommendations.
🔸Use in combination with other analysis tools and indicators for the best results.

Average True Range ShiftThis indicator builds on the idea of the Average True Range (ATR) as a way of measuring volatility. It uses two different ATRs to show a shift in market volatility.
It is mainly composed of two moving averages of ATR. One fast moving, which looks back at the previous 5 periods. One slow moving, which looks back at the previous 21 periods. Both ATRs have been normalized (show percentage instead of an absolute amount). The third component of this indicator is the histogram that is created by subtracting the slow moving average, from the fast moving average.
By having two ATRs of different lengths, traders can see how short term volatility compares to long term volatility, and how it is shifting over time. When the fast-moving crosses above the slow-moving, it will show a positive value on the histogram, meaning that short term volatility is increasing and higher than normal. When it crosses below, it will show a negative value on the histogram, meaning that short term volatility is decreasing, and lower than normal.
There are a variety of ways to utilize this indicator, and it will work in most markets. I find it is best to analyze macro market conditions on daily charts and above, rather than micro intraday moves.
