Premium Volume Divergence Signals [Stansbooth]Advanced Divergence Indicator
This indicator is designed to uncover the hidden relationship between price action and momentum. By accurately detecting when price and momentum move in different directions, it highlights bullish and bearish divergences at critical market points — often before reversals or strong continuations occur.
🔹 Key Features:
Precise detection of Regular and Hidden Divergence
Helps identify early market reversals
Clean, clear, and easy-to-read visual signals
Works across Forex, Crypto, and Stock markets
Suitable for all timeframes and trading styles
This indicator empowers traders to make smarter entries, confident exits, and better risk management decisions. Instead of chasing the market, it allows you to anticipate price movement with confidence.
Trade smarter, not harder — let divergence reveal the real market strength.
Marketreversal

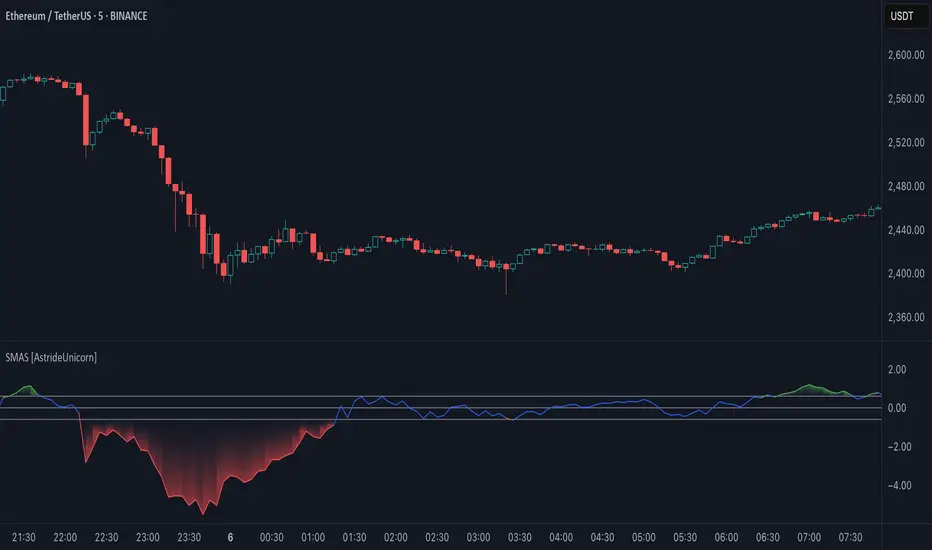
Simple Moving Average Slope [AstrideUnicorn]The Simple Moving Average Slope indicator (SMAS) is a technical analysis tool designed to help traders detect the direction and strength of the current trend in the price of an asset. It is also a great tool for identifying sideways markets. The indicator plots the slope of a simple moving average (SMA) of the closing prices over a specified time period. The slope is normalized by dividing it by the standard deviation of the slope over a longer time period.
HOW TO USE
Traders can use the Simple Moving Average Slope indicator in various ways. One common way is to look for bullish or bearish signals. A bullish signal occurs when the normalized slope rises above a predetermined threshold, resulting in the indicator turning green, indicating an upward trend in the market. Conversely, a bearish signal is generated when the normalized slope falls below the negative value of the threshold, causing the indicator to turn red, signaling a downtrend in the market. When the normalized slope falls between the positive and negative threshold values, a neutral signal is generated, indicating that the market is moving sideways. This can help traders avoid false trend signals from other indicators and strategies that may occur when the market is in a sideways regime. Additionally, traders can use the Simple Moving Average Slope indicator in conjunction with other technical indicators to confirm the trend direction.
SETTINGS
Window - specifies the number of bars used to calculate the SMA slope. The default value is 20.
Threshold - specifies the threshold value used to generate the bullish and bearish signals. The default value is 0.6. Traders can adjust these settings based on their trading strategy and the asset being analyzed.
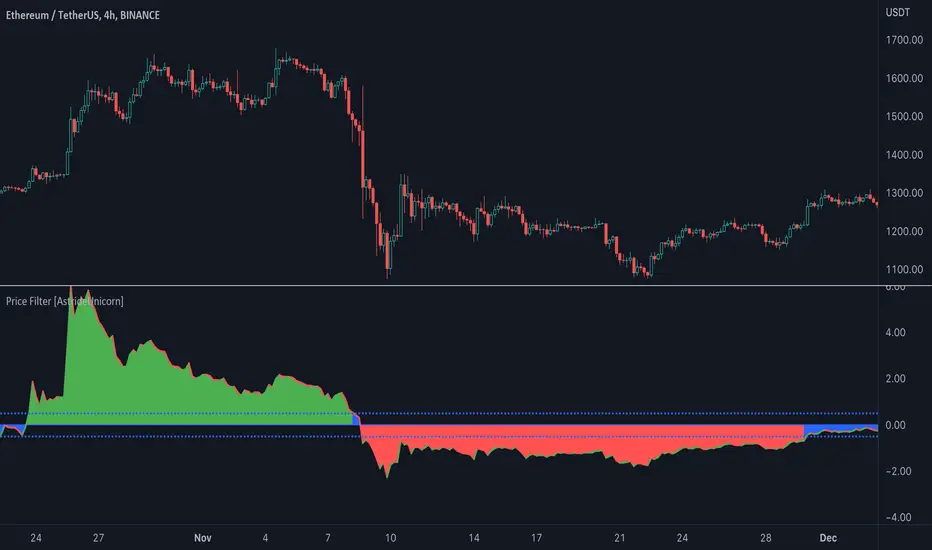
Price Filter [AstrideUnicorn]The indicator calculates a fast price filter based on the closing price of the underlying asset. Overall, it is intended to provide a fast, reliable way to detect trend direction and confirm trend strength, using statistical measures of price movements.
The algorithm was adapted from Marcus Schmidberger's (2018) article "High Frequency Trading with the MSCI World ETF". It demeans the price time series using the long-term average and then normalizes it with the long-term standard deviation. The resulting time series is then compared to specified thresholds to determine the trend direction.
HOW TO USE
The indicator surface is colored green if the price is trending upwards and red if the price is trending downwards. If the indicator outline is the opposite color of the indicator surface, it indicates that the price is moving against the trend and the current trend may be losing strength.
If the 'Use threshold' setting is enabled, the indicator will be colored blue if its value is within the range defined by the upper and lower thresholds. This indicates that the price is trending sideways, or that the current trend is losing strength.
SETTNGS
Length - the length of the long-term average used to calculate the price filter. Recommended range 20 - 200. The sensitivity of the indicator increases as the value becomes smaller, allowing it to detect smaller price moves and swings earlier.
Threshold - the threshold value used to detect trend direction.
Use threshold - a boolean (true/false) input that determines whether to use the threshold value for confirmation.