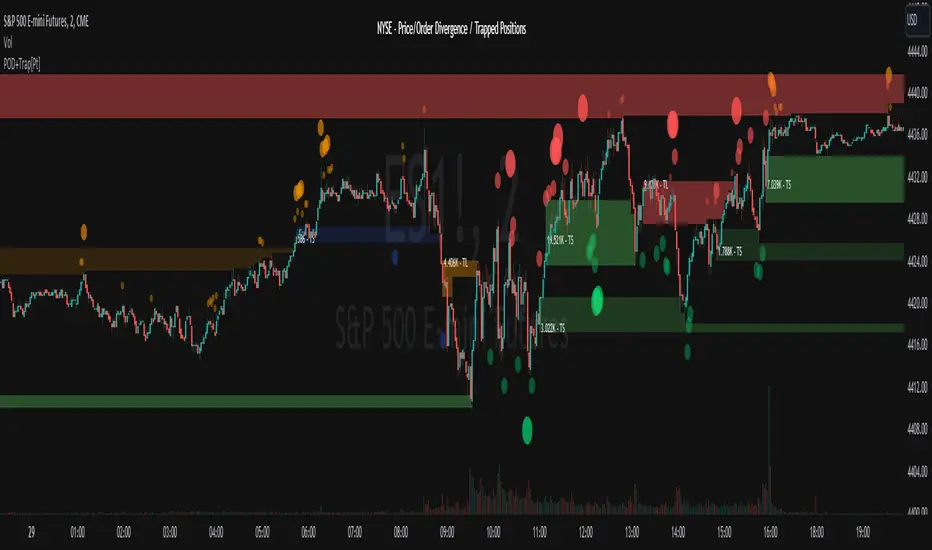
Market Price Order Divergence + Trapped Positions [Pt]█ Introduction
Specifically designed for trading on NYSE, NASDAQ, Dow Jones, and AMEX related instruments like SPY, QQQ, ES, NQ...etc., this innovative tool provides traders with advanced market insights to help them comprehend the market intricacies and make well-informed decisions. Comprising three primary features: Price Order Divergence (POD) Bubbles, Market Order Bubbles, and Trapped Positions/Zones, this tool assists traders in deciphering the nuances of market order flow and trends.
An important point to note is that TradingView doesn't currently provide direct access to market order data, such as buy and sell order flow. Therefore, this tool cleverly leverages TICK index data to estimate the overall market buy and sell strength.
█ Price Order Divergence (POD)
POD serves to detect disparities between the prices of US indices and estimated market orders during regular trading hours (9:30 to 16:00 EST). Bullish divergence indicates that the estimated market order flow is biased towards buy orders, despite bearish price action. In contrast, bearish divergence indicates that the market order flow is biased towards sell orders while the price exhibits bullish action. By default, PODs are visually represented as green bubbles under the candle for bullish divergence and red ones above the candle for bearish divergence. The bubble's size symbolizes the estimated market order strength.
█ Market Order Bubbles (MOB)
During extended or Globex hours, instead of POD, the tool uses Market Order Bubbles (MOB) to estimate market orders using volume data. Sophisticated algorithm is used to distinguish between bullish vs bearish volume. A strong bullish volume represents significant buy orders, whereas a strong bearish volume represents substantial sell orders. By default, MOBs during these hours are shown in blue for bullish and yellow for bearish divergence. Again, the bubble's size symbolizes the estimated market order strength.
█ Trapped Positions/Zones
Trapped positions materialize when PODs or MOBs emerge in trending markets. For example, a bearish divergence during an uptrend suggests significant selling (including shorting), and if the price continues ascending without offering short positions any profit, these positions become 'trapped shorts' and is shown as 'TS' in the zone. The opposite is true for 'trapped longs' or 'TL'.
A price range zone can be delineated from the trapped position candles. If prices revisit these zones, and the prevailing market trend stays bullish, the trapped shorts will probably liquidate near the break-even point to mitigate losses. The same rationale applies to bullish divergence in a downtrend. Therefore, these zone often times represents support / resistance zones.
█ Potential Use Cases
► Trend Confirmation: POD or MOB can confirm the strength of an ongoing trend. For example, during a bullish trend, a plethora of green bubbles or blue MOBs can affirm the trend's solidity.
► Spotting Reversals: Large, isolated POD or MOB bubbles could indicate potential market reversals. For instance, a prominent red bubble or yellow MOB during an uptrend might hint at an impending trend reversal.
► Risk Management: The Trapped Positions/Zones feature could assist in risk management. When prices approach these zones, traders can anticipate potential large market orders impacting price movements.
► Profit Optimization: This tool can aid traders in optimizing profits by identifying when trapped positions are likely to liquidate, thus predicting potential sharp price movements.
Remember, as with any tool, this should be used alongside other market analyses and not as a standalone indicator. Happy trading!
================================================================================================================
█ Settings Overview
◊ Market - available options: NYSE, NASDAQ, Dow Jones, AMEX. This will be displayed
◊ Lookback period- # of bars to lookback for detecting price vs market order divergences
▼ Regular Hour - Price Order Divergence Bubbles
◊ Show Price Order Divergence (POD) Bubbles - toggle on/off for POD bubbles
◊ └ Use Market Order Sentiment only - Shows divergences between price movement and market order sentiment (amount of buying vs selling)
◊ └ Use Market Order Trend Bias - On top of market order sentiment, the indicator also looks at overall market short term trends to determine divergences
◊ └ Use Threshold Min. Threshold - For filtering order size, the lower the threshold, the more sensitive
◊ └ Use Volume Strength - Take volume into consideration as well, only shows divergence when there is strength in volume
▼ Extended Hour - Market Order Bubbles
◊ Show Market Order Bubbles - toggle on/off for MOB. Using volume data to estimate significant market order activities. Bubbles indicate possible large liquidation activities
◊ └ Volume Analysis period - lookback period for volume analysis
◊ └ Volume Strength period - lookback period for volume strength
▼ Trapped Position Zones
◊ Show Potential Traps - toggle on/off for un-activated trapped zones. They are shown as lightly shaded areas of potential traps. These areas will be activated once price hit the activation %
◊ Show Trapped positions (Regular Hours) - toggle on/off for POD trapped zones. By default, trapped shorts are shown in green, trapped tongs are shown in red.
◊ Show Trapped positions (Extended Hours) - toggle on/off for MOB bubbles. By default, trapped shorts are shown in blue, trapped tongs are shown in orange.
◊ └ Activation % - Trapped zones are activated if price goes x% of the potential trapped range in the undesirable direction. Default is 100%
◊ Liquidate display options - options: On first touch, Per touch, Fully liquidated
Trapped zones liquidate display options:
▼ Display
◊ General color settings for bubbles, trapped zones, and label size
◊ Use Emoji for bubbles - fun setting that displays bulls and bears by default. This helps really visualize where the bulls and bears are! 🤣🤣 These emoji can be changed in the style setting.
▼ Trapped Zone Channel
The trapped zone channel represents a continuous channel of the closest activated trapped zone area. This allows for creating alerts for trapped zones, and the plot outputs allows for custom Pinescript integration.
◊ Trapped Zone Channel Buffer % - Adds upper and lower buffer for trapped zone channel
◊ Show Trapped Channel - toggle on/off on trapped zone channels
◊ └ Remove channel changing lines - toggle on/off the transition plot lines when switching to the closest trapped zones
◊ Show Trapped Channel Fill - toogl
▼ Extra
◊ Display settings for chosen market and indicator title
▼ Trend Follower
◊ Show Trend Following Bar Color - toggle trend follower algorithm. This is an experimental trend following algorithm that attempts to detect bullish, neutral and bearish trends.
▼ Outputs
◊ Output Bubbles
Outputs for Bubbles for external interface. These can be used as inputs to your own indicator or strategy Pinescript. For more info, take a look at this TradingView blog:
www.tradingview.com
Bubble type can be chosen within the settings:
Both - Default, output will include both Market Price Order Divergence Bubbles (during Regular Hours) and Market Order Bubbles (during Extended Hours)
POD Only (RTH) - Output will include only Market Price Order Divergence Bubbles; otherwise, output = 0 during Extended Hours
MOB Only (ETH) - Output will include only Market Order Bubbles; otherwise, output = 0 during Regular Hours
Market Order Bubbles output values:
3 = Large size Bullish Bubble
2 = Medium size Bullish Bubble
1 = Small size Bullish Bubble
0 = No Bubble
-1 = Small size Bearish Bubble
-2 = Medium size Bearish Bubble
-3 = Large size Bearish Bubble
Marketorderbubbles
Market Order Bubbles + Trapped Positions [Pt]"Market Order Bubbles + Trapped Positions" is a multifaceted TradingView indicator, employing volume data to depict intensified market activities. By highlighting aggressive buying/selling behaviors, this tool serves as a dependable aid in pinpointing potential trading reversals. Additionally, it proves an effective device for real-time market trend monitoring. The unique ability of this indicator to spotlight 'Trapped Positions'—resulting from such vigorous trading activity—helps identify crucial price levels or ranges that may lead to significant price responses.
Market Order Bubbles
The Market Order Bubbles feature capitalizes on volume data to estimate market orders. High bullish volume is indicative of a surge in buy orders, while strong bearish volume flags an increase in sell orders. These orders are visually represented by bubbles of different sizes, corresponding directly to the volume strength, thus providing traders with an immediate, intuitive understanding of market activity.
Trapped Positions/Zones
The concept of Trapped Positions emerges when sizable buy orders appear during a bearish market trend, or vice versa. For instance, if a considerable sell order is detected during a bullish uptrend, it signifies that those short positions may be 'trapped'. These positions help in plotting potential price range zones. When the price revisits these zones and the market trend maintains its bullish inclination, trapped shorts might opt for liquidation near break-even to mitigate losses. The reverse holds true in a bearish downtrend.
Trend Follower
The Trend Follower feature is a supportive tool that aims to discern price trends, color-coding candle bars for clarity. This function assists traders by presenting a simplified view of the prevailing trend, helping to minimize distractions caused by minor price shifts.
The utility of the Trend Follower is its ability to aid traders in focusing on the larger market direction. It allows traders to concentrate on the more substantial trend and make decisions that align with this broader market movement, rather than reacting to every minor price fluctuation. As a result, this feature may support traders in maintaining their positions for a longer duration, which could potentially enhance their trading outcomes. The Trend Follower, therefore, offers a helpful contribution to a balanced and effective trading approach.
In essence, the "Market Order Bubbles + Trapped Positions" indicator with its Trend Follower feature provides traders with a comprehensive understanding of market dynamics, allowing them to navigate the financial markets with increased precision and confidence. Its unique features, designed to highlight significant market activities and trends, can greatly aid in refining trading strategies, making it a potentially invaluable tool in a trader's arsenal.

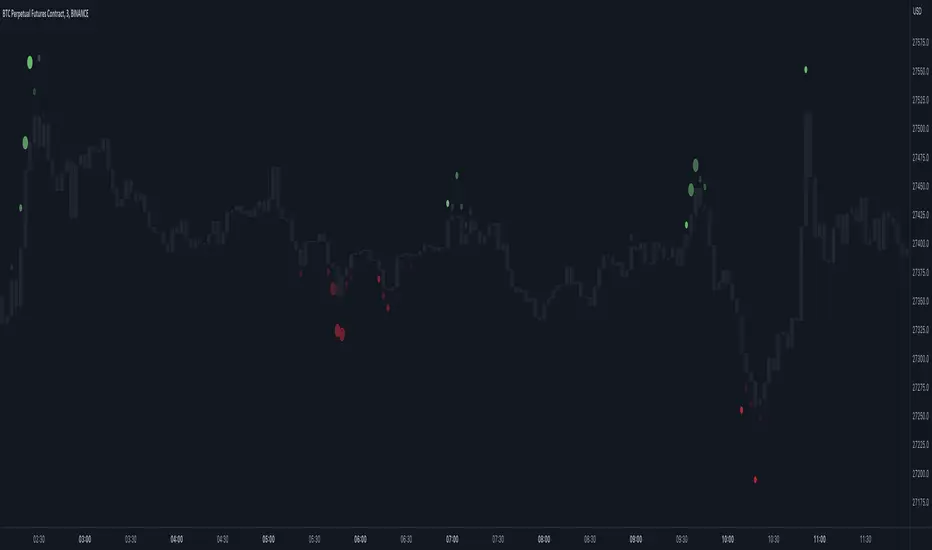
Market Order Bubbles - By Leviathan"Market Order Bubbles" is a volume-based indicator that helps visualize the occurrences of increased aggressiveness in market buying/selling and can serve as a useful confluence for trading reversals or as a simple tool for observing real-time market dynamics.
I created Market Order Bubbles six months ago as an additional tool included in my Liquidation Levels script. Due to their popularity, I decided to publish them as a standalone indicator with some new features. The script is based on a calculation that uses volume data (imitation of CVD) and price action to estimate where there is a surge in the quantity and magnitude of market buy and sell orders. These occurrences are visualized with circles (bubbles) that appear above the bar (market buy orders) or below the bar (market sell orders). Most of the time, the approach to interpreting the bubbles is contrarian, meaning that the appearance of Market Buy Order Bubbles can serve as a confluence to look for shorts, and the appearance of Market Sell Order Bubbles can serve as a confluence to look for longs.
The concept behind taking a contrarian approach:
Market Buy Order Bubbles appear above the price and possibly signal the following:
- Short positions being liquidated (exit short = buy order)
- New traders entering late longs based on FOMO (enter long = buy order)
- Smarter traders getting their limit sell orders filled by aggressive buyers/stopped out shorts
⇒ Possible reversal to the downside / short-term pullback / start of ranging price action (PA)
Market Sell Order Bubbles appear below the price and possibly signal the following:
- Long positions being liquidated (exit long = sell order)
- New traders entering late shorts based on FOMO (enter short = sell order)
- Smarter traders getting their limit buy orders filled by aggressive sellers/stopped out longs
⇒ Possible reversal to the upside / short-term pullback / start of the ranging PA
These events are identified and filtered by EMA and STDEV-based "thresholds," which can be modified in the indicator settings.
1. If the buy/sell volume exceeds the first threshold, a Small Bubble is displayed.
2. If the buy/sell volume surpasses the second threshold, a Medium Bubble is displayed.
3. If the buy/sell volume exceeds the third threshold, a Large Bubble is displayed.
Increasing the multipliers effectively increases the threshold for a given bubble to appear, making the conditions for its occurrence more strict.
Decreasing the multipliers effectively decreases the threshold for a given bubble to appear, making the conditions for its occurrence less strict.
Settings Overview
"Bubble Position" - Choose whether the bubbles are displayed above/below the candle, at the candle high/low, or at the intrabar POC of the candle.
"Strength Gradient Color" - This option adjusts the transparency of the bubble's color relative to the volume on that bar.
"Threshold EMA Length" - Choose the length of the EMA used for determining the thresholds.
"Threshold STDEV Length" - Choose the length of the ta.stdev() function used on the EMA.
"Appearance Delay" - This input allows you to delay the appearance of the bubble for x number of bars. The default is 0.
"Show POC" - Show/hide intrabar POCs displayed as "-".
"Timeframe-Adjusted Settings" - Different timeframes might require different parameters. In this section, you can set custom parameters (Lengths and Multipliers) for four different timeframes, and the script will automatically switch to those settings as you browse through different timeframes.