Count█ OVERVIEW
A library of functions for counting the number of times (frequency) that elements occur in an array or matrix.
█ USAGE
Import the Count library.
import joebaus/count/1 as c
Create an array or matrix that is a `float`, `int`, `string`, or `bool` type to count elements from, then call the count function on the array or matrix.
id = array.from(1.00, 1.50, 1.25, 1.00, 0.75, 1.25, 1.75, 1.25)
countMap = id.count() // Alternatively: countMap = c.count(id)
The "count map" will return a map with keys for each unique element in the array or matrix, and with respective values representing the number of times the unique element was counted. The keys will be the same type as the array or matrix counted. The values will always be an `int` type.
array mapKeys = countMap.keys() // Returns unique keys
array mapValues = countMap.values() // Returns counts
If an array is in ascending or descending order, then the keys of the map will also generate in the same order.
intArray = array.from(2, 2, 2, 3, 4, 4, 4, 4, 4, 6, 6) // Ascending order
map countMap = intArray.count() // Creates a "count map" of all unique elements
array mapKeys = countMap.keys() // Returns // Ascending order
array mapValues = countMap.values() // Returns count
Include a value to get the count of only that value in an array or matrix.
floatMatrix = matrix.new(3, 3, 0.0)
floatMatrix.set(0, 0, 1.0), floatMatrix.set(1, 0, 1.0), floatMatrix.set(2, 0, 1.0)
floatMatrix.set(0, 1, 1.5), floatMatrix.set(1, 1, 2.0), floatMatrix.set(2, 1, 2.5)
floatMatrix.set(0, 2, 1.0), floatMatrix.set(1, 2, 2.5), floatMatrix.set(2, 2, 1.5)
int countFloatMatrix = floatMatrix.count(1.0) // Counts all 1.0 elements, returns 5
// Alternatively: int countFloatMatrix = c.count(floatMatrix, 1.0)
The string method of count() can use strings or regular expressions like "bull*" to count all matching occurrences in a string array.
stringArray = array.from('bullish', 'bull', 'bullish', 'bear', 'bull', 'bearish', 'bearish')
int countString = stringArray.count('bullish') // Returns 2
int countStringRegex = stringArray.count('bull*') // Returns 4
To count multiple values, use an array of values instead of a single value. Returning a count map only of elements in the array.
countArray = array.from(1.0, 2.5)
map countMap = floatMatrix.count(countArray)
array mapKeys = countMap.keys() // Returns keys
array mapValues = countMap.values() // Returns counts
Multiple regex patterns or strings can be counted as well.
stringMatrix = matrix.new(3, 3, '')
stringMatrix.set(0, 0, 'a'), stringMatrix.set(1, 0, 'a'), stringMatrix.set(2, 0, 'a')
stringMatrix.set(0, 1, 'b'), stringMatrix.set(1, 1, 'c'), stringMatrix.set(2, 1, 'd')
stringMatrix.set(0, 2, 'a'), stringMatrix.set(1, 2, 'd'), stringMatrix.set(2, 2, 'b')
// Count the number of times the regex patterns `'^(a|c)$'` and `'^(b|d)$'` occur
array regexes = array.from('^(a|c)$', '^(b|d)$')
map countMap = stringMatrix.count(regexes)
array mapKeys = countMap.keys() // Returns
array mapValues = countMap.values() // Returns
An optional comparison operator can be specified to count the number of times an equality was satisfied for `float`, `int`, and `bool` methods of `count()`.
intArray = array.from(2, 2, 2, 3, 4, 4, 4, 4, 4, 6, 6)
// Count the number of times an element is greater than 4
countInt = intArray.count(4, '>') // Returns 2
When passing an array of values to count and a comparison operator, the operator will apply to each value.
intArray = array.from(2, 2, 2, 3, 4, 4, 4, 4, 4, 6, 6)
values = array.from(3, 4)
// Count the number of times and element is greater than 3 and 4
map countMap = intArray.count(values, '>')
array mapKeys = countMap.keys() // Returns
array mapValues = countMap.values() // Returns
Multiple comparison operators can be applied when counting multiple values.
intMatrix = matrix.new(3, 3, 0)
intMatrix.set(0, 0, 2), intMatrix.set(1, 0, 3), intMatrix.set(2, 0, 5)
intMatrix.set(0, 1, 2), intMatrix.set(1, 1, 4), intMatrix.set(2, 1, 2)
intMatrix.set(0, 2, 5), intMatrix.set(1, 2, 2), intMatrix.set(2, 2, 3)
values = array.from(3, 4)
comparisons = array.from('<', '>')
// Count the number of times an element is less than 3 and greater than 4
map countMap = intMatrix.count(values, comparisons)
array mapKeys = countMap.keys() // Returns
array mapValues = countMap.values() // Returns
MAP

CommonTypesMapUtilLibrary "CommonTypesMapUtil"
Common type Container library, for central usage across other reference libraries.
ArrayBool
Fields:
v (bool )
ArrayBox
Fields:
v (box )
ArrayPoint
Fields:
v (chart.point )
ArrayColor
Fields:
v (color )
ArrayFloat
Fields:
v (float )
ArrayInt
Fields:
v (int )
ArrayLabel
Fields:
v (label )
ArrayLine
Fields:
v (line )
ArrayLinefill
Fields:
v (linefill )
ArrayString
Fields:
v (string )
ArrayTable
Fields:
v (table )

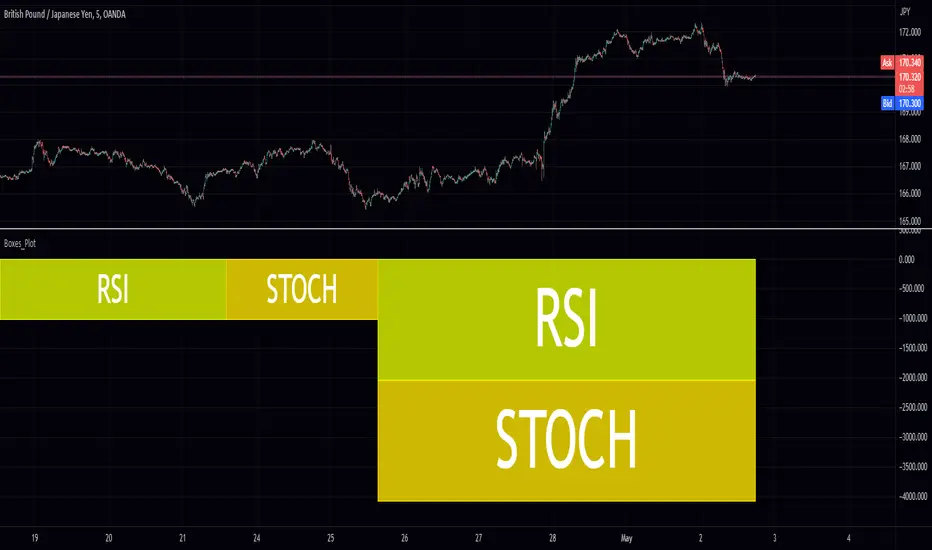
Boxes_PlotIn the world of data visualization, heatmaps are an invaluable tool for understanding complex datasets. They use color gradients to represent the values of individual data points, allowing users to quickly identify patterns, trends, and outliers in their data. In this post, we will delve into the history of heatmaps, and then discuss how its implemented.
The "Boxes_Plot" library is a powerful and versatile tool for visualizing multiple indicators on a trading chart using colored boxes, commonly known as heatmaps. These heatmaps provide a user-friendly and efficient method for analyzing the performance and trends of various indicators simultaneously. The library can be customized to display multiple charts, adjust the number of rows, and set the appropriate offset for proper spacing. This allows traders to gain insights into the market and make informed decisions.
Heatmaps with cells are interesting and useful for several reasons. Firstly, they allow for the visualization of large datasets in a compact and organized manner. This is especially beneficial when working with multiple indicators, as it enables traders to easily compare and contrast their performance. Secondly, heatmaps provide a clear and intuitive representation of the data, making it easier for traders to identify trends and patterns. Finally, heatmaps offer a visually appealing way to present complex information, which can help to engage and maintain the interest of traders.
History of Heatmaps
The concept of heatmaps can be traced back to the 19th century when French cartographer and sociologist Charles Joseph Minard used color gradients to visualize statistical data. He is well-known for his 1869 map, which depicted Napoleon's disastrous Russian campaign of 1812 using a color gradient to represent the dwindling size of Napoleon's army.
In the 20th century, heatmaps gained popularity in the fields of biology and genetics, where they were used to visualize gene expression data. In the early 2000s, heatmaps found their way into the world of finance, where they are now used to display stock market data, such as price, volume, and performance.
The boxes_plot function in the library expects a normalized value from 0 to 100 as input. Normalizing the data ensures that all values are on a consistent scale, making it easier to compare different indicators. The function also allows for easy customization, enabling users to adjust the number of rows displayed, the size of the boxes, and the offset for proper spacing.
One of the key features of the library is its ability to automatically scale the chart to the screen. This ensures that the heatmap remains clear and visible, regardless of the size or resolution of the user's monitor. This functionality is essential for traders who may be using various devices and screen sizes, as it enables them to easily access and interpret the heatmap without needing to make manual adjustments.
In order to create a heatmap using the boxes_plot function, users need to supply several parameters:
1. Source: An array of floating-point values representing the indicator values to display.
2. Name: An array of strings representing the names of the indicators.
3. Boxes_per_row: The number of boxes to display per row.
4. Offset (optional): An integer to offset the boxes horizontally (default: 0).
5. Scale (optional): A floating-point value to scale the size of the boxes (default: 1).
The library also includes a gradient function (grad) that is used to generate the colors for the heatmap. This function is responsible for determining the appropriate color based on the value of the indicator, with higher values typically represented by warmer colors such as red and lower values by cooler colors such as blue.
Implementing Heatmaps as a Pine Script Library
In this section, we'll explore how to create a Pine Script library that can be used to generate heatmaps for various indicators on the TradingView platform. The library utilizes colored boxes to represent the values of multiple indicators, making it simple to visualize complex data.
We'll now go over the key components of the code:
grad(src) function: This function takes an integer input 'src' and returns a color based on a predefined color gradient. The gradient ranges from dark blue (#1500FF) for low values to dark red (#FF0000) for high values.
boxes_plot() function: This is the main function of the library, and it takes the following parameters:
source: an array of floating-point values representing the indicator values to display
name: an array of strings representing the names of the indicators
boxes_per_row: the number of boxes to display per row
offset (optional): an integer to offset the boxes horizontally (default: 0)
scale (optional): a floating-point value to scale the size of the boxes (default: 1)
The function first calculates the screen size and unit size based on the visible chart area. Then, it creates an array of box objects representing each data point. Each box is assigned a color based on the value of the data point using the grad() function. The boxes are then plotted on the chart using the box.new() function.
Example Usage:
In the example provided in the source code, we use the Relative Strength Index (RSI) and the Stochastic Oscillator as the input data for the heatmap. We create two arrays, 'data_1' containing the RSI and Stochastic Oscillator values, and 'data_names_1' containing the names of the indicators. We then call the 'boxes_plot()' function with these arrays, specifying the desired number of boxes per row, offset, and scale.
Conclusion
Heatmaps are a versatile and powerful data visualization tool with a rich history, spanning multiple fields of study. By implementing a heatmap library in Pine Script, we can enhance the capabilities of the TradingView platform, making it easier for users to visualize and understand complex financial data. The provided library can be easily customized and extended to suit various use cases and can be a valuable addition to any trader's toolbox.
Library "Boxes_Plot"
boxes_plot(source, name, boxes_per_row, offset, scale)
Parameters:
source (float ) : - an array of floating-point values representing the indicator values to display
name (string ) : - an array of strings representing the names of the indicators
boxes_per_row (int) : - the number of boxes to display per row
offset (int) : - an optional integer to offset the boxes horizontally (default: 0)
scale (float) : - an optional floating-point value to scale the size of the boxes (default: 1)
Object: object oriented programming made possible! Hash map's in Pinescript?? Absolutely
This Library is the first step towards bringing a much needed data structure to the Pine Script community.
"Object" allows Pine coders to finally create objects full or unique key:value pairs, which are converted to strings and stored in an array. Data can be stored and accessed using dedicated get and set methods.
The workflow is simple, but has a few nuances:
0. Import this library into your project; you can give it whatever alias you'd like (I'll be using obj)
1. Create your first object using the obj.new() method and assign it a variable or "ID".
2. Use the object's ID as the first argument into the obj.set() method, for the key and value there's one extra step required. They must be added as arguments to the appropriate prop_() method.
Note: While objects in this library technically only store data as strings, any primitive data type can be converted to a string before being stored, meaning that one object can hold data from multiple types at once. There's a trade off though..Pine Script requires that all exported function parameters have pre-defined types, meaning that as convenient as it would be to have a single method for storing and returning data of every type, it's not currently possible. Instead there are functions to add properties for each individual type, which are then converted to strings automatically (the original type is flagged and stored along with the data). Furthermore, since switch/if statements can only return values of the same type, there must also be "get" methods which correspond with each type. Again, a single "get" method which auto-detects the returned value's type was the goal but it's just not currently possible. Instead each get method is only allowed to return a value of its own type. No worries though, all the "get" methods will throw errors if they can't access the data you're trying to access. In that error message, you'll be informed exactly which "get" method you need to use if you ever lose track of what type of data you should be returning.
3. The second argument for obj.set() method is the obj.prop_() method. You just plug in your key as a string and your value and you're done. Easy as that.
Please do not skip this step, properties must be formatted correctly for data to be stored and accessed correctly
4. Obj.get_ (s: string, f: float, b: bool, i: int) methods are even easier, just choose whichever method will return the data type you need, then plug in your ID, and key and that's it. Objects will output data of the same type they were stored as!
There's a short example at the end of the script if you'd like to see more!
prop_string(string: key, string: value)
returns property formatted to string and flagged as string type
prop_float(string: key, float: value)
returns property formatted to string and flagged as float type
prop_bool(string: key, bool: value)
returns property formatted to string and flagged as bool type
prop_int(string: key, int: value)
returns property formatted to string and flagged as int type
Support for lines and shapes coming soon!
new()
returns an empty object
set(string : ID, string: property)
adds new property to object
get_f(string : ID, string: key)
returns float values
get_s(string : ID, string: key)
returns string values
get_b(string : ID, string: key)
returns boolean values
get_i(string : ID, string: key)
returns int values
More methods like Obj.remove(), Obj.size(), Obj.fromString, Obj.fromArray, Obj.toJSON, Obj.keys, & Obj.values coming very soon!!
