Consensio Allocation ToolOriginally created and taught by Taylor Jenks, this indicator provides portfolio allocation suggestions based on the behaviour of price and 3 simple moving averages (4/10/40 by default)
(ie. when short & medium term SMAs are above the long term then allocation is to be 100%).
This percentage allocated to the stock/commodity is to be reduced as it passes below the SMA's, particularly as each moving average crosses.
Consensio is useful for scaling in and out of a position as the portfolio allocation will change according to the momentum of the asset.
The rules below are my own based on understanding of the trading system developed by Jenks and his online content.
This script has the following rules:
if fastAboveSlowMA and not mediumAboveSlowMA
allocation := 30.0
else if longAboveFastMA
allocation := 0.0
else if fastAboveMediumMA and fastAboveSlowMA
allocation := 100.0
else if not fastAboveMediumMA and fastAboveSlowMA
allocation := 80.0
else if not fastAboveMediumMA and not fastAboveSlowMA
allocation := 50.0
else if not mediumAboveSlowMA and fastAboveSlowMA
allocation := 50.0
// Calculate adjusted allocation percentage based on crossing moving averages
allocation := allocation + (priceAboveFastMA ? 10.0 : -10.0)
allocation := allocation + (priceAboveMediumMA ? 10.0 : -10.0)
Management

Average Cost (Costo Promedio)ENGLISH
This 'Average Cost' script allows the user to input and visualize profit or loss for different stocks (up to 50) with average cost and quantity data on a single chart. This is useful for tracking the profit or loss of each stock in real-time.
To use this script, the user should follow these steps:
1. Add the 'Average Cost' script to your TradingView chart.
2. In the script's configuration window, input the tickers, average costs, and quantity of shares for each ticker you want to monitor.
3. Click 'Accept' to apply the changes.
This script is primarily designed for stock markets, but can also be useful in other financial markets where the user is interested in tracking the performance of multiple assets.
ESPAÑOL
Este script de "Costo Promedio" permite al usuario ingresar y visualizar si hay ganancia o perdida para diferentes acciones (hasta 50) con los datos de costos promedio y cantidad de acciones en un solo gráfico. Esto es útil para realizar un seguimiento de la ganancia o pérdida de cada acción en tiempo real.
Para utilizar este script, el usuario debe seguir estos pasos:
1. Agregue el script "Costo Promedio" a su gráfico en TradingView.
2. En la ventana de configuración del script, ingrese los tickers, costos promedio y cantidad de acciones para cada ticker que desee monitorear.
3. Haga clic en "Aceptar" para aplicar los cambios.
Este script está diseñado principalmente para los mercados de acciones, pero también puede ser útil en otros mercados financieros donde el usuario esté interesado en rastrear el rendimiento de múltiples activos.

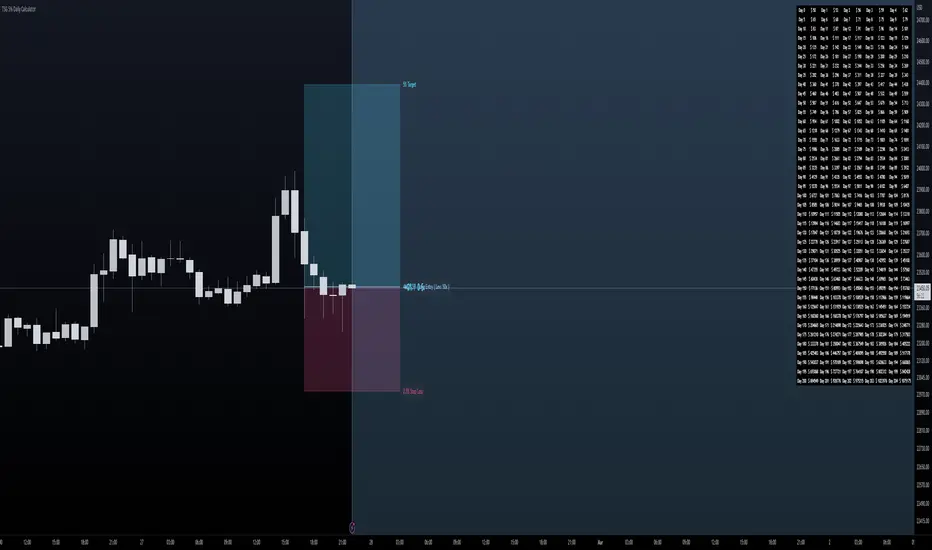
TSG 5% Daily CalculatorThis is a calculator I've created to help visualize Target and Risk Levels based on leverage use to trade crypto.
How to use it ?
Basic Use:
- Set the Direction of your trade - either Long or Short
- Set the Leverage you use in your trade - it is crutial to define the risk and target levels
- Set the Risk Amount you want to risk (in %) of your total balance ( Advised 2-3% )
- Set the Target Amount you want to profit at the target (the idea of this is 5% daily, so 5%).
- Set Entry Price if you have opened a position, and you will visually see your progress. Otherwise the levels will be adjusted to the Close of the candle.
Additions:
- Set your Initial Balance - to help you visualize on the Table your progress
- Set your Current Balance - for visualization purposes on ongoing trades and on the Table
- Entry Date - Advised to set it when you open a trade - you will be tracking the progress of your trade since the candle on which you opened it
- Show Table - to show the table of 5% daily and the target it is set on per day
- Table Size - Set table to be small or normal
- Together with the Table you have a big blue area behind that ends on the day you will become a Millionaire based on the Initial Balance, Current balance and Target % in your inputs
RISK MANAGEMENTHi dear Traders,
Here I would present you my 'Risk Management' tool which is based on your buy orders, trading fees and your desired benefit.
Easily, fulfill the price and volume of each entries. Add to this, you can prepare the info about your next proposed entries, just let them not check at first and by meeting the prices then active the check-box beside it.
Two line will be presented on your candle-plot, one of the indicate the place that without any lose/win you can exit and also the desired exit position by considering user defined benefit.
Use it for free but please do not forget to boost the script.
Best regards and happy trading.
Shakib

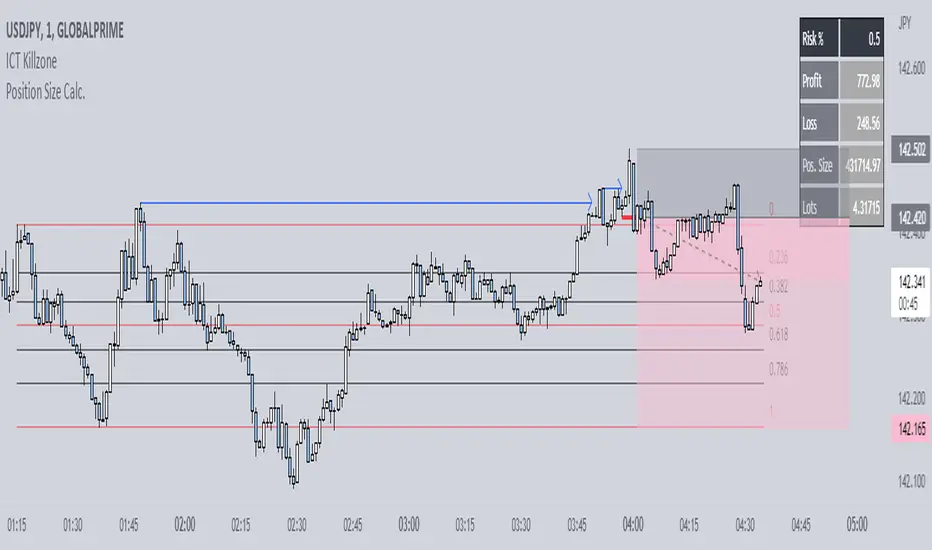
Position Size Calc. (Minimalist)This is a simplified position size calculator in the form of a table.
The reason I published this script is because all other position size calculator scripts try to provide way too much when it should be much simpler, position in strange areas of the chart and leave unwanted chart pollution.
This is a bare-bones functional table that takes your risk level, entry, stop and take profit as inputs, and calculates your loss, profit and required position size for your chosen risk level as a result.
Inspired by a table type position size calculator made by DojiEmoji design/color-wise. Functionally different however.
I hope you find this script useful and include it on your trading journey.
LevelsManagerLibrary "LevelsManager"
TODO: Track up to 6 TakeProfits and 1 StopLoss achievement for one or many of your buy/sell conditions.
manageTrade(bool, bool, bool, string, string, float, float, bool, bool, bool, bool, bool, bool, float, float, float, float, float, float, float)
Track TakeProfits and StopLoss achievement for one or many of your buy/sell conditions. CHECK the commented section: "Function @manageTrade" for Description
Parameters:
bool : useSignal.
bool : b_gameOVer.
bool : b_gameOVer.
string : bName.
string : sName.
float : buyEntrySource.
float : sellEntrySource.
bool : useTp1.
bool : useTp2.
bool : useTp3.
bool : useTp4.
bool : useTp5.
bool : useTp6.
float : tp1x.
float : tp2x.
float : tp3x.
float : tp4x.
float : tp5x.
float : tp6x.
float : slx.
Returns: check commented section: "Function @manageTrade".
showOnlyFirstOccurence(booleanInput)
Single out the occurence of a bool series between to 2 bool series.
Parameters:
booleanInput : to activate or deactivate occurences filtering.
Returns: filterred or not bool series.

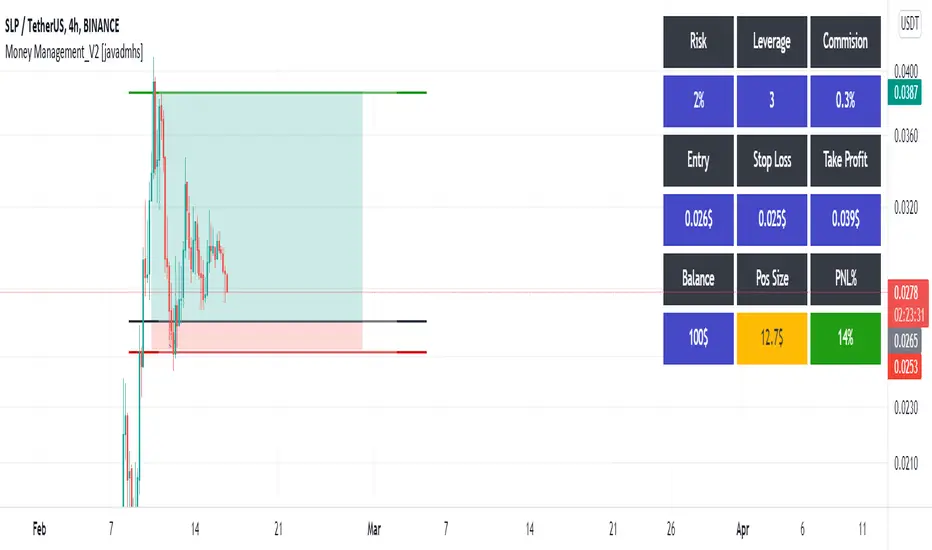
Money Management_V2 [javadmhs]Hi every one
you can use this indicator in your trades for money and risk management.
Very easy to use. Just enter the requested information of your trade and see the amount of money you need to enter into a transaction. Also you can see your pnl%.
Risk = The amount of money that if you lose, does not matter to you. This will be a percentage of your total capital.
Balance = your total capital.
Leverage = If you trade in future, you can use this. set it 1 in spot.
Commision = The amount of exchange fee.
Usable Cap = The amount of money you should enter into a transaction, depending on your risk.
PNL% = Amount of profit and loss.
You Can use this for Short and Long.
Let me know if you see a problem.
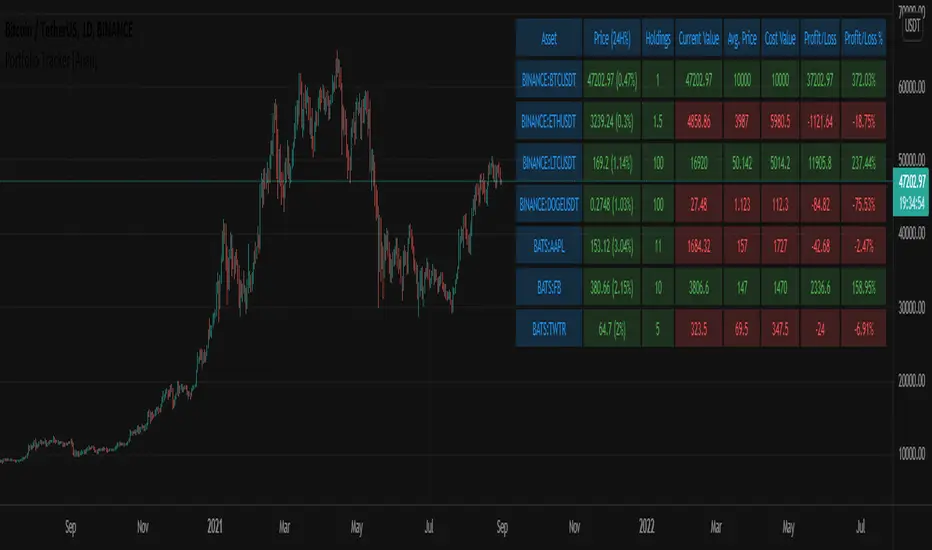
Portfolio Tracker [Anan]█ OVERVIEW
A simple Portfolio Tracker to track your Profit/Loss for any ticker in any market (stock, futures, index, forex, crypto, fund, dr.).
You just need to input (Asset / Quantity / Avg. Buy/Sell Price) and the script will calculate everything.
Also, you can use it for paper trading, or even what-if cases..
█ FEATURES
- Up to 10 positions
- Track your position real-time price and 24H change %
- Calculate your position current value
- Calculate your position cost value
- Calculate Profit/Loss
- Calculate Profit/Loss %
- Change every color in the table as you like.
Gold-Stocks RatioA historic risk-off flag.
When the Gold-Stocks Ratio is above the 200 week moving average, investors may fair better holding gold and avoiding equities, as was the case for the last 20 years.

Altcoin PortfolioTrack your altcoin portfolio balance in Fiat currency.
Make sure to open the data window to the right of your charts, it makes everything alot easier to read at a glance.
To learn more about customizing this script to fit your portfolio, watch the video here: youtu.be
To get more cool scripts and up-to-date information about Autoview, join us in slack slack.with.pink
As per the usual, we hope this script helps with your trading venture.
Good luck, and happy trading.

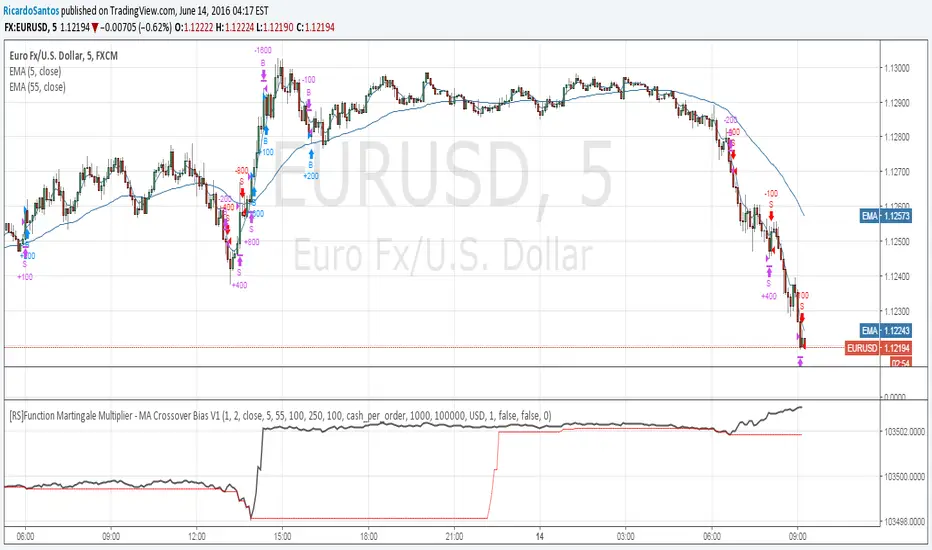
[RS]Function Martingale Multiplier - MA Crossover Bias V1EXPERIMENTAL:
WARNING: Martingale is subject to HUGE drawdown spikes, use at your own risk!
updated function to also double(aply multiplier) on even trades, example with a MA's crossover.
[RS]Function Martingale Multiplier V0EXPERIMENTAL:
WARNING:Martingale is susceptible to huge drawdown spikes, use at your own risk.
simple functions for martingale wins and losses, multiplier can be adjusted manually to increase/decrease performance/drawdown.
