DayFlow VWAP Relay Forex Majors StrategySummary in one paragraph
DayFlow VWAP Relay is a day-trading strategy for major FX pairs on intraday timeframes, demonstrated on EURUSD 15 minutes. It waits for alignment between a daily anchored VWAP regime check, residual percentiles, and lower-timeframe micro flow before suggesting trades. The originality is the fusion of daily VWAP residual percentiles with a live micro-flow score from 1 minute data to switch between fade and breakout behavior inside the same session. Add it to a clean chart and use the markers and alerts.
Scope and intent
• Markets: Major FX pairs such as EURUSD, GBPUSD, USDJPY, AUDUSD, USDCHF, USDCAD
• Timeframes: One minute to one hour
• Default demo in this publication: EURUSD on 15 minutes
• Purpose: Reduce false starts by acting only when context, location and micro flow agree
• Limits: This is a strategy. Orders are simulated on standard candles only
Originality and usefulness
• Core novelty: Residual percentiles to daily anchored VWAP decide “balanced versus expanding day”. A separate 1 minute micro-flow score confirms direction, so the same model fades extremes in balance and rides range breaks in expansion
• Failure modes addressed: Chop fakeouts and unconfirmed breakouts are filtered by the expansion gate and micro-flow threshold
• Testability: Every input is exposed. Bands, background regime color, and markers show why a suggestion appears
• Portable yardstick: Stops and targets are ATR multiples converted to ticks, which transfer across symbols
• Open source status: No reused third-party code that requires attribution
Method overview in plain language
The day is anchored with a VWAP that updates from the daily session start. Price minus VWAP is the residual. Percentiles of that residual measured over a rolling window define location extremes for the current day. A regime score compares residual volatility to price volatility. When expansion is low, the day is treated as balanced and the model fades residual extremes if 1 minute micro flow points back to VWAP. When expansion is high, the model trades breakouts outside the VWAP bands if slope and micro flow agree with the move.
Base measures
• Range basis: True Range smoothed by ATR for stops and targets, length 14
• Return basis: Not required for signals; residuals are absolute price distance to VWAP
Components
• Daily Anchor VWAP Bands. VWAP with standard-deviation bands. Slope sign is used for trend confirmation on breakouts
• Residual Percentiles. Rolling percentiles of close minus VWAP over Signal length. Identify location extremes inside the day
• Expansion Ratio. Standard deviation of residuals divided by standard deviation of price over Signal length. Classifies balanced versus expanding day
• Micro Flow. Net up minus down closes from 1 minute data across a short span, normalized to −1..+1. Confirms direction and avoids fades against pressure
• Session Window optional. Restricts trading to your configured hours to avoid thin periods
• Cooldown optional. Bars to wait after a position closes to prevent immediate re-entry
Fusion rule
Gating rather than weighting. First choose regime by Expansion Ratio versus the Expansion gate. Inside each regime all listed conditions must be true: location test plus micro-flow threshold plus session window plus cooldown. Breakouts also require VWAP slope alignment.
Signal rule
• Long suggestion on balanced day: residual at or below the lower percentile and micro flow positive above the gate while inside session and cooldown is satisfied
• Short suggestion on balanced day: residual at or above the upper percentile and micro flow negative below the gate while inside session and cooldown is satisfied
• Long suggestion on expanding day: close above the upper VWAP band, VWAP slope positive, micro flow positive, session and cooldown satisfied
• Short suggestion on expanding day: close below the lower VWAP band, VWAP slope negative, micro flow negative, session and cooldown satisfied
• Positions flip on opposite suggestions or exit by brackets
What you will see on the chart
• Markers on suggestion bars: L for long, S for short
• Exit occurs on reverse signal or when a bracket order is filled
• Reference lines: daily anchored VWAP with upper and lower bands
• Optional background: teal for balanced day, orange for expanding day
Inputs with guidance
Setup
• Signal length. Residual and regime window. Typical 40 to 100. Higher smooths, lower reacts faster
Micro Flow
• Micro TF. Lower timeframe used for micro flow, default 1 minute
• Micro span bars. Count of lower-TF bars. Typical 5 to 20
• Micro flow gate 0..1. Minimum absolute flow. Raising it demands stronger confirmation and reduces trade count
VWAP Bands
• VWAP stdev multiplier. Band width. Typical 0.8 to 1.6. Wider bands reduce breakout frequency and increase fade distance
• Expansion gate 0..3. Threshold to switch from fades to breakouts. Raising it favors fades, lowering it favors breakouts
Sessions
• Use session filter. Enable to trade only inside your window
• Trade window UTC. Default 07:00 to 17:00
Risk
• ATR length. Stop and target basis. Typical 10 to 21
• Stop ATR x. Initial stop distance in ATR multiples
• Target ATR x. Profit target distance in ATR multiples
• Cooldown bars after close. Wait bars before a new entry
• Side. Both, long only, or short only
View
• Show VWAP and bands
• Color bars by residual regime
Properties visible in this publication
• Initial capital 10000
• Base currency Default
• request.security uses lookahead off everywhere
• Strategy: Percent of equity with value 3. Pyramiding 0. Commission cash per order 0.0001 USD. Slippage 3 ticks. Process orders on close ON. Bar magnifier ON. Recalculate after order is filled OFF. Calc on every tick OFF. Using standard OHLC fills ON.
Realism and responsible publication
No performance claims. Past results never guarantee future outcomes. Fills and slippage vary by venue. Shapes can move while a bar forms and settle on close. Strategies must run on standard candles for signals and orders.
Honest limitations and failure modes
High impact news, session opens, and thin liquidity can invalidate assumptions. Very quiet days can reduce contrast between residuals and price volatility. Session windows use the chart exchange time. If both stop and target are touched within a single bar, TradingView’s standard OHLC price-movement model decides the outcome.
Expect different behavior on illiquid pairs or during holidays. The model is sensitive to session definitions and feed time. Past results never guarantee future outcomes.
Legal
Education and research only. Not investment advice. You are responsible for your decisions. Test on historical data and in simulation before any live use. Use realistic costs.
Major

Major Support and Resistance Price LevelsThis indicator is to be used to automatically plot Major Support and Resistance Price Levels. This is not a TREND support/resistance identifier. This is strictly for auto-plotting historically important price levels.
I would suggest adjusting the support/resistance filter before adjusting the sensistivity levels as I've testing out the setting quite a bit, but as always, do what works best for your chart.
If there is an input that you would like to have me add, let me know and I'll see what I can do.
Things to Consider:
Currently this works best on the 4H through 3D chart for Identifying major price levels; however lower timeframes do still work. Because of the large swings that can be typical when coming from Afterhours trading into Market hours, timeframes under 2H can create some false positives. This is obviously not as much of an issue on crypto or forex.
I will be working on allowing lower or higher timeframes with this indicator in order to circumvent the need to jump back to other timeframes and reference them if they are under that 2h threshold.
Future Updates:
Plotting different timeframe's results on a lower or higher timeframe.

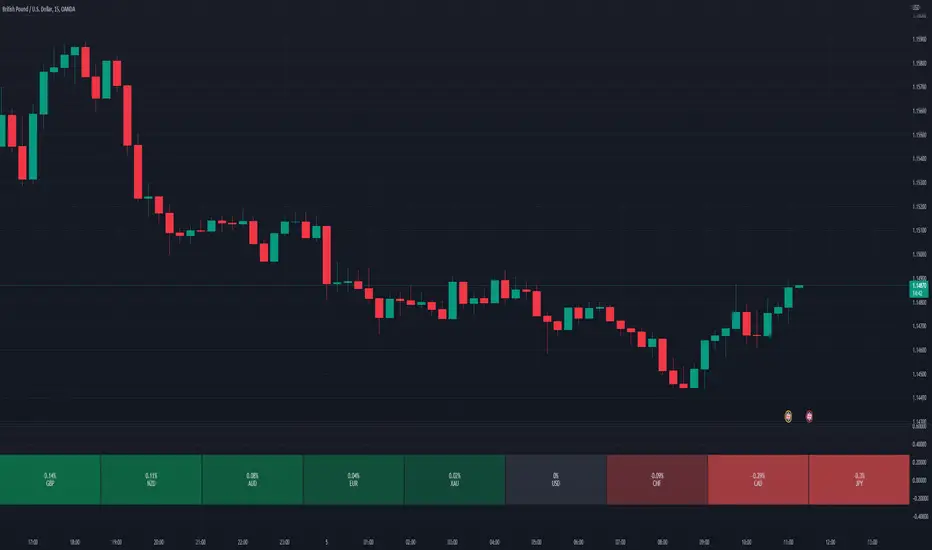
Relative Perfomance IndexHello Traders.
Lets keep it simple..
1. Take the major pairs that have USD in them and watch their change over a specific timeframe.
2. Now lets sort these changes of each pair from the most positive to the most negative.
Good, I see you have some ideas already.
This is exactly what this indicator does. You will visualize the biggest change in pairs of the timeframe of your choice and from this you can decide on pairs that you want to trade.
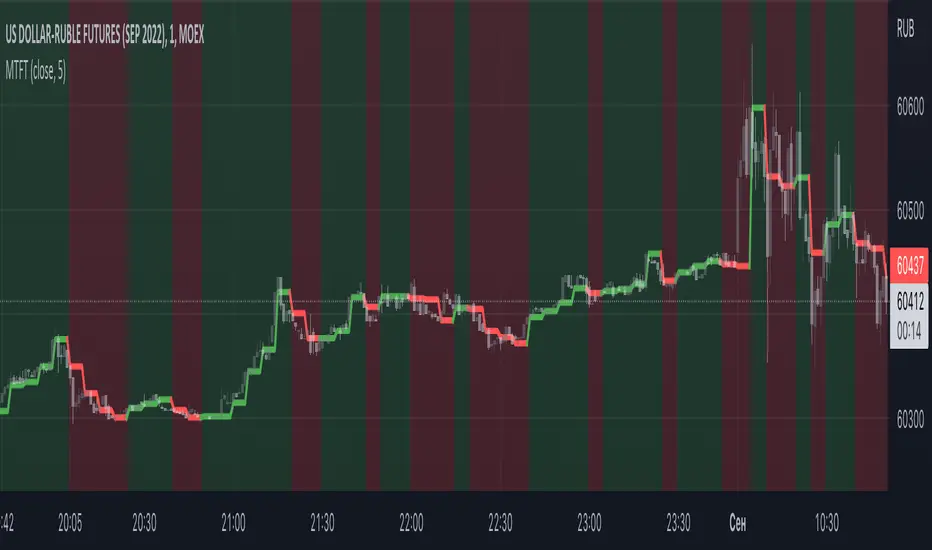
Multi TF Trend Indicator
...Mark Douglas in his book Trading in the Zone wrote
The longer the time frame, the more significant the trend, so a trending market on a daily bar chart is more significant than a trending market on a 30-minute bar chart. Therefore, the trend on the daily bar chart would take precedence over the trend on the 30-minute bar chart and would be considered the major trend. To determine the direction of the major trend, look at what is happening on a daily bar chart. If the trend is up on the daily, you are only going to look for a sell-off or retracement down to what your edge defines as support on the 30-minute chart. That's where you will become a buyer. On the other hand, if the trend is down on the daily, you are only going to look for a rally up to what your edge defines as a resistance level to be a seller on the 30-minute chart. Your objective is to determine, in a downtrending market, how far it can rally on an intraday basis and still not violate the symmetry of the longer trend. In an up-trending market, your objective is to determine how far it can sell off on an intraday basis without violating the symmetry of the longer trend. There's usually very little risk associated with these intraday support and resistance points, because you don't have to let the market go very far beyond them to tell you the trade isn't working.
The purpose of this indicator to show both the major and minor trend on the same chart with no need to switch between timeframes
Script includes
timeframe to determine the major trend
price curve, close price is default, but you can pick MA you want
type of coloring, either curve color or the background color
Implementation details
major trend is determined by the slope of the price curve
Further improvements
a variation of techniques for determining the major trend (crossing MA, pivot points etc.)
major trend change alerts
Thanks @loxx for pullData helper function
Forex Scalping 1min Bollinger Bands, RSI and ADX Trading SystemThis is a Forex Scalping Trading Sytem based on the Bollinger Bands.
Its suited for major pairs, with lowest possible comission (below 1 pip) and with timeframes ranging between 1-15 min.
Indicators:
Bollinger bands
ADX
RSI
Rules for entry:
Long Entry: price to move below the upper Bollinger Bands RSI raise above the 30 line and ADX<32 at the same time.
Short Entry: price to move above the upper Bollinger Bands, RSI raise below the 70 line and ADX<32 at the same time.
Rules for exit
Profit Exit: 3 options: 1, exit position when the price touches the middle band, 2) when the price touches the opposite band, X pips target profit.
Loss Exit: X pips loss

Extremely high win rate FOREX swing strategyTHis is a very simple yet extremely efficient FOREX strategy .
In general it tends to work the best against NZD and AUD pairs, however other major pairs and crosses can work as well.
It's made of a time management, together with MACD , moving average , a price action rule and a risk management.
THe logic behind is the next one :
For LONG:
We have 3 ascending candles.
Histogram of MACD is positive.
Last close of a candle is was above moving average.
If all those previous condition happened before 17/18 UTC time depending if its summer time or not, we enter the trade.
For Short:
We have 3 descending candles.
Histogram of MACD is negative.
Last close of a candle is was below moving average.
If all those previous condition happened before 17/18 UTC time depending if its summer time or not, we enter the trade.
RIsk management
For risk management, since we aim to have a 95%+ win rate, we aim to have a 5:1 or 10:1 risk to reward ratio. Meaning that for each $ we can win, we can lose 5-10$.
THats why I recommend to be extremely careful when playing with leverage with this strategy.

Full Forex scalper StrategyTHis is a FOREX scalping system that can be optimized with almost all majors and crosses pairs.
Its made of multiple elements such as :
MACD
Stochastic RSI
Fast VW moving average
Slow VW moving average
Time management( forex sessions as inputs)
Rules for entry
Long
Last 2 MACD values were ascending, fast moving average is below moving average and stochastic RSI is below 30 level. At the same time we are either into London or NY session.
Short
Last 2 MACD values were descending, fast moving average is above moving average and stochastic RSI is above 70 level. At the same time we are either into London or NY
Rules for exit
WE have 2 exit possibilities: we can exit either at the end of NY/London Session or based on a TP/SL risk management calculating % in movement.
If you have any questions let me know !

Forex bot full strategy with risk managementThis is a full strategy designed for forex major pairs, specially EUR/USD using 1h time frame chart.
Its components are
200 EMA
MACD
OBV
PSAR
RIsk management with tp and sl movements
Rules for entry
For long = Previous histogram from MACD was below 0 and current one is above 0. CLose of a candle is above EMA 200 , OBV oscillator is negative and we have an uptrend from PSAR
For short = Previous histogram from MACD was above 0 and current one is below 0. CLose of a candle is below EMA 200 , OBV oscillator is positive and we have an downtrend from PSAR
Rules for exit
For tp and sl values we calculate the distance from the close of candle until the psar values.
If you have any questions, let me know !

TestedFX SR RADAR v3 (Support & Resistance Radar)TestedFX SR Radar is unlike any other Support and Resistance indicator I have seen to date. It doesn't just show you recent important pivots. Everyone with eyes can see those levels lol. You need an edge on the market. You need to know the levels AHEAD OF TIME. Trading is about having MORE and BETTER information than everyone else. Notice how the levels start BEFORE price touches those levels!!
How does TestedFX SR Radar do this?? Glad you asked.
Just like real radar, it searches within 5 ATR of the current price for strong pivots thousands of bars previous major pivots. But that is just the start. Then when a level is respected with a wick rejection a upvote is cast. When the level is busted a downvote is cast. The shading levels are based on the levels POWER as scored by the market voting on it. (Notice the purple dots at then end of the wicks that hit the level) Using this novel technique high probability pivot points are calculated IN ADVANCE so you know the important levels ahead of time.
Darker levels and multiple lines grouped together show strong S/R levels.
You can use this in combination with your favorite strategy. However, it was built to go with one of our private indicators. Typically good practice on TV is to include all functionality in one indicator. We tried to do that with this indicator but we couldn't because it uses too much CPU power. As it is if you change the SR Radar settings you will get "Script takes too long to execute" type errors. If that happens try hiding and showing the indicator again. If that doesn't work then reset your settings back to standard settings. The upside is that we are releasing this free to our tradingview friends.
I love this community and it is great to be able to give back. I really hope this helps you make better trading decisions. If so please let me know your experiences (good and bad) in the comments.
Sincerly,
Doug Collins
TestedFX

Strategy Smart Forex Buy Sell Signal by LukasHi, I just convert my Smart Forex Buy Sell Signal into strategy.
BUY and SELL signal base on Price action, RSI , and Correlation between Forex Major Pairs.
It's only work for Forex Major Pairs because I only took their data.
Included alert : Spec, Buy, Strong
Recommended to wait for double signal :
Spec Buy > Buy or Spec Sell > Sell
Buy > Strong Buy or Sell > Strong Sell
So execute after the second signal triggered.
On this strategy I exclude Spec Sell/Buy on strategy test.
I use simple Profit/Loss 200/100 and 5 pyramid, you can play around with the setting.
And to improve the odds, simply use my Currency Strength Indicator to pick what pairs to trade. Choose Strong Vs. Weakness to get maximal profit. It help me to stay away from ranging pairs.
Any feedback are welcome :)

Smart Forex Buy Sell Signal by LukasHi again!
So, this is BUY and SELL signal base on Price action, RSI, and Correlation between Forex Major Pairs.
It's only work for Forex Major Pairs because I only took their data.
Included alert : Spec, Buy, Strong
Recommended to wait for double signal :
Spec Buy > Buy or Spec Sell > Sell
Buy > Strong Buy or Sell > Strong Sell
So execute after the second signal triggered.
It's indicate the trend.
Looking forward for your feedback to improve the script.
Thank you.
It's better combine it with Moving average indicator to indicate direction, I use Moving Average Adaptive Q from cheatcountry to help me make decision.

