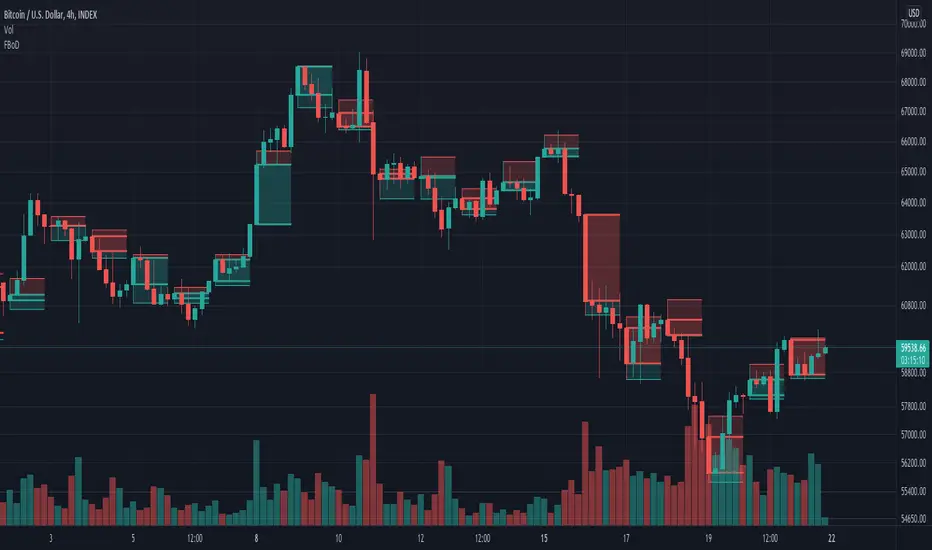
Volume Profile PremiumHello, my friends, this is a new fine-grained volume profile indicator. As is known to all, the volume profile indicator is a charting tool that shows how much volume has occurred at each price throughout the trading session. The volume profile indicates the prices favored by the market or those ignored by the market, which can give traders clues as to where prices are likely to go shortly.
(1) Indicator description
This indicator is based on the function "request.security_lower_tf". See the related usage note for details if you need it.
Support for obtaining volume from a lower timeframe than the current chart and calculating a more fine-grained volume distribution
Due to the increased complexity of the calculation, you need to set a reasonable timeframe to avoid calculation timeout.
(2) Key parameters
- Support/Resistance Clustering
Max of Lookback Forward: The maximum number of historical K-lines
Min Resolution (Minute): lower timeframe, unit: minute
Display Volume Profile: ways to display volume profile
Rows of Volume Profile: rows of volume profile
Placement of Volume Profile: location of volume profile
Width of Volume Profile: width of volume profile
Horizontal Offset: horizontal offset of volume profile
Happy trading, and enjoy your life!
————————————————————————————————————————
各位朋友大家好,这是一个具有更高细粒度的成交量分布指标。众所周知,成交量分布是一种图表分析工具(或指标),它显示了在整个交易时段内每个价格上发生了多少成交量。 成交量分布指出了受到市场青睐的价格以及被市场忽略的价格,这可以为交易者提供有关近期价格可能走向何方的线索。
(1) 指标说明
该指标基于 request.security_lower_tf 函数,详情可以查看相关使用说明
支持从比当前图表分辨率更低的时间周期获取成交量,并计算更加细粒度的成交量分布
由于增加了计算复杂度,您需要设置合理的时间周期以避免计算超时
(2) 关键参数
- Volume Profile Parameters
Max of Lookback Forward: 用于统计成交量分布的最大回顾的K线数量
Min Resolution (Minute): 细粒度的时间周期
Display Volume Profile: 展示成交量分布的方式
Rows of Volume Profile: 成交量分布的行数
Placement of Volume Profile: 成交量分布的位置
Width of Volume Profile: 成交量分布的宽度
Horizontal Offset: 成交量分布的水平偏移
祝大家交易愉快
Lower

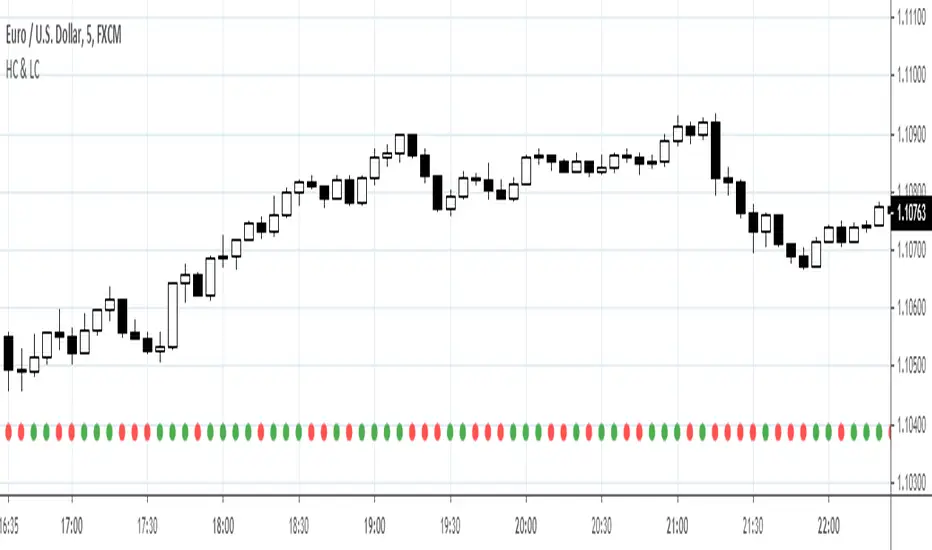
Higher and lower close indicatorSome strategies depend on a higher or lower close than the previous bar's close. With lower time frames and small bars, this can be time consuming. The indicator reduces the time for such decisions by colour indicating the condition. A higher close than the previous bar is denoted by a green dot at the bottom of the screen, red for a lower close and blue for an equal close.
Captain Jack Williams %R EMA/SMAWilliams% R / EMA / SMA
This oscillator is designed from a different perspective. You can show the current price trend (EMA / SMA) in the background based on its transition. You can mix or split the background.
Investor behavior
Williams% R (% R) is a momentum-based oscillator used primarily in technical analysis to define overbought and oversold conditions. % R is based on the comparison between the current closing and the highest amount for a retrospective period defined by the investor. The% R (note negative values) between 0 and -100 indicates that the arrows show more purchase conditions when close to zero and over-sold when close to -100. In general,% R can create installations based on overbought and oversold conditions and general changes in momentum.
I wish good luck to the friends who will use it.
You can support and follow to see different machines.
Williams% R / EMA / SMA
Bu osilatör farklı bir perspektiften tasarlanmıştır. Geçerli fiyat eğilimini (EMA / SMA) geçişine göre arka planda gösterebilirsiniz. Arka planı karıştırabilir veya bölebilirsiniz.
Yatırımcı davranışı
Williams% R (% R), aşırı alım ve aşırı satım koşullarını tanımlamak için öncelikle teknik analizde kullanılan momentum tabanlı bir osilatördür. % R, mevcut kapanış ile yatırımcı tarafından tanımlanan geriye dönük bir döneme ilişkin en yüksek tutar arasındaki karşılaştırmaya dayanmaktadır. 0 ve -100 arasındaki% R (negatif değerleri not edin), okların sıfıra yakın olduğunda daha fazla satın alma koşulu gösterdiğini ve -100'e yakın olduğunda aşırı satıldığını gösterir. Genel olarak,% R aşırı alım ve aşırı satım koşullarına ve momentumdaki genel değişikliklere dayalı kurulumlar oluşturabilir.
Kullanacak arkadaşlara iyi şanslar diliyorum.
Farklı makineleri görmek için destekleyebilir ve takip edebilirsiniz.

How to Overlay First LTF Bar of DayExample how to overlay the first lower timeframe bar of the day across the entire day. Set chart to a timeframe that is lower than 1 Day period. Also included option for coloring wick pressure of that bar.
NOTICE: This is an example script and not meant to be used as an actual strategy. By using this script or any portion thereof, you acknowledge that you have read and understood that this is for research purposes only and I am not responsible for any financial losses you may incur by using this script!