ATR ZigZag BreakoutATR ZigZag Breakout
This strategy uses my ATR ZigZag indicator (powered by the ZigZagCore library) to scalp breakouts at volatility-filtered highs and lows.
Everyone knows stops cluster around clear swing highs and lows. Breakout traders often pile in there, too. These levels are predictable areas where aggressive orders hit the tape. The idea here is simple:
→ Let ATR ZigZag define clean, volatility-filtered pivots
→ Arm a stop market order at those pivots
→ Join the breakout when the crowd hits the level
The key to greater success in this simple strategy lies in the ZigZag. Because the pivots are filtered by ATR instead of fixed bar counts or fractals, the levels tend to be more meaningful and less noisy.
This approach is especially suited for intraday trading on volatile instruments (e.g., NQ, GC, liquid crypto pairs).
How It Works
1. Pivot detection
The ATR ZigZag uses an ATR-based threshold to confirm swing highs and lows. Only when price has moved far enough in the opposite direction does a pivot become “official.”
2. Candidate breakout level
When a new swing direction is detected and the most recent high/low has not yet been broken in the current leg, the strategy arms a stop market order at that pivot.
• Long candidate → most recent swing high
• Short candidate → most recent swing low
These “candidate trades” are shown as dotted lines.
3. Entry, SL, and TP
If price breaks through the level, the stop order is filled and a bracket is placed:
• Stop loss = ATR × SL multiplier
• Take profit = SL distance × RR multiplier
Once a level has traded, it is not reused in the same swing leg.
4. Cancel & rotate
If the market reverses and forms a new swing in the opposite direction before the level is hit, the pending order is cancelled and a new candidate is considered in the new direction.
Additional Features
• Optional session filter for backtesting specific trading hours
Levels

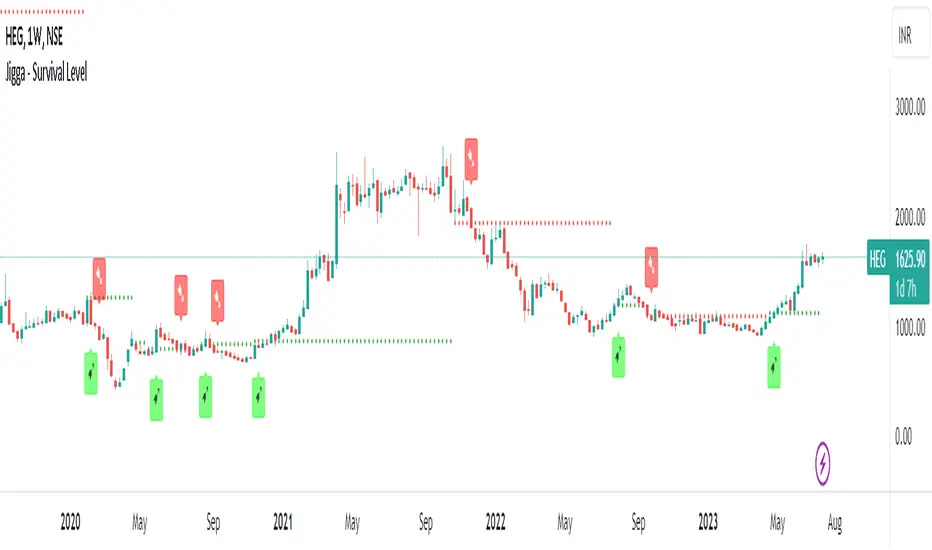
Jigga - Survival LevelHi All !!
Its always the case that we buy a stock and it starts falling !! What a new investor will do is to add few more on downfall and then few more until they stuck all their case to same falling stock.
I thought to create a level which can help long term investor on when to buy and sell.
Logic:
I have used multiple indicators logic all into one and find out when majority of them are showing positive sign.
Green /Red line will be shown when majority are in positive / negative territory.
Buy and sell signal will be generated based on this line only.
Note:
Use this on Weekly chart on good fundamental stock for long term investment.
CoGrid ManagementThis strategy uses grid levels determined by pivot points based on the selected time period.
It's useful for swing trading without leverage, spot trading or for Hold management.
If the price goes down we buy and if it continues to go down we keep buying improving the average price.
When the price rises above the average entry price, we sell and if it continues to rise, we continue to sell.
It works for any pair as long as Buys and Sells quantities are adjusted correctly.
In these times of great economic change, good luck to everyone 🍀

Simple EMA_Hull_RSI StrategyAnother simple strategy. Crossing EMA & Hull MA and the level of RSI (overbought/oversold) defines long or short.
Can be improved by varying the parameters and adding take profit / stop loss.
Backtest: ETHUSD (Bitmex): 5m

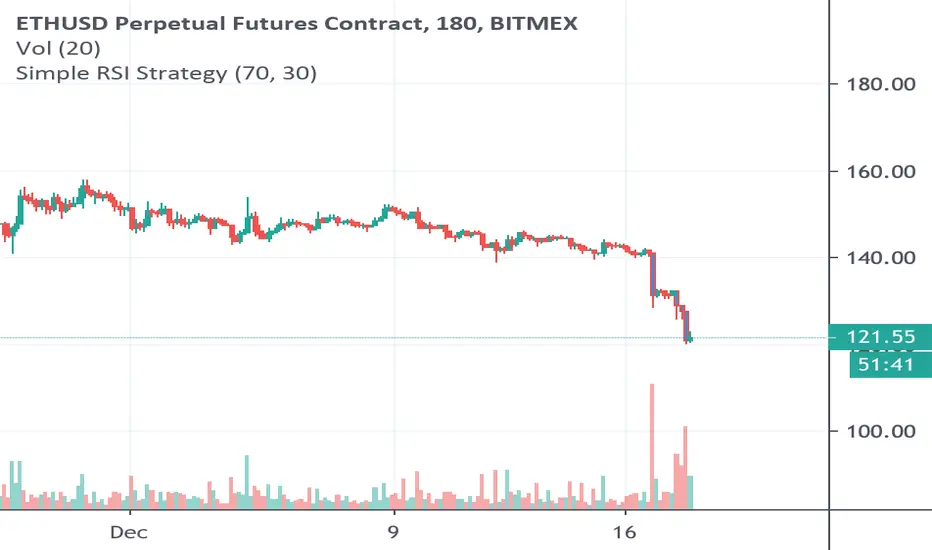
Simple RSI Strategy Buy/Sell at a certain levelSimple Strategy based on RSI, using overbought or oversold levels, defined by us, sell or buy an asset.
Backtest: ETHUSD (Bitmex) - 3h
Combo Backtest 123 Reversal & Cueing Off Sup/Res Levels This is combo strategies for get a cumulative signal.
First strategy
This System was created from the Book "How I Tripled My Money In The
Futures Market" by Ulf Jensen, Page 183. This is reverse type of strategies.
The strategy buys at market, if close price is higher than the previous close
during 2 days and the meaning of 9-days Stochastic Slow Oscillator is lower than 50.
The strategy sells at market, if close price is lower than the previous close price
during 2 days and the meaning of 9-days Stochastic Fast Oscillator is higher than 50.
Second strategy
Cueing Off Support And Resistance Levels, by Thom Hartle
modified by HPotter for trade signals.
The related article is copyrighted material from Stocks & Commodities.
WARNING:
- For purpose educate only
- This script to change bars colors.

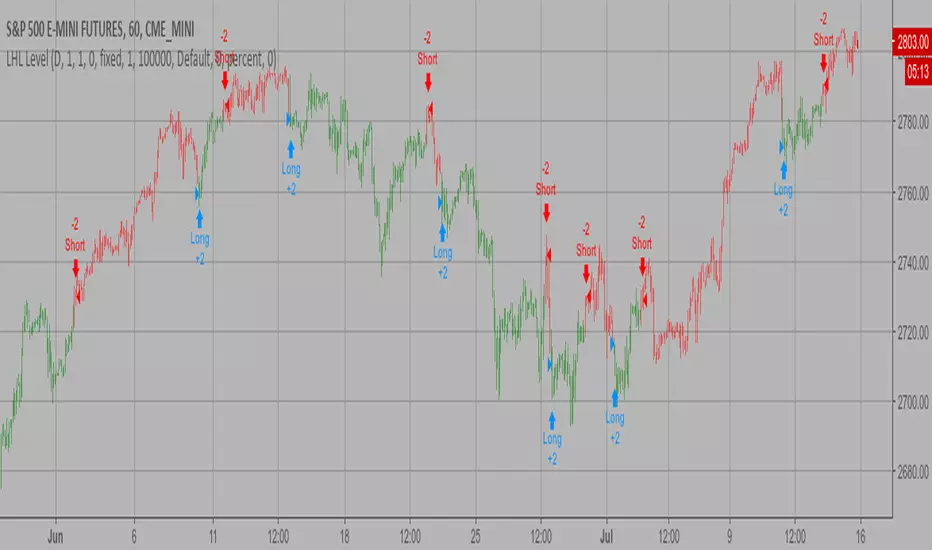
Last High and Low Level Backtest This script shows a high and low period value.
SelectPeriod - Day or Week or Month and etc.
LookBackPeriods - Shift levels 0 - current period, 1 - previous and etc.
You can change long to short in the Input Settings
WARNING:
- For purpose educate only
- This script to change bars colors.
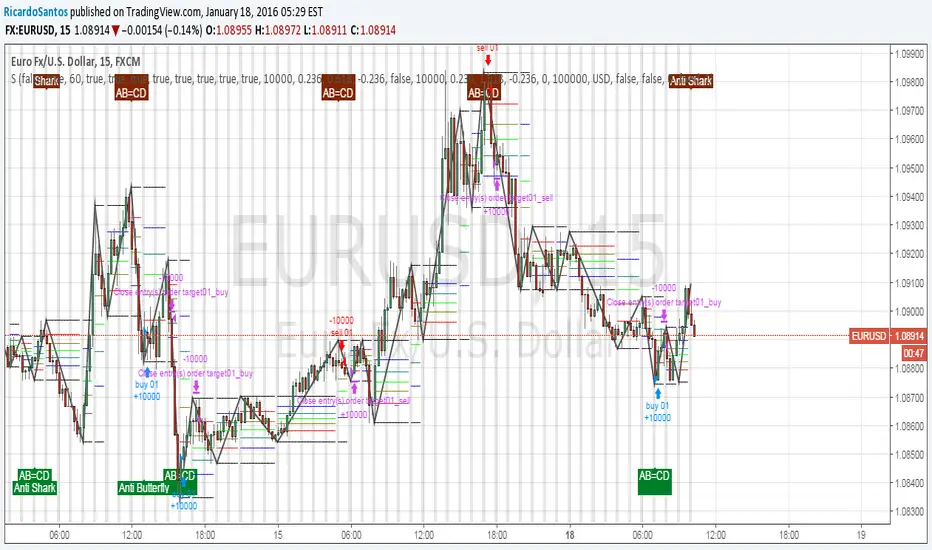
[STRATEGY][RS]ZigZag PA Strategy V4.1EXPERIMENTAL:
WARNING: this strategy repaints after reloading and results are heavily curve fitted, use at your own discretion.
UPDATE: (AleksanderThor) add option for a 2nd target, to use you need to activate pyramiding with a setting of 1 manually (not possible to change programatically) .