Laplace Momentum Percentile ║ BullVision 🔬 Overview
Laplace Momentum Percentile ║ BullVision is a custom-built trend analysis tool that applies Laplace-inspired smoothing to price action and maps the result to a historical percentile scale. This provides a contextual view of trend intensity, with optional signal refinement using a Kalman filter.
This indicator is designed for traders and analysts seeking a normalized, scale-independent perspective on market behavior. It does not attempt to predict price but instead helps interpret the relative strength or weakness of recent movements.
⚙️ Key Concepts
📉 Laplace-Based Smoothing
The core signal is built using a Laplace-style weighted average, applying an exponential decay to price values over a specified length. This emphasizes recent movements while still accounting for historical context.
🎯 Percentile Mapping
Rather than displaying the raw output, the filtered signal is converted into a percentile rank based on its position within a historical lookback window. This helps normalize interpretation across different assets and timeframes.
🧠 Optional Kalman Filter
For users seeking additional smoothing, a Kalman filter is included. This statistical method updates signal estimates dynamically, helping reduce short-term fluctuations without introducing significant lag.
🔧 User Settings
🔁 Transform Parameters
Transform Parameter (s): Controls the decay rate for Laplace weighting.
Calculation Length: Sets how many candles are used for smoothing.
📊 Percentile Settings
Lookback Period: Defines how far back to calculate the historical percentile ranking.
🧠 Kalman Filter Controls
Enable Kalman Filter: Optional toggle.
Process Noise / Measurement Noise: Adjust the filter’s responsiveness and tolerance to volatility.
🎨 Visual Settings
Show Raw Signal: Optionally display the pre-smoothed percentile value.
Thresholds: Customize upper and lower trend zone boundaries.
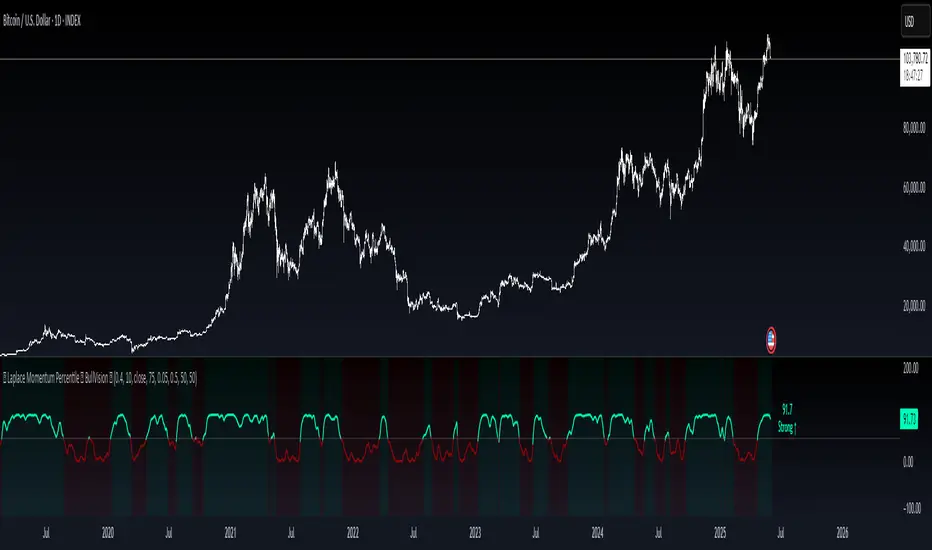
📈 Visual Output
Main Line: Smoothed percentile rank, color-coded based on strength.
Raw Line (Optional): The unsmoothed percentile value for comparison.
Trend Zones: Background shading highlights strong upward or downward regimes.
Live Label: Displays current percentile value and trend classification.
🧩 Trend Classification Logic
The indicator segments percentile values into five zones:
Above 80: Strong upward trend
50–80: Mild upward trend
20–50: Neutral zone
0–20: Mild downward trend
Below 0: Strong downward trend
🔍 Use Cases
This tool is intended as a visual and contextual aid for identifying trend regimes, assessing historical momentum strength, or supporting broader confluence-based analysis. It can be used in combination with other tools or frameworks at the discretion of the trader.
⚠️ Important Notes
This script does not provide buy or sell signals.
It is intended for educational and analytical purposes only.
It should be used as part of a broader decision-making process.
Past signal behavior should not be interpreted as indicative of future results.
Pine Script® Indikator