korea time with 200 korea time
start time
08
09
17
18
23
00
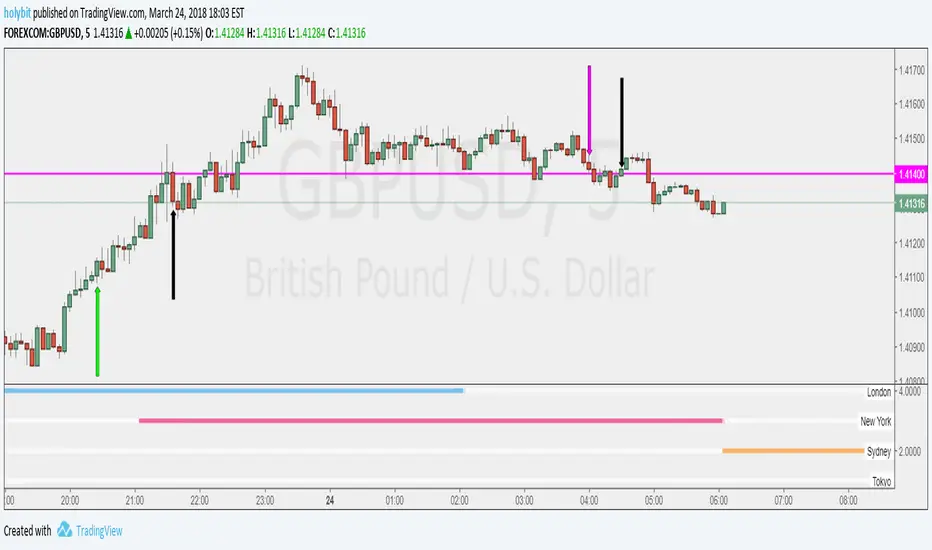
This script makes it easier to look at the charts
The time automatically displays even if you don't bother to bring the mouse by hand
Now you can see the time intuitively
Run a very happy trading session
Korea

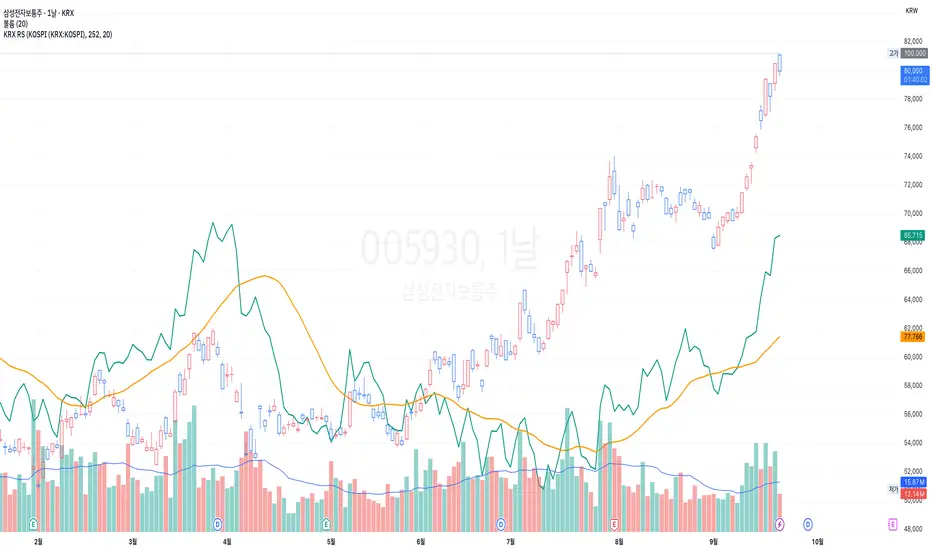
KRX RS OverlayKRX RS Overlay (Manual, Pine v6) (한국어 설명 아래에)
What it does
Plots a Relative Strength (RS) line of the current symbol versus a selected Korean market index on the price chart (overlay). RS is computed as Close(symbol) / Close(benchmark) and rebased to 100 N bars ago for easy comparison. An SMA of RS is included for signal smoothing.
Benchmarks (manual selection only)
• KOSPI (KRX:KOSPI) — default
• KOSDAQ (KRX:KOSDAQ)
• KOSPI200 (KRX:KOSPI200)
• KOSDAQ150 (KRX:KOSDAQ150)
Inputs
• Benchmark: choose one of the four indices above (default: KOSPI)
• Rebase N bars ago to 100: sets the normalization point (e.g., 252 ≈ 1 trading year on daily)
• RS SMA length: smoothing period for the RS line
• Show 100 base line: toggle the reference line at 100
How to read
• RS rising → the symbol is outperforming the selected index.
• RS above RS-SMA and sloping up → strengthening leadership vs. the benchmark.
• RS crossing above RS-SMA → momentum-style confirmation (an alert is provided).
Tips
• Works on any timeframe; the benchmark is requested on the same timeframe.
• If the RS line scale conflicts with price, place the indicator on the Left scale (Chart Settings → Scales) or set the series to use the left axis.
Notes
• This script is manual only (no auto index detection).
• Educational use; not financial advice.
⸻
KRX RS 오버레이 (수동, Pine v6)
기능
현재 종목을 선택한 한국 지수와 비교한 상대강도(RS) 라인을 가격 차트 위(오버레이)에 표시합니다. RS는 종목 종가 / 지수 종가로 계산하며, 비교를 쉽게 하기 위해 N봉 전 = 100으로 리베이스합니다. 신호 완화를 위해 RS의 SMA도 함께 제공합니다.
벤치마크(수동 선택만 지원)
• KOSPI (KRX:KOSPI) — 기본값
• KOSDAQ (KRX:KOSDAQ)
• KOSPI200 (KRX:KOSPI200)
• KOSDAQ150 (KRX:KOSDAQ150)
입력값
• Benchmark: 위 4개 지수 중 선택(기본: KOSPI)
• Rebase N bars ago to 100: 리베이스 기준(일봉 252 ≈ 1년)
• RS SMA length: RS 스무딩 기간
• Show 100 base line: 100 기준선 표시 여부
해석 가이드
• RS 상승 → 선택 지수 대비 초과성과.
• RS가 RS-SMA 위 & 우상향 → 벤치마크 대비 리더십 강화.
• RS가 RS-SMA 상향 돌파 → 모멘텀 확인(알림 제공).
팁
• 모든 타임프레임에서 동작하며, 지수도 동일 타임프레임으로 요청됩니다.
• 가격 축과 스케일이 겹치면 왼쪽 스케일로 표시하도록 설정하세요(차트 설정 → Scales).
유의사항
• 자동 지수 판별 기능은 포함하지 않았습니다(수동 전용).
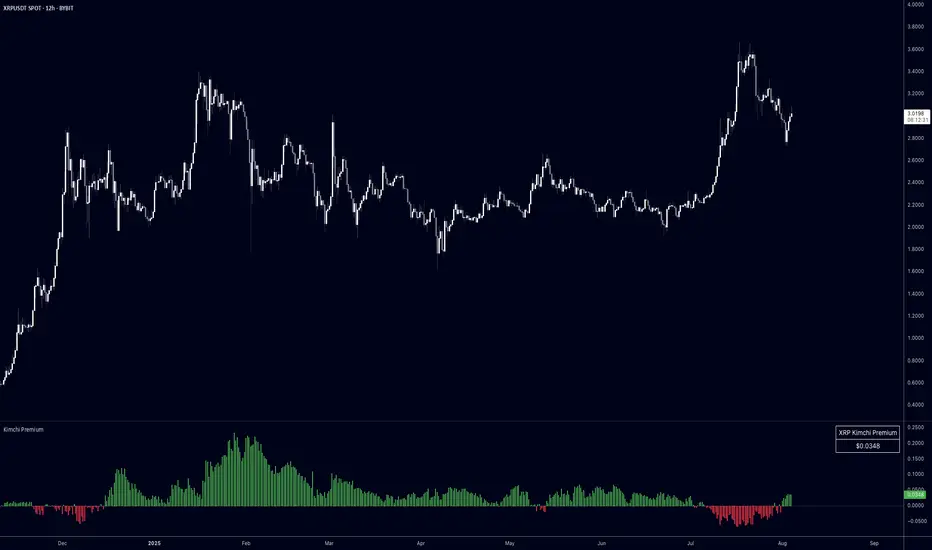
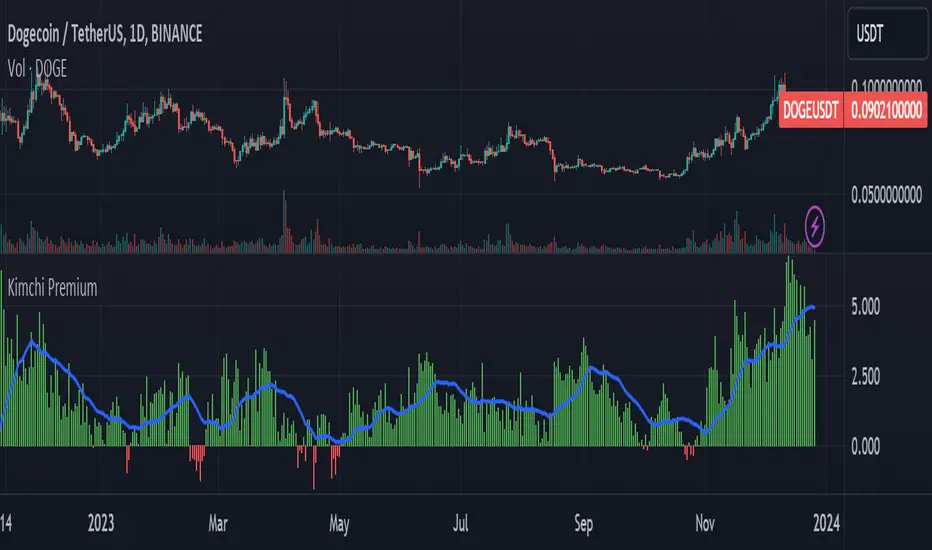
Kimchi PremiumKimchi Premium Indicator
Track the price difference between Korean cryptocurrency exchanges and global markets - a key metric for understanding regional market sentiment and arbitrage opportunities.
What is the Kimchi Premium?
The Kimchi Premium measures how much more (or less) cryptocurrencies trade on Korean exchanges compared to global exchanges. Named after Korea's famous fermented dish, this premium often reflects Korean retail investor sentiment and capital flow restrictions.
How It Works:
• Fetches prices from Korean exchanges (Upbit, Bithumb) in KRW
• Compares against global exchanges (Binance, Coinbase, Kraken, Bybit, OKX) in USD/USDT
• Automatically converts KRW to USD using Pepperstone's USD/KRW rate
• Calculates the premium as: (Korean Price USD - Global Price) / Global Price * 100
Visual Indicators:
• Green bars = Korean exchanges trading at a premium (more expensive)
• Red bars = Korean exchanges trading at a discount (cheaper)
• Histogram style with zero baseline for easy interpretation
Key Features:
• Exchange Selection: Choose individual Korean/global exchanges or averaged prices across multiple venues
• Display Options: View premium in percentage (%) or absolute dollar ($) terms
• Inverse Mode: Flip perspective to show global premium over Korean prices
• Moving Average: Smooth out noise with customizable MA period
• Live Table: Real-time premium display in top-right corner
• Auto-Detection: Works with any crypto pair on your chart (BTC, ETH, XRP, etc.)
Trading Applications:
• Sentiment Analysis: Extreme premiums (>5%) often signal Korean retail FOMO - potential reversal zones
• Arbitrage Identification: Large premiums/discounts highlight profit opportunities (consider logistics/capital controls)
• Regional Flow Tracking: Monitor capital movement into/out of Korean crypto markets
• Risk Management: Historical data shows massive premiums often coincide with local tops
Customization Options:
• Korean exchanges: Averaged out, Upbit, Bithumb
• Global exchanges: Averaged out, Binance, Coinbase, Kraken, Bybit, OKX
• Display format: Percentage or dollar amount
• Moving average toggle and period adjustment
• Table display on/off
• Inverse premium view
Pro Tips:
• Use "Averaged out" settings for most reliable data across multiple venues
• Watch for premium spikes above 3-5% as potential sentiment extremes
• Negative premiums can indicate Korean selling pressure or efficient arbitrage
• Combine with volume analysis for stronger signals
Korea M2 Liquidity Index💡 Korea M2 Liquidity Index
- This indicator visualizes Korea's M2 liquidity trends, designed to help both domestic and global investors easily understand the overall money supply situation in the Korean economy.
- In particular, by comparing it with the KOSPI index, investors can assess the equity market level relative to liquidity, allowing for a more precise valuation analysis to determine whether the Korean stock market is overvalued or undervalued.
✅ What is M2?
- M2 is a broad measure of money supply, which includes cash, demand deposits, savings deposits, and certain financial products.
- It serves as a crucial macroeconomic indicator that reflects the overall liquidity and capital supply in the Korean economy.
💰 KRW and USD display options
- KRW basis: Displays the total M2 amount in Korean won (in trillion units).
- USD basis: Converts the total M2 amount into US dollars using the KRW/USD exchange rate(KRW/USD) making it useful for global investors or those analyzing in USD terms.
📊 Display style and interpretation
- Users can freely choose to display Korea’s M2 and liquidity index and turn them on or off as needed.
- The index is simplified and displayed in trillion won units, allowing for an intuitive view of long-term trends and structural changes.
- The Offset (days) feature enables temporal adjustments, making it easier to compare this indicator with other economic or financial data series.
🌏 Example use cases
- Domestic policy analysis: Analyze the correlation between Bank of Korea's monetary policy changes (base rates, liquidity injections, etc.) and M2 growth.
- FX and global capital flow analysis: Understand the relationship between KRW/USD exchange rate fluctuations and changes in domestic liquidity.
- Leading indicator for asset markets: Use it as a forward-looking signal for stock, real estate, and bond markets.
- Comparison with KOSPI index: Identify gaps between liquidity and market levels to support strategic investment decisions and evaluate market capitalization levels more precisely.
copyright @invest_hedgeway
============================================================
💡 Korea M2 Liquidity Index
- 이 지표는 대한민국의 M2 유동성 흐름을 시각화하여, 국내 및 글로벌 투자자들이 한국 경제의 자금 공급 상태를 한눈에 파악할 수 있도록 설계되었습니다.
- 특히 코스피 지수와 비교 분석함으로써 유동성 대비 주가지수 수준을 평가하고, 한국 증시의 상대적 고평가·저평가 여부를 판단해 보다 정교한 밸류에이션 분석에 활용할 수 있습니다.
✅ M2란?
- M2는 광의통화 지표로, 현금 + 요구불 예금 + 저축성 예금 + 금융상품(일부) 등을 포함하는 총 유동성을 의미합니다. 이는 한국 경제의 자금 공급 상태를 나타내는 중요한 거시경제 지표로 활용됩니다.
💰 KRW 및 USD 표시 선택
- KRW(원화) 기준: 한국 원화 기준으로 M2 총액(조 단위)을 나타냅니다.
- USD 기준: M2 총액을 환율(KRW/USD) 기준으로 달러화 환산 후 표시하여, 글로벌 투자자나 달러화 기준 평가 시 활용 가능합니다.
📊 표시 방식과 해석
- 사용자는 한국의 M2와 유동성지수를 자유롭게 선택해 원하는 방식으로 켜거나 끌 수 있습니다.
- 지표는 조원(Trillion won) 단위로 단순화해 표시되며, 장기 흐름과 추세 변화를 시각적으로 확인할 수 있습니다.
- Offset (days) 기능을 통해 시리즈를 시차 조정할 수 있어, 다른 경제 지표와의 비교 분석에 유용합니다.
🌏 활용 예시
- 국내 정책 분석: 한국은행의 통화정책 변화(기준금리, 유동성 공급 등)와 M2 증가율 간 상관성 분석.
- 환율 및 글로벌 자금 흐름 분석: 원/달러 환율 변동과 유동성 간 상관관계 파악.
- 주식, 부동산, 채권 등 자산시장 선행 지표로서 활용.
- 코스피 지수와의 비교 분석: 시장 유동성과 지수의 괴리를 파악하여 전략적 투자 판단과 시가총액 수준에 대한 평가에 활용.
copyright @invest_hedgeway

Kimchi Premium / Korean Premium ALL TICKERSKimchi Premium
Due to the isolated nature of Korean crypto markets, Koreans pay a hefty premium on most cryptos. (Usually ranging from 3% to 5%). This is colloquially known as the " Kimchi Premium ".
Uses
The extend of this premium can be used to gauge Korean sentiment towards certain tickers. Most of the insane alt coin rallies that are started by Korean degens are missed by foreign traders entirely. This script seeks to fix that.
Notes
This script automatically detects your current ticker and compares the USDT pair to the KRW pair after adjusting for exchange rate.
Works on all USDT, USDC, BUSD, FDUSD, USD, USDT.P, USDC.P or KRW pairs. Will obviously throw an error if your ticker has no KRW pairing.
Korea PremiumA simple indicator based on the percentage price difference between Korean crypto markets and western markets.
It currently shows the premium for BTC & ETH.
If it's positive (red) it means that the Korean market is trading at a premium.
Vice versa negative (blue) means the West is trading at a premium.
Because the Korean crypto market is so closed off (because of regulations) the premium sometimes gets really wild.
The Korean average is based on Bithumb & Korbit prices.
The index made for the west is based on Coinbase, Kraken and Bitstamp.
By default it uses closing prices for the calculation but you can change that.
You can also change the timeframe in the settings although it's probably best that you keep it at "same as chart".
It's free so you can just add it to your favourites and start using it.

10-Year Korea Gov Bond Minus 3-Year Korea Gov BondInterest rate spread between 10yr and 3yr Korean Gov. Bonds

Moving Average Deviation(UPBIT)This is Moving Average Deviation ocsillator.
It is distributed as a script provided by the UPBIT Exchange.
This is the excluded version of the trading technique.
이것은 Moving Average Deviation ocsillator 입니다.
매매 기법을 제외한 UPBIT 거래소에서 제공하는 지표의 형태로 배포합니다.

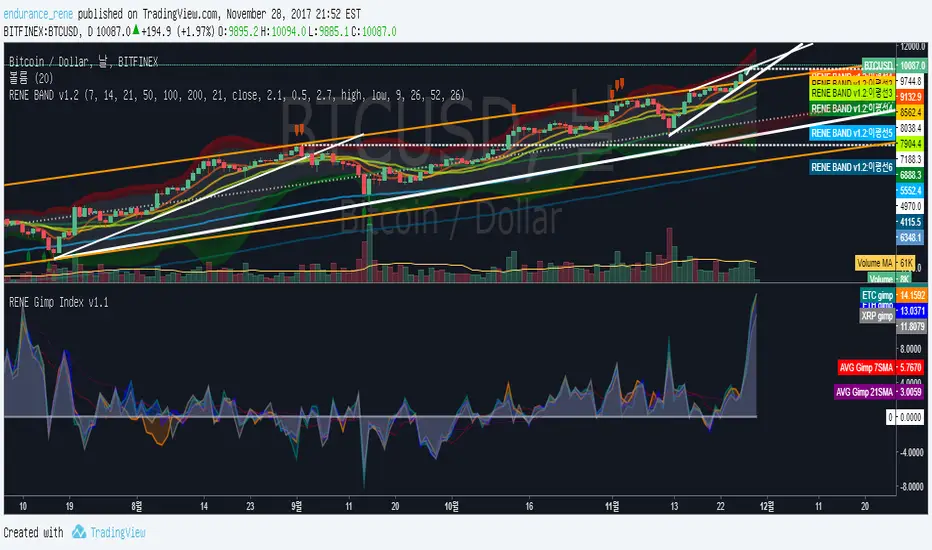
RENE Gimp Index v1.1RENE Gimp Index v1.1
1. 서 Intro
르네지표 2번째 RENE_Gimp Index v1.1을 공개합니다.
많은 분들의 요청이 있어 다음과 같은 지표를 공개하게 되었습니다.
2nd RENE indicator, RENE_Gimp Index v1.1 has released. (Gimp means 'Kimchi Premium')
Due to popular demand, I open this indicator to public.
2. 데이터 소스 Data source
4대 메이저 코인을 넣었으며, 데이터 소스는 다음과 같습니다
BTC : 빗썸 - 비트파이넥스
ETH : 코빗 - 비트파이넥스
ETC : 코빗 - 비트파이넥스
XRP : 코빗 - 비트파이넥스
(거래량기준으로 볼땐 빗썸을 사용하는게 더 적합하겠으나,
빗썸데이터가 비트에만 국한되어있어 부득이하게 다음과 같이 사용하였습니다.)
It shows four major coins, and the data sources are as follows
BTC: Bithumb - Bitfinex
ETH: Korbit - Bitfinex
ETC: Korbit - Bitfinex
XRP: Korbit - Bitfinex
(It's better to use bithumb data because of the high volume,
however the Bithumb data is limited to bitcoin only, I inevitably used Korbit data.
3. 계산법 Calculations
산식은 다음과 같습니다.
BTC 김프(%) = (BTC원화 - BTC미화*달러/원환율) / (BTC미화*달러/원환율) * 100
또한 7일 21일 단순이동평균선을 넣어 평균수치에 대해 인지할 수 있도록 하였습니다.
The formula is calculated as follows
BTC GIMP (%) = (BTC won-BTC US dollar * USD / WON) / (BTC US dollor * USD/ WON) * 100
I also added a simple moving average line on the 7th and 21st so that we can recognize the average figures.
4. 사용권한 Authorizations
개인적으로 김프를 보는데 사용하다가 르네밴드의 많은 성원에 감사하는 차원에서 무료로 공개하게 되었습니다.
따라서 별도의 권한부여는 필요하지 않으며
하단의 Add to favorite script 추가하신후, 지표- 즐겨찾기에서 사용하시면 됩니다.
혹은 퍼블릭 스크립트에서 "RENE Gimp Index"로 검색하실 수 있습니다.
I was personally used this indicator to see GIMP
and I decided to release to public for free to express my gratitude to many supports to the René Band.
Therefore, no authorization is required
Add to favorite script at the bottom and use it in Indicator - Favorites.
Or, you can search for "RENE Gimp Index" in public scripts.
5. 도움이 되었다면? Satisfied?
사용해 보시고 마음에 드신다면 RENE BAND v1.2 구매로 저에게도 도움을 주시면 감사하겠습니다.
(그림을 클릭하시면 해당 글로 이동합니다)
이미 많은 판매량을 기록하고 있으며 체험3일 이후 구매율이 높은것으로 보아 이용자분들은 만족하시고 계십니다.
이 지표사용으로 수익내는데 도움이 되셨으면 좋겠습니다.
If you would like to use it, please help me by purchasing RENE BAND v1.2.
(Click on the picture above to go to the Rene Band page)
It already sold a lot, and since the purchase rate is high after 3 days of experience, users are satisfied.
I hope this index will help you earn Profit.
글이 도움되셨다면 좋아요 눌러주시고
의견이 있으시다면 코멘트를 달아주세요. 피드백은 언제나 환영입니다 :)
If the article was helpful, Please press Favorite button below,
If you have any questions or thoughts, please leave a comment. Feedback is always welcome :)
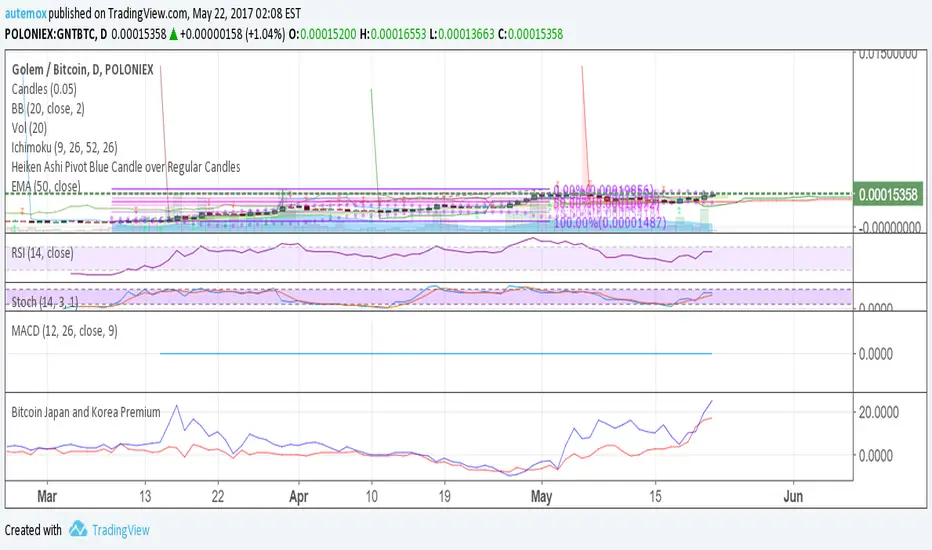
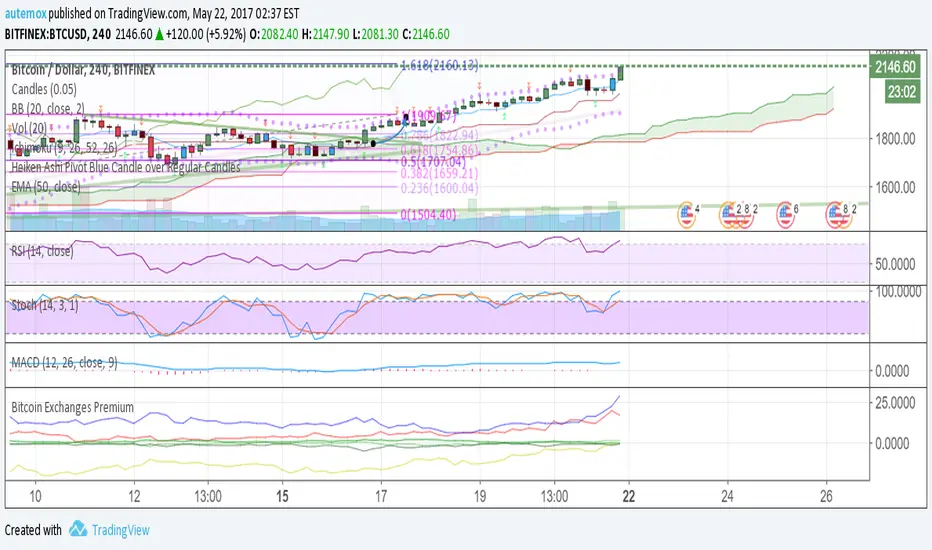
Bitcoin Exchanges PremiumThis is a % premium vs average BTCUSD price. In other words, how much % more are exchanges selling bitcoin at compared to normal BTCUSD price?
Blue: Korea
Red: Japan
Yellow: China
Green: USD Exchanges including Bitfinex, Poloniex, Coinbase, and Bitstamp
Bitcoin Japan and Korea PremiumRed line is the % premium to buy bitcoin in Japan. Blue is the % premium to buy bitcoin in korea.