TICK+ [Pt]█ TICK+ – Advanced US Market Internals & TICK Distribution Tool
TICK+ is a comprehensive indicator that decodes US market internals by leveraging the TICK index—the net difference between stocks ticking up and those ticking down. Unlike many standard TICK tools that only plot raw values, TICK+ provides multiple visualization modes, dynamic moving averages, an independent MA Ribbon, a detailed distribution profile, divergence and pivot analysis, and real-time data tables. This integrated approach offers both visual and quantitative insights into intraday market breadth, trend sustainability, and potential reversals—making it an indispensable tool for trading US indices, futures, and blue‑chip stocks.
Market internals enthusiasts often consider the TICK index indispensable for trading these markets. By offering an immediate snapshot of sentiment and confirming trends through additional analytics, TICK+ gives traders a decisive edge—helping to determine whether a rally is truly supported by broad participation or if caution is warranted.
--------------------------------------------------------------------------------------------------------
█ Key Features:
► Market Internal – Multiple Display Modes:
Line Mode: Plots the TICK index as a continuous line for a clear view of real‑time values and trend direction.
Bar Mode: Uses traditional bar charts to represent the TICK index, emphasizing the magnitude of changes.
Heikin Ashi Mode: Applies the Heikin Ashi technique to smooth out fluctuations, making the underlying trend easier to discern.
Iceberg TICK Mode: Fills the area between zero and the highs in green, and between zero and the lows in red—highlighting how long the market remains in positive versus negative territory.
How It Works & Usage:
These display modes enable traders to select the visualization that best fits their analysis style. For instance, Iceberg TICK Mode highlights the duration of market strength or weakness, a critical factor for intraday directional assessment.
Comparison of Display Modes
► Dual Moving Average – Fast & Slow:
Computes two moving averages on the TICK index:
• Fast MA – reacts quickly to recent changes.
• Slow MA – confirms the overall trend.
Crossovers provide clear signals:
• Fast MA crossing above the slow MA indicates rising bullish momentum.
• Fast MA crossing below the slow MA indicates increasing bearish pressure.
How It Works & Usage:
These dual moving averages assist in detecting momentum shifts. Crossover signals can be used to time entries and exits to align with prevailing market sentiment.
Dual MA Crossover Example
► Moving Average / Smoothed MA – Smoothed & Base Moving Averages:
Calculates a Base MA and a Smoothed MA on the TICK index to reduce short‑term volatility.
Helps clarify the prevailing trend, providing additional confirmation alongside the dual moving averages.
How It Works & Usage:
These averages filter out noise and offer extra validation of the current trend, enhancing the reliability of trading signals.
Base and Smoothed MA Example
► Moving Average Ribbon – MA Ribbon:
Independently plots several moving averages together as a “ribbon,” each line customizable in length and type.
Visually reflects overall market directional strength:
• Consistent green color indicate sustained bullish conditions.
• Uniform red color indicate prevailing bearish sentiment.
How It Works & Usage:
The MA Ribbon provides a layered perspective on market internals. It enables traders to quickly gauge the robustness of a trend or identify early signs of a potential reversal.
MA Ribbon Trend and Shading
► Divergence - Pivot based – Divergence & Pivot Analysis:
Integrates divergence detection with pivot-based trendline analysis.
Identifies instances when the TICK index and price action diverge, serving as an early warning of a weakening trend.
How It Works & Usage:
Divergence signals help refine trade entries and exits by indicating potential trend reversals or adjustments in market sentiment.
Divergence Analysis
► TICK Distribution Profile – TICK Distribution Profile:
Divides the TICK index range into multiple bins to create a profile of how TICK values are distributed.
Identifies the point of control—the level where most TICK readings concentrate—relative to zero.
Allows adjustment of the lookback period to detect shifts in market bias, such as a move from a neutral zone toward extreme levels.
How It Works & Usage:
By visualizing the distribution of TICK readings, traders can monitor changes in market internals that may precede significant trend changes.
TICK Distribution Profile
► ZigZag – ZigZag:
Applies a zigzag algorithm to filter out minor fluctuations and identify significant swing highs and lows.
Highlights trend extremities and potential reversal points.
Offers an optional extension to the last bar for dynamic trend tracking.
How It Works & Usage:
The ZigZag feature helps traders focus on the major price swings that define market structure, eliminating the noise of insignificant movements.
ZigZag Example
► Pivot Trendline – Pivot Trendline:
Draws trendlines connecting pivot highs and pivot lows.
Provides settings to display only the most recent trendline or extend the last trendline.
Assists in identifying evolving support and resistance levels.
How It Works & Usage:
Pivot trendlines offer clear visual cues for key price levels and potential reversal zones, aiding in the timing of trades.
Pivot Trendline Example
► TICK Levels – TICK Levels:
Defines key thresholds for the TICK index, including neutral levels, trend zones, and overbought/oversold (OB/OS) extremes.
Highlights these levels to assist in identifying conditions that may trigger caution or present opportunities.
How It Works & Usage:
Marking these levels provides an immediate reference for assessing when the TICK index enters critical zones, guiding risk management and trade planning.
TICK Levels
► Background Color – Background Color:
Optionally changes the chart background based on TICK or moving average thresholds.
Provides additional visual cues regarding shifts in market sentiment.
How It Works & Usage:
Background color changes help reinforce key signals by immediately indicating shifts in market internals, enhancing overall situational awareness.
Background Color Example
► Data Tables – Data Table:
Displays essential market data in a single, easy-to-read table, including the TICK index source, market sentiment (e.g. Bullish, Bearish, or Neutral), trend status (such as Accelerating ⇗ or Retracing ⇘), and the current TICK value with color-coded strength.
Consolidates numerical data for a quick and precise assessment of market internals.
How It Works & Usage:
The data tables provide live, numerical feedback that complements the visual analysis, making it easy to monitor market sentiment and trend changes at a glance.
Data Table Display with Metrics
--------------------------------------------------------------------------------------------------------
█ Customization & Input Flexibility:
TICK+ offers extensive input options organized into feature‑specific groups, enabling traders to tailor the tool to various strategies:
► Market Internals Group:
Selects the primary TICK index source (with an optional custom override).
Provides a choice of display modes (Line, Bar, Heikin Ashi, Iceberg TICK) with configurable color schemes.
Includes options for iceberg overlays and highlighting.
► Moving Averages Groups (Dual, Smoothed/Base, MA Ribbon):
Dual MA group: Settings for fast and slow moving averages, including type, length, color, and crossover alerts.
Smoothed/Base MA group: Additional methods to filter out short‑term noise and confirm trends.
MA Ribbon group: Independently plots multiple moving averages as a ribbon, with full customization for each line.
► Divergence & Profile Groups:
Includes inputs for divergence detection (source, pivot lookback) and customization of the TICK Distribution Profile (lookback period, color thresholds, layout details).
► ZigZag & Pivot Trendline Groups:
Allows customization of zigzag parameters to highlight trend extremities.
Provides settings for pivot trendline appearance and behavior.
► TICK Levels & Background Colors:
Defines thresholds for neutral, trend, and extreme levels.
Offers color selections for level markers and optional background shading.
► Data Table Configuration:
Enables setting of table location, lookback intervals, and font size to present essential TICK metrics in a user‑friendly format.
--------------------------------------------------------------------------------------------------------
█ Additional Insights:
► TICK Index Fundamentals:
Monitors the net difference between stocks ticking up and down.
A positive reading indicates broader market participation, while a negative reading suggests increased selling pressure.
Understanding how long the TICK stays above or below zero is crucial for gauging intraday momentum.
► Role of Moving Averages:
Smooth out short‑term fluctuations, helping to highlight the prevailing trend.
Crossovers between fast and slow MAs can serve as clear signals for market momentum shifts.
► Interpreting the MA Ribbon:
Provides a layered perspective on market direction.
Consistent color and alignment confirm a strong trend, while variations may hint at reversals.
► Utility of the Distribution Profile:
Breaks down the TICK index into bins, identifying the point of control.
Changes in this control zone—particularly over different lookback periods—can signal potential trend changes.
► Precision of Data Tables:
Supplies live numerical feedback on key market internals, ensuring trading decisions are based on precise, real‑time measurements.
► Comparative Advantage:
Unlike many TICK tools that simply plot raw values, TICK+ provides an integrated, multidimensional analysis of market internals.
Its advanced features—ranging from unique display modes to sophisticated analytical components—make it indispensable for trading US indices, futures, and blue‑chip stocks.
--------------------------------------------------------------------------------------------------------
Disclaimer
This indicator is provided for educational and research purposes only and does not constitute financial advice. Trading involves risk, and thorough testing on historical data is recommended before applying any strategy using TICK+ in live markets.
Index

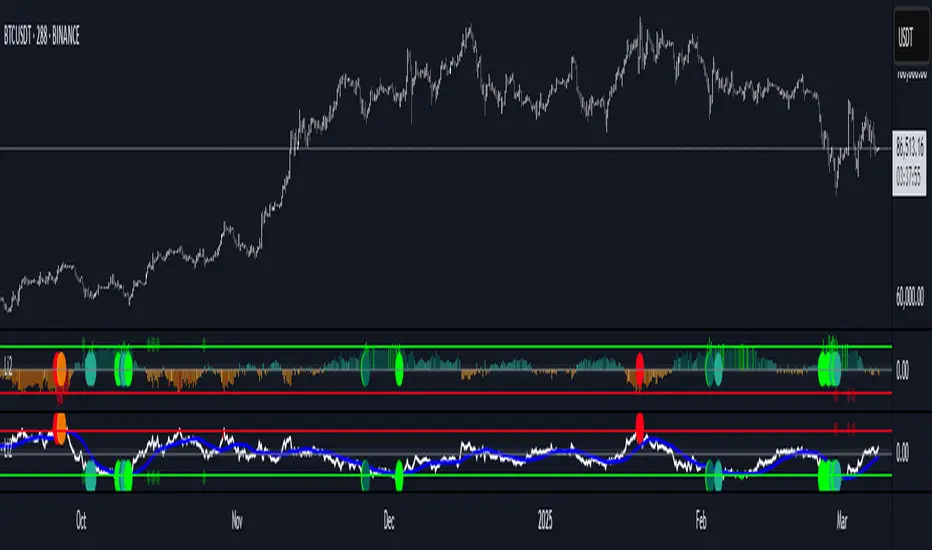
Liquidity Imbalance Index (Li2)How to Use the Liquidity Imbalance Index (Li2)
The Liquidity Imbalance Index (Li2) is designed to track market liquidity and identify significant imbalances between buyers and sellers. Here's how to effectively use this indicator in your trading:
Understanding the Main Components
1. Liquidity Delta Histogram/Line:
- Shows the difference between buy and sell liquidity
- Green bars/line: Buying pressure dominates
- Red bars/line: Selling pressure dominates
- The intensity of color shows the strength of the imbalance
2. Threshold Lines:
- Upper (green) threshold: Marks significant buy pressure
- Lower (red) threshold: Marks significant sell pressure
- Neutral zone: Area between the dotted lines where neither buyers nor sellers dominate
3. Liquidity Zones (circles shown on top/bottom):
- Green circles on upper threshold: Historical bull zones (significant buying interest)
- Red circles on lower threshold: Historical bear zones (significant selling interest)
- These zones require multiple hits, consecutive signals, and optionally volume confirmation
Trading Strategies
For Trend Trading
1. Look for when the Liquidity Delta crosses above the upper threshold for bullish signals
2. Look for when the Liquidity Delta crosses below the lower threshold for bearish signals
3. Especially powerful when crossing occurs with acceleration (darker histogram colors)
For Support and Resistance
1. Identify where the significant bull/bear zones appear (green/red circles)
2. These often align with important price levels where orders cluster
3. Use these zones as potential reversal or confirmation points
For Divergence
1. Watch for price making new highs/lows while liquidity shows the opposite
2. Divergence between price and liquidity can signal potential reversals
Volume Confirmation
1. Pay attention to volume-confirmed signals (small circles at zero line)
2. These indicate stronger conviction behind the liquidity imbalance
Optimal Settings
- For day trading or volatile markets, consider reducing lookback periods and increasing thresholds
- For swing trading, the default settings work well to capture significant zones
- In ranging markets, focus on the zones as they often mark the range boundaries
- In trending markets, follow the overall direction of the liquidity delta
Reading Acceleration Signals
The indicator shows color intensity variations to highlight acceleration in liquidity flows:
- Dark green/red: Strong acceleration (rapid shift in order flow)
- Medium green/red: Medium acceleration
- Light green/red: Weak acceleration
These acceleration signals often precede significant price movements.
Custom Index CompositeCustom Index Composite calculates an unweighted composite index by averaging the daily returns of multiple stock tickers. Instead of using price-level weighting, it focuses solely on percentage change, allowing you to compare diverse market themes side by side on a common basis.
Why Use a Custom Index Composite?
Unlike traditional indices that often lean on market capitalization or price-level data, a custom composite based solely on returns strips out the bias inherent to high-priced stocks. This provides several benefits:
Objective Cross-Comparison:
When stocks or market themes trade at very different price levels, it can be difficult to assess performance objectively. Using percentage returns, the composite creates an even playing field, enabling a clear comparison between different assets or themes.
Tailored Benchmarking:
By selecting and combining specific tickers, you can create benchmarks that better represent the segments or strategies you’re interested in. This is particularly useful when standard indices do not capture the nuances of your investment approach.
Performance Normalization:
Converting raw price data into daily percentage returns minimizes distortions that arise from price differences. This normalization helps in understanding true performance trends across the chosen tickers, making the composite index a more reliable gauge of relative market movement.
Custom Analysis Framework:
The indicator offers flexibility to adjust the lookback period (defaulting to about 3 months) so you can fine-tune the sensitivity of the index to recent market behavior. This enables you to either smooth out volatility or capture a more immediate trend, depending on your analytical needs.
Key Features:
Configurable Appearance:
You can easily configure the line color, line width, index name, and index name color via the options panel.
Ticker Configuration:
By default, you can enter up to 15 different tickers into the composite index. Technically, the indicator supports up to 40 tickers (these additional inputs are commented out by default to maintain performance), and you may enable them individually if required.
Calculated Bars Length:
The indicator uses a “Calculated bars length” setting, which is set by default to 63 days (approximately 3 months). This value can be adjusted, and it is recommended to use the greatest common denominator for consistent analysis.
How To Configure Your Chart:
Add the Indicator:
Place the Custom Index Composite on your chart.
Disable Main Symbol Visibility:
Hide the primary symbol’s plot and set its scale to “None” to prevent interference with the composite display.
Pin to Right Scale:
Set the scale of the first composite indicator to “Pinned to right scale.” This helps maintain consistency across different composite indicators.
Add Multiple Composites:
You can add additional composite indicators and set their scales to “Pinned to right scale” (or alternatively to “A”) for convenient comparison.
Limitations:
If a ticker symbol is set once in the options, it cannot be cleared to an empty value later. As a result, the symbol will continue to appear in the indicator’s title on the chart. The only way to remove an unwanted symbol is to completely reset the settings and re-enter your desired tickers.

RSI Signal Pro[UgurTash]Introducing RSI Signal Pro for TradingView
RSI Signal Pro is a refined version of the standard Relative Strength Index (RSI) , designed to improve signal accuracy by generating alerts in real-time instead of waiting for multiple candle confirmations. This enhancement allows traders to react faster to market movements while maintaining the familiar RSI structure.
What Makes RSI Signal Pro Unique?
✅ Real-Time RSI Signals: Unlike the traditional RSI, which waits for candle confirmations, this version provides immediate buy and sell signals upon key level crossovers.
✅ Dual Trading Modes: Choose between Simple Mode (standard RSI crossovers) and Advanced Mode (momentum-adjusted signals with price validation).
✅ Customizable RSI-Based Moving Average (MA): Optionally apply SMA, EMA, WMA, or VWMA to smooth RSI fluctuations and identify longer-term trends.
✅ Adaptive Signal Filtering: The Advanced Mode reduces false signals by filtering RSI movements with a momentum threshold and historical RSI validation.
✅ User-Friendly Interface: Simple ON/OFF toggles allow easy customization of the indicator's behavior.
How This Indicator Works
🔹 Simple Mode: Identical to traditional RSI, triggering signals when RSI crosses 30 (bullish) or 70 (bearish).
🔹 Advanced Mode: Uses historical RSI pivots, momentum verification, and price confirmation to refine signal accuracy—ideal for traders looking for more precise entries.
🔹 RSI-Based MA: Optionally overlay moving averages onto the RSI, providing additional trend confirmation.
How to Use RSI Signal Pro
1️⃣ Select a mode: Use Simple Mode for frequent alerts or Advanced Mode for refined signals.
2️⃣ Enable RSI-Based MA: Apply SMA, EMA, WMA, or VWMA to smooth RSI fluctuations.
3️⃣ Set alerts: TradingView notifications allow you to react to real-time RSI movements instantly.
4️⃣ Apply to multiple markets: Effective for crypto, forex, stocks, and commodities.
Why Use RSI Signal Pro Instead of Standard RSI?
While RSI Signal Pro maintains the core functionality of the standard RSI, its real-time signal generation allows traders to make faster decisions without the typical delay caused by waiting for candle confirmations. Additionally, the optional momentum filtering and moving average smoothing ensure fewer false signals and better trade accuracy.

Waldo Cloud Bollinger Bands
Waldo Cloud Bollinger Bands Indicator Description for TradingView
Title: Waldo Cloud Bollinger Bands
Short Title: Waldo Cloud BB
Overview:
The Waldo Cloud Bollinger Bands indicator is a sophisticated tool designed for traders looking to combine the volatility analysis of Bollinger Bands with the momentum insights of the Relative Strength Index (RSI) and moving average crossovers. This indicator overlays on your chart, providing a visual representation that helps in identifying potential trading opportunities based on price action, momentum, and trend direction.
Concept:
This indicator merges three key technical analysis concepts:
Bollinger Bands: These are used to measure market volatility. The bands consist of a central moving average (basis) with an upper and lower band that are standard deviations away from this average. In this indicator, you can customize the type of moving average used for the basis (SMA, EMA, SMMA, WMA, VWMA), the length of the period, the source price, and the standard deviation multiplier, offering flexibility to adapt to different market conditions.
Relative Strength Index (RSI): The RSI is incorporated to provide insight into the momentum of price movements. Users can adjust the RSI length and overbought/oversold levels and even choose the price source for RSI calculation, allowing for tailored momentum analysis. The RSI values influence the cloud color between the Bollinger Bands, signaling market conditions.
Moving Average Crossovers: Two moving averages with customizable lengths and types are used to identify trend direction through crossovers. A fast MA (default 20 periods) and a slow MA (default 50 periods) are plotted when enabled, helping to signal potential bullish or bearish market conditions when they cross over each other.
Functionality:
Bollinger Bands Calculation: The basis of the Bollinger Bands is calculated using a user-defined moving average type, with a customizable length, source, and standard deviation multiplier. The upper and lower bands are then plotted around this basis.
RSI Calculation: The RSI is computed using a user-specified source, length, and overbought/oversold levels. This RSI value is used to determine the color of the cloud between the Bollinger Bands, which visually represents market sentiment:
Purple when RSI is overbought.
Blue when RSI is oversold.
Green for bullish conditions (when the fast MA crosses above the slow MA, RSI is bullish, and the price is above the slow MA).
Red for bearish conditions (when the fast MA crosses below the slow MA, RSI is bearish, and the price is below the slow MA).
Gray for neutral conditions.
Trend Analysis: The indicator uses two moving averages to help determine the trend direction.
When the fast MA crosses over the slow MA, it suggests a potential change in trend direction, which, combined with RSI conditions, provides a more comprehensive trading signal.
Customization:
Users can select the type of moving average for all calculations through the "Global MA Type" setting, ensuring consistency in how trends and volatility are interpreted.
The Bollinger Bands settings allow for adjustments in length, source, standard deviation, and offset, giving traders control over how volatility is measured.
RSI settings include the ability to change the RSI source, length, and overbought/oversold thresholds, which can be fine-tuned to match trading strategies.
The option to show or hide moving averages provides clarity on the chart, focusing on either the Bollinger Bands or including the MA crossovers for trend analysis.
Usage:
This indicator is ideal for traders who incorporate both volatility and momentum in their trading decisions.
By observing the color changes in the cloud, along with the position of the price relative to the moving averages, traders can gauge potential entry and exit points.
For instance, a green cloud with a price above the slow MA might suggest a strong buying opportunity, while a red cloud with a price below might indicate selling pressure.
Conclusion:
The Waldo Cloud Bollinger Bands indicator offers a unique blend of volatility, momentum, and trend analysis, providing traders with a multi-faceted view of market conditions. Its customization options make it adaptable to various trading styles and market environments, making it a valuable addition to any trader's toolkit on Trading View.

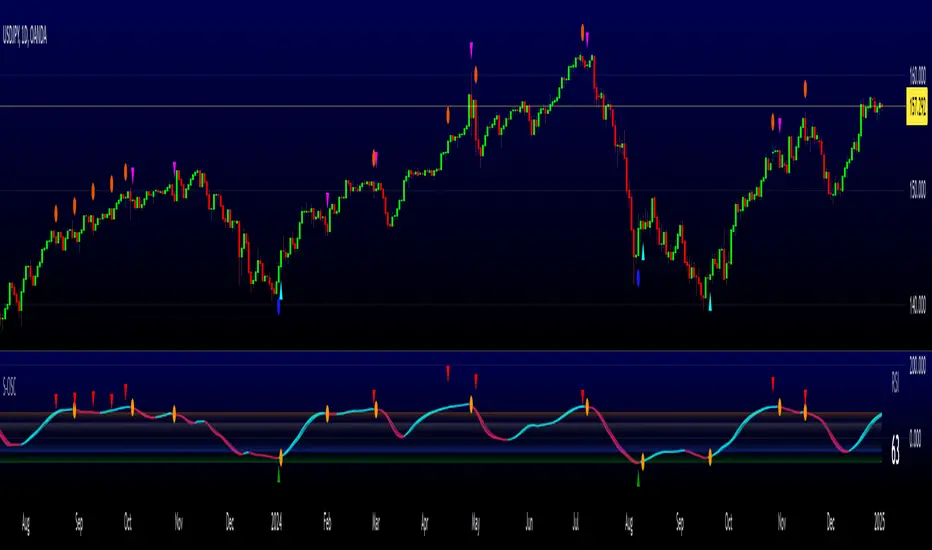
Waldo RSI :oWaldo RSI :o Indicator Guide
The Waldo RSI :o indicator is designed to complement the "Waldo RSI Overlay :o" by providing an RSI-based analysis on TradingView, focusing on macro shifts in market trends. Here's a comprehensive guide on how to use this indicator:
Key Features:
RSI Settings:
RSI Source: Choose from ON RSI, ON HIGH, ON LOW, ON CLOSE, or ON OPEN to determine how RSI calculates pivots.
RSI Settings:
Source: Default is (H+L)/2, but you can select any price for RSI calculation.
Length: Default RSI length is 7, which can be adjusted for sensitivity.
Trend Lines:
Show Trend Lines: Option to display trend lines based on RSI pivot points.
Zigzag Length: Determines pivot point sensitivity.
Confirm Length: Validates pivot points (default is 3).
Colors: Customize colors for Higher Highs (HH), Lower Highs (LH), Higher Lows (HL), and Lower Lows (LL) on the RSI.
Label Size and Line Width: Adjust the appearance of labels and lines.
Divergences:
Classic Divergences:
Show Classic Div: Toggle to reveal divergences where RSI and price move in opposite directions.
Colors: Set different colors for bullish and bearish divergence indicators.
Transparency and Line Width: Control the visual impact of divergence signals.
Hidden Divergences:
Similar settings for identifying hidden divergences, suggest trend continuation.
Breakout/Breakdown:
Show Breakout/Breakdown: Generates signals for RSI breakouts or breakdowns, used by "Waldo RSI Overlay :o" for visual chart signals.
Overbought/Oversold Zones:
Show Overbought and OverSold Zones: Highlights when RSI goes above 70 (overbought) or below 30 (oversold).
Moving Averages on RSI:
The default Moving Average (MA) settings are tailored to capture macro shifts in market trends:
Show Moving Averages: Option to overlay two MAs on the RSI for trend confirmation:
Fast RSI MA:
RSI Period: 50 (this is the period over which the RSI is calculated).
MA Length: 50 (the number of periods used for the moving average of the RSI).
Slow RSI MA:
RSI Period: 50 (same as fast for consistency in RSI calculation).
MA Length: 200 (longer term for capturing broader trends).
Crossover Signals: The RSI changes color from red to green based on these moving average crossovers:
When the Fast MA (50 period) crosses above the Slow MA (200 period), the RSI turns green, indicating potential bullish conditions or momentum shift.
Conversely, when the Fast MA crosses below the Slow MA, the RSI turns red, suggesting bearish conditions or a shift back towards a downtrend.
This 50-period RSI crossover setting is used to identify overall macro shifts in the market, providing a clear visual cue for traders looking at longer-term trends.
Ghost Lines (Optional):
Ghost Lines: Option to limit how far RSI trend lines extend, helping to keep the chart less cluttered.
How to Use the Indicator:
Setup:
Configure RSI by choosing the source and setting the length to match your trading style.
Set the zigzag and confirm lengths for appropriate pivot detection.
Trend Analysis:
Monitor the RSI for trend changes using the colored trend lines and labels.
Divergence Detection:
Look for RSI and price divergences to anticipate potential reversals or continuations.
Breakout/Breakdown:
Use these signals in conjunction with "Waldo RSI Overlay :o" for price action confirmation.
Overbought/Oversold:
Identify when the market might be due for a correction or continued momentum.
Moving Averages:
Focus on the color changes in RSI to understand macro trend shifts with the default 50/200 period setup.
Ghost Lines:
Enable for a cleaner chart if you don't need trend lines extending indefinitely.
Usage Tips:
Combine with other indicators for confirmation, as no single tool is foolproof.
Adjust settings to suit different market conditions or trading timeframes.
Use in tandem with "Waldo RSI Overlay :o" for a full trading signal system.
Remember, trading involves significant risk, and historical data does not guarantee future performance. Use this indicator as part of a broader trading strategy.

Waldo RSI Overlay :oWaldo RSI Overlay :o Indicator Guide
Welcome to the guide for the Waldo RSI Overlay :o indicator on TradingView. This tool enhances your trading analysis through RSI-based overlays for trend analysis, divergence detection, and breakout/breakdown signals when used with its companion indicator, Waldo RSI :o.
Key Features:
RSI Overlay:
• RSI Source: Choose from:
o ON RSI: Uses the RSI values directly to detect pivots, focusing on RSI highs and lows for trend analysis.
o ON HIGH, ON CLOSE, ON LOW, ON OPEN:
These options base pivot detection on price action at those specific points, offering an alternative market structure view.
• RSI Settings:
o Source: Default is (H+L)/2, but you can select any price for RSI calculation.
o Length: Default RSI length is 7, which you can adjust for sensitivity.
Trend Lines:
• Show Trend Lines: Toggle to display trend lines based on pivot points.
• Zigzag Length: Sets the sensitivity of pivot point detection.
• Confirm Length: Ensures the validity of pivot points (default is 3).
• Colors: Customize colors for Higher Highs (HH), Lower Highs (LH), Higher Lows (HL), and Lower Lows (LL).
• Transparency and Line Width: Control how trend lines and fills appear.
• Label Size: Adjust the size of labels identifying pivot points.
Divergences:
• Classic Divergences:
o Show Classic Div: Enable to highlight regular divergences where price and RSI move in opposite directions.
o Colors: Define colors for bullish and bearish divergence lines and labels.
o Transparency and Line Width: Adjust the visual impact of divergence signals.
• Hidden Divergences:
o Similar settings as classic, but these highlight divergences indicating trend continuation.
Breakout/Breakdown:
• Show Breakout/Breakdown: When activated, this feature signals when the price breaks through previous highs or lows. To activate these breakouts, you need the companion indicator Waldo RSI :o, select the SRC in the External section, and select the crossovers for each one.
This combination provides RSI confirmation for breakout/breakdown events.
Overbought/Oversold Zones:
• Show Overbought and Oversold Zones: Bars are colored when RSI exceeds 70 (purple) or falls below 30 (blue), indicating potential market extremes.
Moving Averages (Optional):
• Show Moving Averages: Option to overlay two moving averages for trend confirmation.
• Source, Type, Length: Customize each MA's configuration.
Ghost Lines (Optional):
• Ghost Lines: When enabled, trend lines extend for only a specified period (Ghost Length) instead of indefinitely.
How to Use the Indicator:
1. Setup:
o Configure RSI settings by choosing the RSI Source and adjusting the RSI Length to suit your trading style.
o Set the Zigzag Length and Confirm Length for trend line sensitivity based on market volatility.
2. Trend Analysis:
o Look at the colored horizontal lines and fills for HH, LH, HL, LL to discern market structure and potential reversal points.
3. Divergence Detection:
o Identify divergences where price and RSI diverge. Regular divergences might signal trend exhaustion, while hidden ones could indicate trend persistence.
4. Breakout/Breakdown Signals:
o Ensure you have both the Waldo RSI Overlay :o and Waldo RSI :o indicators applied. Green triangles below bars signal breakouts; red ones above indicate breakdowns, based on price movement with RSI confirmation from the companion indicator.
5. Overbought/Oversold:
o Use these colored zones to spot potential momentum shifts or reversal areas.
6. Moving Averages on RSI:
o If used, these can help confirm trends or identify crossover signals for additional trade confirmation.
7. Ghost Lines:
o For a less cluttered chart, enable this to limit how far trend lines extend.
Tips for Usage:
• Always combine this indicator with other analytical tools for better confirmation. No single indicator should guide all decisions.
• Adjust settings according to the asset's behavior and your trading timeframe.
• Regularly review your settings as market dynamics change.
Remember, trading involves risk, and past performance doesn't predict future outcomes. Use this indicator within a comprehensive trading strategy.

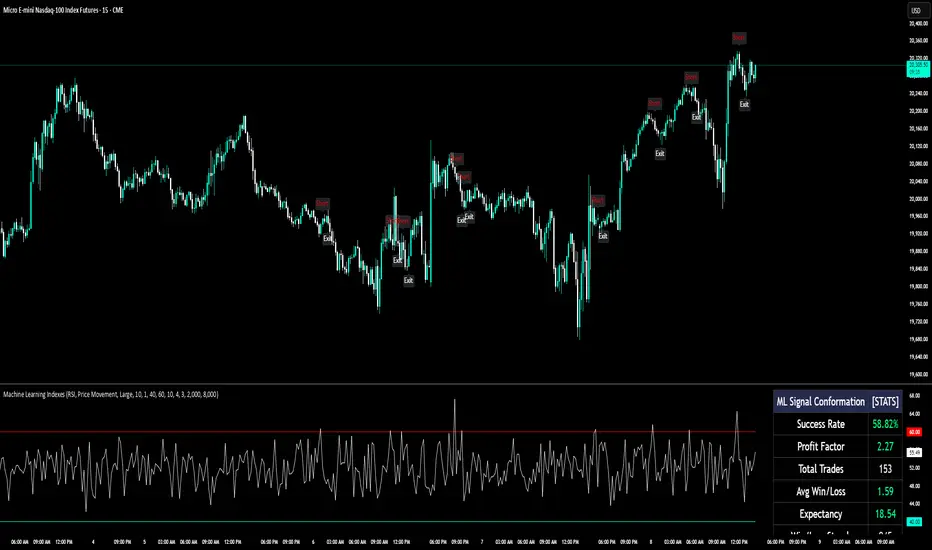
Machine Learning IndexesMachine Learning Indexes Script Description
The Machine Learning Indexes script is an advanced Pine Script™ indicator that applies machine learning techniques to analyze various market data types. It enables traders to generate adaptive long and short signals using highly customizable settings for signal detection and analysis.
Key Features:
Signal Mode: Allows the user to choose between generating signals for "Longs" (buy opportunities) or "Shorts" (sell opportunities).
Index Type: Supports multiple index types including RSI, CCI, MFI, Stochastic, and Momentum. All indexes are normalized between 0-100 for uniformity.
Data Set Selection: Provides options for analyzing Price, Volume, Volatility, or Momentum-based data sets. This enables traders to adapt the script to their preferred market analysis methodology.
Absolute vs. Directional Changes: Includes a toggle to calculate absolute changes for values or maintain directional sensitivity for trend-based analysis.
Dynamic Index Calculation: Automatically calculates and compares multiple index lengths to determine the best fit for current market conditions, adding precision to signal generation.
Input Parameters:
Signal Settings:
Signal Mode: Selects between "Longs" or "Shorts" to define the signal direction.
Index Type: Chooses the type of market index for calculations. Options include RSI, CCI, MFI, Stochastic, and Momentum.
Data Set Type: Determines the basis of the analysis, such as Price, Volume, Volatility, or Momentum-based data.
Absolute Change: Toggles whether absolute or directional changes are considered for calculations.
Index Settings:
Min Index Length: Sets the base index length used for calculations.
Index Length Variety: Adjusts the increment steps for variations in index length.
Lower/Upper Bands: Define thresholds for the selected index, indicating overbought and oversold levels.
Signal Parameters:
Target Signal Size: Number of bars used to identify pivot points.
Backtest Trade Size: Defines the number of bars over which signal performance is measured.
Sample Size: Number of data points used to calculate signal metrics.
Signal Strength Needed: Sets the minimum confidence required for a signal to be considered valid.
Require Low Variety: Option to prioritize signals with lower variability in results.
How It Works:
The script dynamically calculates multiple index variations and compares their accuracy to detect optimal parameters for generating signals.
Signal validation considers the chosen mode (longs/shorts), data set, index type, and signal parameters.
Adaptive moving averages (ADMA) and Band Signals (BS) are plotted to visualize the interaction between market trends and thresholds.
Long and short signals are displayed with clear up (L) and down (S) labels for easy interpretation.
Performance Metrics:
Success Rate: Percentage of valid signals that led to profitable outcomes.
Profit Factor: Ratio of gains from successful trades to losses from unsuccessful trades.
Disclaimer:
This indicator is for informational purposes only and does not guarantee future performance. It is designed to support traders in making informed decisions but should be used alongside other analysis methods and risk management strategies.
Absolute Strength Index [ASI] (Zeiierman)█ Overview
The Absolute Strength Index (ASI) is a next-generation oscillator designed to measure the strength and direction of price movements by leveraging percentile-based normalization of historical returns. Developed by Zeiierman, this indicator offers a highly visual and intuitive approach to identifying market conditions, trend strength, and divergence opportunities.
By dynamically scaling price returns into a bounded oscillator (-10 to +10), the ASI helps traders spot overbought/oversold conditions, trend reversals, and momentum changes with enhanced precision. It also incorporates advanced features like divergence detection and adaptive signal smoothing for versatile trading applications.
█ How It Works
The ASI's core calculation methodology revolves around analyzing historical price returns, classifying them into top and bottom percentiles, and normalizing the current price movement within this framework. Here's a breakdown of its key components:
⚪ Returns Lookback
The ASI evaluates historical price returns over a user-defined period (Returns Lookback) to measure recent price behavior. This lookback window determines the sensitivity of the oscillator:
Shorter Lookback: Higher responsiveness to recent price movements, suitable for scalping or high-volatility assets.
Longer Lookback: Smoother oscillator behavior is ideal for identifying larger trends and avoiding false signals.
⚪ Percentile-Based Thresholds
The ASI categorizes returns into two groups:
Top Percentile (Winners): The upper X% of returns, representing the strongest upward price moves.
Bottom Percentile (Losers): The lower X% of returns, capturing the sharpest downward movements.
This percentile-based normalization ensures the ASI adapts to market conditions, filtering noise and emphasizing significant price changes.
⚪ Oscillator Normalization
The ASI normalizes current returns relative to the top and bottom thresholds:
Values range from -10 to +10, where:
+10 represents extreme bullish strength (above the top percentile threshold).
-10 indicates extreme bearish weakness (below the bottom percentile threshold).
⚪ Signal Line Smoothing
A signal line is optionally applied to the ASI using a variety of moving averages:
Options: SMA, EMA, WMA, RMA, or HMA.
Effect: Smooths the ASI to filter out noise, with shorter lengths offering higher responsiveness and longer lengths providing stability.
⚪ Divergence Detection
One of ASI's standout features is its ability to detect and highlight bullish and bearish divergences:
Bullish Divergence: The ASI forms higher lows while the price forms lower lows, signaling potential upward reversals.
Bearish Divergence: The ASI forms lower highs while the price forms higher highs, indicating potential downward reversals.
█ Key Differences from RSI
Dynamic Adaptability: ASI adjusts to market conditions through percentile-based scaling, while RSI uses static thresholds.
█ How to Use ASI
⚪ Trend Identification
Bullish Strength: ASI above zero suggests upward momentum, suitable for trend-following trades.
Bearish Weakness: ASI below zero signals downward momentum, ideal for short trades or exits from long positions.
⚪ Overbought/Oversold Levels
Overbought Zone: ASI in the +8 to +10 range indicates potential exhaustion of bullish momentum.
Oversold Zone: ASI in the -8 to -10 range points to potential reversal opportunities.
⚪ Divergence Signals
Look for bullish or bearish divergence labels to anticipate trend reversals before they occur.
⚪ Signal Line Crossovers
A crossover between the ASI and its signal line (e.g., EMA or SMA) can indicate a shift in momentum:
Bullish Crossover: ASI crosses above the signal line, signaling potential upside.
Bearish Crossover: ASI crosses below the signal line, suggesting downside momentum.
█ Settings Explained
⚪ Absolute Strength Index
Returns Lookback: Sets the sensitivity of the oscillator. Shorter periods detect short-term changes, while longer periods focus on broader trends.
Top/Bottom Percentiles: Adjust thresholds for defining winners and losers. Narrower percentiles increase sensitivity to outliers.
Signal Line Type: Choose from SMA, EMA, WMA, RMA, or HMA for smoothing.
Signal Line Length: Fine-tune the responsiveness of the signal line.
⚪ Divergence
Divergence Lookback: Adjusts the period for detecting divergence. Use longer lookbacks to reduce noise.
-----------------
Disclaimer
The information contained in my Scripts/Indicators/Ideas/Algos/Systems does not constitute financial advice or a solicitation to buy or sell any securities of any type. I will not accept liability for any loss or damage, including without limitation any loss of profit, which may arise directly or indirectly from the use of or reliance on such information.
All investments involve risk, and the past performance of a security, industry, sector, market, financial product, trading strategy, backtest, or individual's trading does not guarantee future results or returns. Investors are fully responsible for any investment decisions they make. Such decisions should be based solely on an evaluation of their financial circumstances, investment objectives, risk tolerance, and liquidity needs.
My Scripts/Indicators/Ideas/Algos/Systems are only for educational purposes!

Stochastics Oscillator with Buy/Sell Indicator [iSTAGs]iSTAGs "Stochastics Oscillator" with Buy/Sell Indicator
Overview
The Stochastics Oscillator is a versatile trading indicator designed to provide comprehensive insights into market momentum and potential price reversals. With its multi-layered approach, it incorporates a blend of oscillators, smoothed averages, and relative strength measures to deliver actionable trading signals.
Disclaimer
This indicator is provided for study purposes only . While it may assist in identifying potential buy and sell opportunities, please note:
1. False Signals: The buy/sell indicators may generate false signals. Always validate signals using additional analysis or tools.
2. Trading Strategies: Use appropriate exit points and stop-loss levels as part of your overall trading strategy.
3. No Guarantees: Do not rely solely on this indicator for trading decisions. Market conditions may change, and no indicator guarantees accurate results.
4. Strategy Testing: The strategy associated with this indicator is not tested, and backtesting features are not available at this time.
Key Features
1. Stochastics Oscillator
• Combines the smoothed ranges of price movement to identify overbought and oversold conditions.
• Inbuilt signal lines helps pinpoint potential crossovers for trend reversals.
2. Zones Highlighting
• Clearly visualized zones for:
o Overbought (70–100): Caution for potential reversals.
o Bullish (0–40): Positive momentum.
o Bearish (0 to -40): Negative momentum.
o Oversold (-70 to -100): Potential buying opportunities.
3. Buy and Sell Signals
• Primary Buy/Sell Indicator: Highlighted directly on the chart for ease of use.
• Potential Buy/Sell Signals: Secondary indicators based on advanced crossover conditions that can generate early signals.
4. RSI Integration
• Realtime RSI value display for an additional layer of confirmation.
• Color-coded RSI values to easily interpret market strength:
o Red: Overbought (>80)
o Orange: Strong momentum (70–80)
o White: Neutral (30–70)
o Blue: Weak momentum (20–30)
o Green: Oversold (<20)
5. Limited Customizable Visuals
o Clean and color-coded plots and fills make it intuitive to identify trends and trading opportunities at a glance.
How to Use
1. Trading Signals:
• Use buy/sell shapes and flags for identifying potential entry and exit points.
• Combine primary buy/sell indicator and secondary buy/sell signals for higher confidence.
2. Trend Confirmation:
• Monitor the oscillator and signal crossovers alongside zone fills to gauge market direction.
3. RSI Analysis:
• Keep an eye on the RSI value and its color coding for confirmation of overbought or oversold conditions.
Settings
• Enable/Disable Features: Customize the visibility of Buy/Sell indicators, Potential Signals, and RSI display.
• Editable Zones: Adjust zone colors and ranges to suit your trading strategy.
Conclusion
The Stochastics Oscillator is a powerful tool for traders seeking to enhance their technical analysis. Its layered approach provides clarity, precision, and adaptability for a wide range of trading strategies, whether you're a scalper, swing trader, or long-term investor.
________________________________________
Developed by iSTAGs
________________________________________
Happy Trading! 🎯
RSI+EMA+MZONES with DivergencesFeatures:
1. RSI Calculation:
Uses user-defined periods to calculate the RSI and visualize momentum shifts.
Plots key RSI zones, including upper (overbought), lower (oversold), and middle levels.
2. EMA of RSI:
Includes an Exponential Moving Average (EMA) of the RSI for trend smoothing and confirmation.
3. Bullish and Bearish Divergences:
Detects Regular divergences (labeled as “Bull” and “Bear”) for classic signals.
Identifies Hidden divergences (labeled as “H Bull” and “H Bear”) for potential trend continuation opportunities.
4. Customizable Labels:
Displays divergence labels directly on the chart.
Labels can be toggled on or off for better chart visibility.
5. Alerts:
Predefined alerts for both regular and hidden divergences to notify users in real time.
6. Fully Customizable:
Adjust RSI period, lookback settings, divergence ranges, and visibility preferences.
Colors and styles are easily configurable to match your trading style.
How to Use:
RSI Zones: Use RSI and its zones to identify overbought/oversold conditions.
EMA: Look for crossovers or confluence with divergences for confirmation.
Divergences: Monitor for “Bull,” “Bear,” “H Bull,” or “H Bear” labels to spot key reversal or continuation signals.
Alerts: Set alerts to be notified of divergence opportunities without constant chart monitoring.

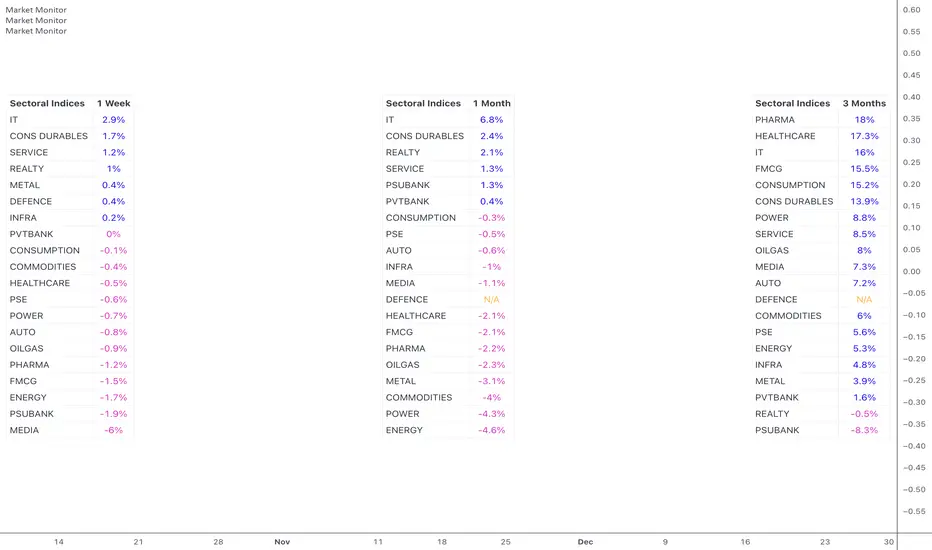
Market MonitorOverview
The Market Monitor Indicator provides a customisable view of dynamic percentage changes across selected indices or sectors, calculated by comparing current and previous closing prices over the chosen timeframe.
Key Features
Choose up to 20 predefined indices or your own selected indices/stocks.
Use checkboxes to show or hide individual entries.
Monitor returns over daily, weekly, monthly, quarterly, half-yearly, or yearly timeframes
Sort by returns (descending) to quickly identify top-performing indices or alphabetically for an organised and systematic review.
Customisation
Switch between Light Mode (Blue or Green themes) and Dark Mode for visual clarity.
Adjust the table’s size, position, and location.
Customise the table title to your own choice e.g. Sectoral, Broad, Portfolio etc.
Use Cases
Use multiple instances of the script with varying timeframes to study sectoral rotation and trends.
Customise the stocks to see your portfolio returns for the day or over the past week, or longer.
Employee Portfolio Generator [By MUQWISHI]▋ INTRODUCTION :
The “Employee Portfolio Generator” simplifies the process of building a long-term investment portfolio tailored for employees seeking to build wealth through investments rather than traditional bank savings. The tool empowers employees to set up recurring deposits at customizable intervals, enabling to make additional purchases in a list of preferred holdings, with the ability to define the purchasing investment weight for each security. The tool serves as a comprehensive solution for tracking portfolio performance, conducting research, and analyzing specific aspects of portfolio investments. The output includes an index value, a table of holdings, and chart plots, providing a deeper understanding of the portfolio's historical movements.
_______________________
▋ OVERVIEW:
● Scenario (The chart above can be taken as an example) :
Let say, in 2010, a newly employed individual committed to saving $1,000 each month. Rather than relying on a traditional savings account, chose to invest the majority of monthly savings in stable well-established stocks. Allocating 30% of monthly saving to AMEX:SPY and another 30% to NASDAQ:QQQ , recognizing these as reliable options for steady growth. Additionally, there was an admired toward innovative business models of NASDAQ:AAPL , NASDAQ:MSFT , NASDAQ:AMZN , and NASDAQ:EBAY , leading to invest 10% in each of those companies. By the end of 2024, after 15 years, the total monthly deposits amounted to $179,000, which would have been the result of traditional saving alone. However, by sticking into long term invest, the value of the portfolio assets grew, reaching nearly $900,000.
_______________________
▋ OUTPUTS:
The table can be displayed in three formats:
1. Portfolio Index Title: displays the index name at the top, and at the bottom, it shows the index value, along with the chart timeframe, e.g., daily change in points and percentage.
2. Specifications: displays the essential information on portfolio performance, including the investment date range, total deposits, free cash, returns, and assets.
3. Holdings: a list of the holding securities inside a table that contains the ticker, last price, entry price, return percentage of the portfolio's total deposits, and latest weighted percentage of the portfolio. Additionally, a tooltip appears when the user passes the cursor over a ticker's cell, showing brief information about the company, such as the company's name, exchange market, country, sector, and industry.
4. Indication of New Deposit: An indication of a new deposit added to the portfolio for additional purchasing.
5. Chart: The portfolio's historical movements can be visualized in a plot, displayed as a bar chart, candlestick chart, or line chart, depending on the preferred format, as shown below.
_______________________
▋ INDICATOR SETTINGS:
Section(1): Table Settings
(1) Naming the index.
(2) Table location on the chart and cell size.
(3) Sorting Holdings Table. By securities’ {Return(%) Portfolio, Weight(%) Portfolio, or Ticker Alphabetical} order.
(4) Choose the type of index: {Assets, Return, or Return (%)}, and the plot type for the portfolio index: {Candle, Bar, or Line}.
(5) Positive/Negative colors.
(6) Table Colors (Title, Cell, and Text).
(7) To show/hide any of selected indicator’s components.
Section(2): Recurring Deposit Settings
(1) From DateTime of starting the investment.
(2) To DateTime of ending the investment
(3) The amount of recurring deposit into portfolio and currency.
(4) The frequency of recurring deposits into the portfolio {Weekly, 2-Weeks, Monthly, Quarterly, Yearly}
(5) The Depositing Model:
● Fixed: The amount for recurring deposits remains constant throughout the entire investment period.
● Increased %: The recurring deposit amount increases at the selected frequency and percentage throughout the entire investment period.
(5B) If the user selects “ Depositing Model: Increased % ”, specify the growth model (linear or exponential) and define the rate of increase.
Section(3): Portfolio Holdings
(1) Enable a ticker in the investment portfolio.
(2) The selected deposit frequency weight for a ticker. For example, if the monthly deposit is $1,000 and the selected weight for XYZ stock is 30%, $300 will be used to purchase shares of XYZ stock.
(3) Select up to 6 tickers that the investor is interested in for long-term investment.
Please let me know if you have any questions

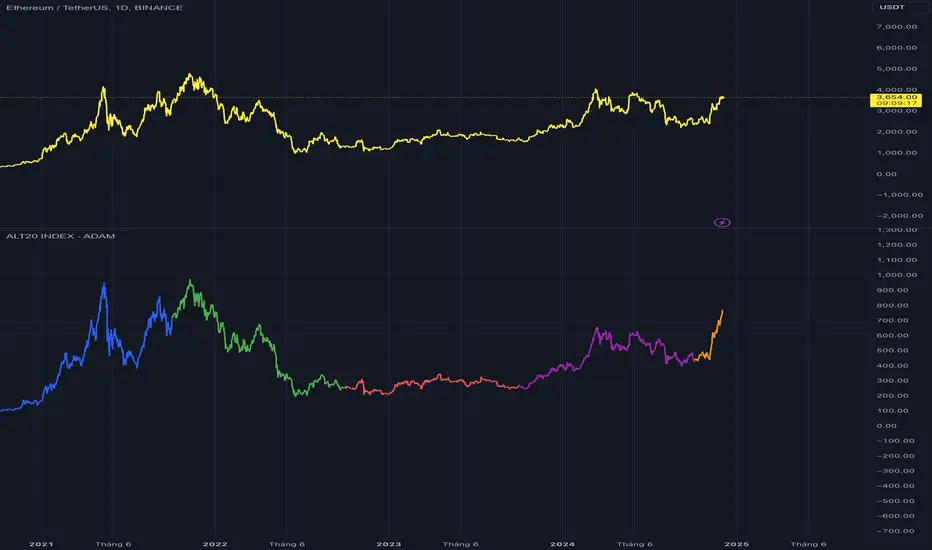
TOP 20 ALTCOIN INDEXIndicator Description
The "ALT20 INDEX" is a financial analysis tool designed to track the aggregate value of the top 20 cryptocurrencies by market capitalization and closing prices over specific periods. This indicator reflects changes in the combined value of these 20 ALTCOINs, providing an overview of trends in the cryptocurrency market.
=================================
Purpose and Practical Applications
1. Tracking Top Cryptocurrencies:
- The indicator allows monitoring the value of the top 20 ALTCOINs, reflecting the general volatility of the cryptocurrency market.
- Helps investors focus on high-capitalization assets.
2. Performance Comparison:
- Serves as a tool to compare the performance of the ALT20 group against other assets like Bitcoin, Ethereum, or traditional financial indices.
3. Assessing Market Health:
- Enables evaluation of market trends, identifying growth or decline periods.
4. Practical Applications:
- Suitable for fund managers, long-term investors, or trend traders to make decisions based on the overall ALTCOIN market performance.
-------------------------------------------
How the Indicator Works
1. Selection of Top 20 ALTCOINs:
- Cryptocurrencies are selected based on their market capitalization at each rebalancing period.
2. Weight Allocation and Calculation:
- Weight: Determined by the market capitalization of each ALTCOIN relative to the total market capitalization of the top 20.
- Token Quantity: Calculated based on weight, total allocation points (e.g., 100 points for T1, 722.63 points for T2, etc.), and each ALTCOIN's closing price.
Formula: Token Quantity = Weight × Total Allocation Points/Closing Price
3. Periodic Rebalancing:
- Rebalancing frequency: Once a year.
- At each rebalancing period, the weights and token quantities are adjusted based on new market capitalization and prices.
4. Portfolio Value Calculation:
- The value of each ALTCOIN is calculated as:
Token Value = Closing Price × Token Quantity
- Index Total: ALT20 Index = 20∑'i=1'Token Value'i'
------------------------------------------
Rebalancing Periods
T1 (2020-2021): Initial period, token quantities calculated based on weights and a total of 100 points.
T2 (2021-2022): Rebalanced with a total allocation of 722.63 points.
T3 (2022-2023): Total allocation of 252.26 points, reflecting portfolio adjustments based on new prices and market caps.
T4 (2023-2024): Total allocation of 261.43 points.
T5 (2024-Present): Total allocation of 437.42 points, updated to reflect the current market.
-----------------------------------------
Indicator Features
- Displays Index Value Over Time:
+ index_value_T1 to index_value_T5 represent the portfolio value during specific timeframes.
+ Values are calculated based on the daily closing prices of ALTCOINs.
- Visualization:
+ The index for each period is plotted on the chart, enabling easy observation of market trends over time.
---------------------------------------
Practical Applications
- Portfolio Management:
+ The indicator helps track the performance of asset groups within the ALTCOIN portfolio.
- Integration into Trading Systems:
+ Used as a reference for automated or manual trading strategies.
- Market Analysis:
+ Assists analysts in evaluating cryptocurrency market movements based on the top 20 ALTCOINs.
Let me know if further optimization or additional information is needed! Thank!
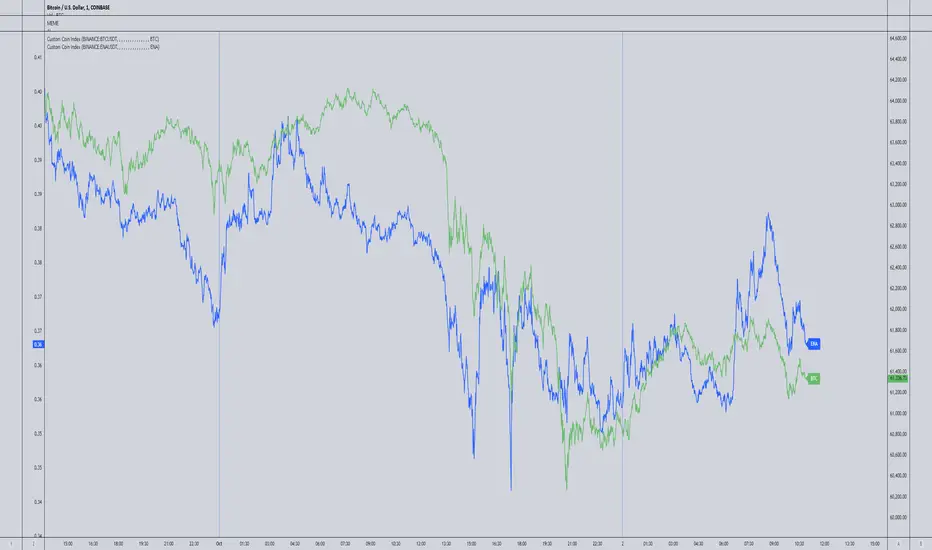
Crypto Index Creator (MEMES & AI Supercycle Dominance, etc)This indicator aims to help to create any INDEX desired including but not limited to its Market Cap and Dominance on the crypto market.
This script was inspired originally by Murad's "Memecoins Dominance" but then I extended it to AI and can be extended to anything in fact, so you can create any index!
I made each token entry editable so that the script can survive the evolution of time as likely projects and INDEXES are going to change a lot, so that you can add/modify your own indices of preference if not listed by default and in order to make it future proof.
You can play with the settings, can compare to BTC, ETC, SOL, etc. for helping in your studies
You also have the option to check the info of each symbol on a table available on the settings, in order to help you figure out if there are any errors and also help you to easily check how the symbols are performing individually
Notes:
- Many projects are not like MEMECOINS that have fixed supply, normally VC projects have a very variable circulating supply, so you might want to update the info of the circulating supply for your projects to make it more accurate if you desire.
- For this script there is a limit of 32 Symbols, due to tradingview own limits, yet you can always "add" multiple projects per line as long as their circulating supply is the same.
- You might want to edit/sort the tickers of the top3, top5 and top10 if they follow bellow those top ranks, but this is not necessary if you don't care about Top 3-10 specific calculations.
- My default "indices" were made of token selections of mine as of November 2024, those defaults indices/tickers I might or might not update them eventually but you are free to adapt/modify the tickers in the settings as history evolves, and you can leave your own indexes on the comment section of this post for others to use
- As you might not be able to create/store multiple different indexes at the same time, you might want to add this indicator multiple times on your screen and then modify the tickers of each instance of this indicator, by that you can have multiple indexes.

Black RSI (Multi Symbol RSI)📌 GENERAL OVERVIEW
Black RSI (Multi Symbol RSI) is an indicator with multiple-RSI (multi-symbol support), It is a powerful indicator designed for analyzing the relative strength of multiple financial instruments within a single chart. This indicator essentially combines multiple instances of the Relative Strength Index (RSI) for different symbols, allowing traders to compare and contrast market conditions for a broader, simultaneous analysis of various assets. By tracking RSI across multiple assets, traders can identify broader market trends, and sector rotations, or pinpoint relative strengths and weaknesses among different instruments. Please check the below sections for details.
Black RSI (Multi Symbol RSI) Indicator Features Summary:
+ Multiple RSI with multi-symbol ◢
This indicator plots Primary+3 multiple RSI for multiple symbols at once. For instance, it could simultaneously show the RSI of indices (e.g., SPX, NASDAQ) or stocks within a sector, providing insights into how these assets are moving relative to one another.
+ Custom Divergence Module ◢
It allows the user to select the divergence source among the multiple RSI (Primary, 1st, 2nd or 3rd RSI) and displays regular/hidden bullish/bearish divergence for selected RSI only.
+ Custom RSI Moving Average/BBs ◢
It allows the user to select the RSI moving average/BBs source among the multiple RSI (Primary, 1st, 2nd or 3rd RSI) and displays moving average/BBs for selected RSI only.
+ Alert Triggers ◢
The indicator can incorporate alert functions that notify the user when an RSI threshold (e.g., overbought or oversold levels) is crossed for any of the selected symbols.
📌HOW TO USE IT
Confirm Trends Across Symbols: Use the indicator to confirm trends across multiple assets. For example, if most symbols within a sector or index are showing RSI levels above 50, it may indicate a bullish trend in that sector. Conversely, if most RSIs are below 50, it may signal bearish sentiment.
Spot Divergences: Look for RSI divergences across symbols, which can hint at potential reversals. For instance, if most symbols show declining RSI levels while a few have increasing RSI, it could indicate relative strength in those few, making them candidates for closer watch.
Identify Overbought/Oversold Conditions: By observing the RSI levels of multiple symbols, you can identify when certain assets are overbought (typically RSI > 70) or oversold (typically RSI < 30). When multiple assets show similar RSI levels, this can indicate broader market sentiment or sector momentum.
Sector Rotation Analysis: In longer-term trading or portfolio rebalancing, a Multi-RSI Multi-Symbol indicator can help detect sector rotation patterns by showing which sectors are gaining strength (higher RSI) and which are weakening, facilitating informed sectoral shifts.
Use in Conjunction with Other Indicators: The Multi-RSI can serve as a supporting indicator alongside trend indicators like Moving Averages or Bollinger Bands, helping to confirm entry and exit points. For example, if a symbol’s RSI shows an overbought condition and it aligns with a resistance level from a Moving Average, this could strengthen a sell signal.
Customization: Customize the settings to match your trading style. For instance, day traders might prefer a shorter RSI period and timeframes, while swing traders may benefit from longer timeframes and smoother RSI.
⚙️Black RSI (Multi Symbol RSI) SETTINGS
Black RSI (Multi) Dashboard ◢
+ 1st RSI: Enable/Disable 1st RSI
+ 2nd RSI: Enable/Disable 2nd RSI
+ 3rd RSI: Enable/Disable 3rd RSI
RSI Primary Tools ◢
+ RSI Moving Average/Bollinger Bands: Enable/Disable RSI Moving Average/Bollinger Bands
+ Smooth RSI: Enable/Disable Smooth RSI (for Primary RSI)
+ RSI Divergence: Enable/Disable Divergence for user-selected RSI
RSI Secondary Tools ◢
+ RSI OB/OS Color Bars: Enable/Disable RSI OB/OS Color Bars for user-selected RSI
+ RSI OB/OS Highlights: Enable/Disable OB/OS Highlights for user-selected RSI
+ Background: Enable/Disable RSI Background
+ Primary RSI Settings ▾
- Override Primary RSI Symbol: Allows the user to select the symbol for Primary RSI
- Primary RSI Length: User input primary RSI length value
- Primary RSI Source: User primary RSI source selection
- RSI Line Thickness: User input line thickness value for primary RSI
- Primary RSI Colors:
- OB/OS Highlights: Enable/Disable OB/OS Primary RSI Highlights
- RSI Overbought Threshold: The user can set the RSI overbought threshold value. This Overbought Threshold value will also be applied to All RSI (Primary, 1st, 2nd, 3rd) and "RSI Divergence overbought condition" and "RSI OB/OS Highlights"
- RSI Oversold Threshold: The user can set the RSI oversold threshold value. The lower band (oversold line) of RSI. This Oversold Threshold value will also be applied to All RSI (Primary, 1st, 2nd, 3rd) and "RSI Divergence oversold condition" and "RSI OB/OS Highlights"
+ 1st RSI Settings ▾
- Override 1st RSI Symbol: Allows the user to select the symbol for 1st RSI
- 1st RSI Length: User input 1st RSI length value
- 1st RSI Source: User 1st RSI source selection
- RSI Line Thickness: User input line thickness value for 1st RSI
- 1st RSI Colors:
- OB/OS Highlights: Enable/Disable OB/OS 1st RSI Highlights
+ 2nd RSI Settings ▾
- Override 2nd RSI Symbol: Allows the user to select the symbol for 2nd RSI
- 2nd RSI Length: User input 2nd RSI length value
- 2nd RSI Source: User 2nd RSI source selection
- RSI Line Thickness: User input line thickness value for 2nd RSI
- 2nd RSI Colors:
- OB/OS Highlights: Enable/Disable OB/OS 2nd RSI Highlights
+ 3rd RSI Settings ▾
- Override 3rd RSI Symbol: Allows the user to select the symbol for 3rd RSI
- 3rd RSI Length: User input 3rd RSI length value
- 3rd RSI Source: User 3rd RSI source selection
- RSI Line Thickness: User input line thickness value for 3rd RSI
- 3rd RSI Colors:
- OB/OS Highlights: Enable/Disable OB/OS 3rd RSI Highlights
+ RSI Bands & Threshold Settings ▾
- RSI Middle Band: Allows the user to plot optional RSI band on the RSI Oscillator
- RSI Bullish Band: Allows the user to plot optional RSI band on the RSI Oscillator
- RSI Bearish Band: Allows the user to plot optional RSI band on the RSI Oscillator
+ Primary RSI Smooth Settings ▾
- Type: The user selected Smooth MA type for Primary RSI. With RSI Smooth enabled, it will also affect Primary RSI Divergences detection (all divergences will be plotted according to the "Smoothed RSI line")
- Length: User input Smooth MA length value for Primary RSI
+ RSI Moving Average Settings ▾
- MA/BB RSI Source: Allows the user to MA/BB source selection
- MA/BB Enable/Disable: Allows the user to select Moving average only, BBs only or Both to display on the RSI Oscillator
- RSI Moving Average Colors: Allows the user to select Bullish/Bearish colours of RSI Moving Average
- RSI Moving Average Type: Allows the user to select RSI MA Type
- RSI Moving Average Length: User input RSI MA length value
- RSI Moving Average Thickness: User input RSI MA thickness
- Bollinger Bands Colors: Allows the user to select BBs colours
- BB StdDev: user input Bollinger Bands standard deviation value
+ RSI Divergence Settings ▾
- Divergence RSI source: User selection of divergence source .
- Divergence source: User selection of divergence source . "oscillator" (divergence detection with high/low or close of RSI), "price" (divergence detection with high/low or close of price)
- Bull price source: User selection of Bull price source. Bull price source: "Low" (low of price divergence detection), "Close" (close of price divergence detection) (linked to "price" in "Divergence source")
- Bear price source: User selection of Bear price source. Bear price source: "High" (high of price divergence detection), "Close" (close of price divergence detection) (linked to "price" in "Divergence source")
- Low/High left bars: How many candles to compare on the left side of a candle when deciding whether it is a pivot. The lower the number is, the earlier pivots (and therefore divergences) will be signalled, but the quality of those detections could be lower.
- Low/High right bars: How many candles to compare on the right side of a candle when deciding whether it is a pivot. The lower the number is, the earlier pivots (and therefore divergences) will be signalled, but the quality of those detections could be lower.
- Maximum lookback bars: The maximum length of a divergence (number of bars). If a detected divergence is longer than this, it will be discarded.
- Price threshold: User selection of Price threshold, higher values more lines
- RSI threshold: User selection of RSI threshold, higher values more lines
- Show Lows: Displays lows of RSI
- Show Highs: Displays highs of RSI
- Show Divergence as:
- Line Style:
- Line thickness: User input divergence line thickness value
- Label Transparency: it could reduce label mess on the oscillator line, input "100" for label text only without label background
- Labels Text Color: User label text colour selection
Auto Text Color > Auto colour change of label text according to Dark/Light chart theme
- Bull Divergences: Enable/Disable of Bull divergences
> Color: User selection of Bull divergence color
> Potential Bull: It will plot potential regular bull divergence with a dotted line.
- Bear Divergences: Enable/Disable of Bear divergences
> Color: User selection of Bear divergence color
> Potential Bear: It will plot potential regular bear divergence with a dotted line.
- Hidden Bull Div: Enable/Disable of Hidden Bull divergences
> Color: User selection of Hidden Bull divergence colour
> Potential H.Bull: It will plot potential hidden bull divergence with a dotted line.
- Hidden Bear Div: Enable/Disable of Hidden Bear divergences
> Color: User selection of Hidden Bear divergence colour
> Hidden Bear divergence: It will plot potential hidden bear divergence with a dotted line.
> Regular Bull oversold only: It will show Regular Bullish RSI divergences in the oversold zone only, RSI oversold threshold can be configured in the "Primary RSI Settings" section.
> Regular Bear overbought only: It will show Regular Bearish RSI divergences in the overbought zone only, RSI overbought threshold can be configured in the "Primary RSI Settings" section.
+ RSI OB/OS Colored Bars Settings▾
- OB/OS Bar RSI Source: User selection of OB/OS Bars RSI source .
- Overbought Bar Color: User RSI OB Bars colour selection
- Oversold Bar Color: User RSI OS Bars colour selection
+ Overbought/Oversold Highlights ▾
- OB/OS Highlights RSI Source: User selection of OB/OS Highlights RSI source .
- Overbought Highlights : Enable/Disable Overbought Highlights
- Oversold Highlights : Enable/Disable Oversold Highlights
- Transparency: Gradient transparency of highlighted area
+ RSI Line & Label Settings ▾
- Show Symbol label: Enable/Disable each RSI symbol label.
- RSI line offset: Shifts the RSI to the left or the right on the given number of bars, Default is 0
+ Background Setting ▾
- Custom Background Color: User selection of Background color
Feedback & Bug Report
If you find any bugs in this indicator or have any suggestions, please let me know. Please give feedback & appreciate it if you like to see more future updates and indicators. Thank you

Smart Momentum Relative StrengthSmart Momentum Relative Strength
Creator Journey
The Smart Momentum Relative Strength indicator is
created by Vishal R. Janjire , inspired by BharatTrader sir, and parameters guided by mentor stockedge founder Vivek Bajaj sir.
Reason? ...Why choose Smart Momentum Relative Strength.
1.Simple to Trade: This indicator simplifies trading decisions. You just need to follow the background color displayed on the chart. When the background is green, it signals a bullish trend, and when it turns red, it signals a bearish trend. For an even cleaner experience, you can untick the Relative Strength (RS) toggle in the indicator settings and focus purely on trading based on these background colors, making the process straightforward and efficient.
2.Unlock the power to compare any stock, share, commodity, forex or cryptocurrency against major indices like Nasdaq Composite, NYSE Composite, Bitcoin, NG, Gold, Silver, Crude oil, Nasdaq-100, Nifty 50, Hang Seng Index, FTSE 100, and many more! With the Comparative Relative Strength (RS) indicator,
You can easily change the default Nifty 50 comparative symbol to any index or asset of your choice, such as Gold, Silver, Crude Oil, or global benchmarks like the Dow Jones Industrial Average, DAX, Euronext 100, and SSE Composite.
This versatile tool allows traders to measure how well a base symbol (e.g., stock or crypto) performs relative to a chosen benchmark over a specified period. Whether you're analyzing the relative strength of Bitcoin against the Nasdaq-100 or comparing stocks to the S&P 500, this indicator provides valuable insights into market trends and outperforming assets.
The Smart Momentum Relative Strength combines several advanced technical analysis tools into one comprehensive Pine Script indicator designed to provide a nuanced view of market strength and trends. This script integrates Relative Strength (RS), Commodity Channel Index (CCI), and additional trend confirmation mechanisms to deliver actionable insights for traders.
Below are key points to understand before using this indicator:
Important Parameters:
1. Green Line: Represents stocks outperforming the comparative index, which is Nifty 50. However, do not apply this result directly to Nifty 50 itself, as it will not work exclusively on the Nifty 50 index.
2. Red Line: Indicates that the stock is underperforming relative to the Nifty 50 index.
3. Green Background: Signifies that both the current time momentum and higher time momentum are aligned, indicating an upward trend.
4. Red Background: Signifies that both the current time momentum and higher time momentum are aligned, indicating a downward trend.
5. Blank Space: This occurs when the two timeframes are not aligned, indicating market uncertainty and signaling a potential change in market direction, it means short time frame or current time frame changed its direction to opposite side.
Multi-Time Frame (MTF) Settings:
This indicator incorporates a default multi-time frame setup, as follows:
1 and 2 Minute chart = 5 Minute higher time frame
3 Minute chart = 15 Minute higher time frame
5 Minute chart = 15 Minute higher time frame
10 Minute chart = 60 Minute higher time frame
15 Minute chart = 60 Minute higher time frame
20 and 30 Minute chart = 120 Minute higher time frame
1 Hour chart = 4 Hour higher time frame
2 Hour chart = 4 Hour higher time frame
4 Hour chart = 1 Day higher time frame
1 Day chart = 1 Week higher time frame
1 Week chart = 1 Month higher time frame
1 Month chart = 12 Month higher time frame
For any other chart time frame = Day time is default time frame
1. Relative Strength (RS) Analysis:
Calculation: Measures the performance of the base symbol relative to a comparative symbol over a specified period.
Visualization: The RS value is plotted with color-coded lines to indicate bullish (green) or bearish (red) conditions based on crossovers. Users can customize the color based on value or trend direction.
Trend Analysis: A simple moving average (SMA) of RS is displayed to visualize trend strength and direction, with color changes to reflect rising or falling trends.
2. Commodity Channel Index (CCI):
- Current Timeframe CCI: Calculates the CCI for the current timeframe to assess price momentum.
- Higher Timeframe CCI: Computes the CCI for a higher timeframe to provide a broader market perspective.
- Background Color: Highlights the chart background in green or red based on whether both current and higher timeframe CCIs are above or below zero, respectively.
-Blank Space: This occurs when the two timeframes are not aligned, indicating market uncertainty and signaling a potential change in market direction, it means short time frame or current time frame changed its direction to opposite side.

Spaghetti - Custom Cryptocurrency Index IndicatorDescription:
Spaghetti is a highly customizable cryptocurrency index indicator designed to let you track an average price of up to 15 different cryptocurrencies in one convenient line. Whether you're interested in a mix of meme coins, AI projects, or any other specific subset of coins, Spaghetti allows you to create your own personalized index.
Features:
Customizable Coin List: Input up to 15 different cryptocurrencies of your choice, allowing you to tailor the indicator to your preferred assets and strategies.
Dynamic Labeling: Features a label on the chart that displays a user-defined name, so you can personalize the indicator's label to match your theme or trading strategy.
Color Customization: The line color is fully customizable, enabling better visual integration with your charts.
Average Calculation: Calculates and plots the average price of all selected coins, providing an easy way to visualize overall market movement for your customized selection.
How to Use Spaghetti:
In the indicator settings, enter the tickers for up to 15 coins you want to include (e.g., BINANCE:BTCUSDT).
Customize the line color and the label text to match your style or preferences.
The indicator will plot the average price of all selected coins, with a dynamic label that follows the price for easy reference.
Spaghetti makes it easy to create and track custom crypto indices, providing a broader perspective of your selected market segments. Perfect for traders who want to stay on top of multiple assets without the clutter!
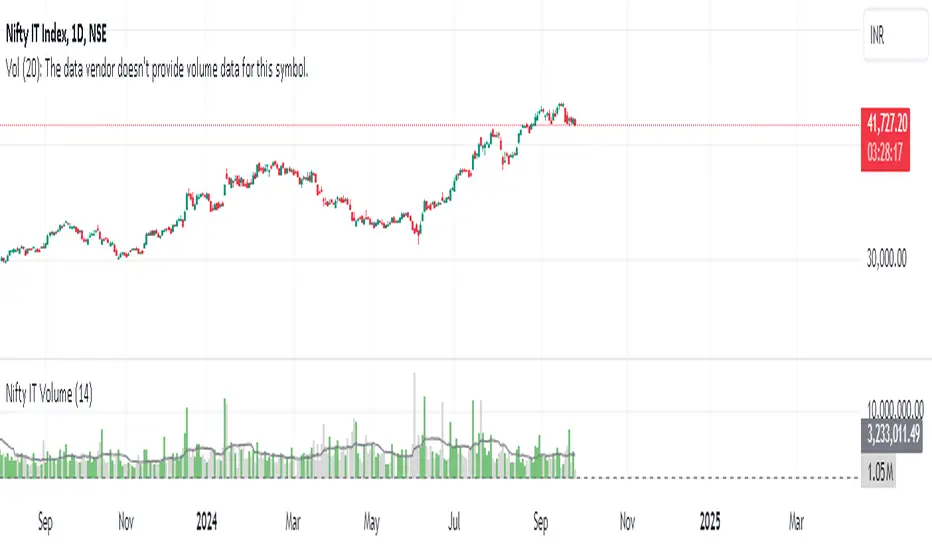
Nifty IT VolumeHello everyone,
Here I present Nifty IT index volumes calculated based on weighted volumes of all constituents.
A simple formula for calculation:
constituent1.volume*weightage + constituent2.volume*weightage + ....
You can change color and code if there is a change in constituents of the index from NSE. I will share other index volumes soon.
Enjoy!
US Sentiment Index [CryptoSea]The US Sentiment Index is an advanced analytical tool designed for traders seeking to uncover patterns, correlations, and potential leading signals across key market tickers. This indicator surpasses traditional sentiment measures, providing a data-driven approach that offers deeper insights compared to conventional indices like the Fear and Greed Index.
Key Features
Multi-Ticker Analysis: Integrates data from a diverse set of market indicators, including gold, S&P 500, U.S. Dollar Index, Volatility Index, and more, to create a comprehensive view of market sentiment.
Customisable Sensitivity Settings: Allows users to adjust the moving average period to fine-tune the sensitivity of sentiment calculations, adapting the tool to various market conditions and trading strategies.
Detailed Sentiment Scaling: Utilises a 0-100 scale to quantify sentiment strength, with colour gradients that visually represent bearish, neutral, and bullish conditions, aiding in quick decision-making.
Below is an example where the sentiment index can give leading signals. We see a first sign of wekaness in the index as it drops below its moving average. Shortly after we see it dip below our median 50 level, another sign of weakeness. We see the SPX price action to take a hit following the sentiment index decrease.
Tickers Used and Their Impact on Sentiment
The impact of each ticker on sentiment can be bullish or bearish, depending on their behaviour:
Gold (USGD): Typically seen as a safe-haven asset, rising gold prices often indicate increased market fear or bearish sentiment. Conversely, falling gold prices can signal reduced fear and a shift towards bullish sentiment in riskier assets.
S&P 500 (SPX): A rising S&P 500 is usually a sign of bullish sentiment, reflecting confidence in economic growth and market stability. A decline, however, suggests bearish sentiment and a potential move towards risk aversion.
U.S. Dollar Index (DXY): A strengthening U.S. Dollar can be a sign of fear as investors seek safety in the dollar, which is bearish for risk assets. A weakening dollar, on the other hand, can signal bullish sentiment as capital flows into riskier assets.
Volatility Index (VIX): Known as the "fear gauge," a rising VIX indicates increased market fear and bearish sentiment. A falling VIX suggests a calm, bullish market environment.
Junk Bonds (JNK): Rising junk bond prices often reflect bullish sentiment as investors take on more risk for higher returns. Conversely, falling junk bond prices signal increased fear and bearish sentiment.
Long-Term Treasury Bonds (TLT): Higher prices for long-term treasuries usually indicate a flight to safety, reflecting bearish sentiment. Lower prices suggest a shift towards riskier assets, indicating bullish sentiment.
Financial Sector ETF (XLF): Strength in the financial sector is typically bullish, indicating confidence in economic conditions. Weakness in this sector can reflect bearish sentiment and concerns about financial stability.
Unemployment Rate (USUR): A rising unemployment rate is a bearish signal, indicating economic weakness. A declining unemployment rate is bullish, reflecting economic strength and job growth.
U.S. Interest Rates (USINTR, USIRYY): Higher interest rates can be bearish, as they increase borrowing costs and reduce spending. Lower rates are generally bullish, promoting economic growth and risk-taking.
How it Works
Sentiment Calculation: The US Sentiment Index combines data from multiple tickers, calculating sentiment by scaling the distance from their respective moving averages. Each asset's behaviour is interpreted within the context of market fear or greed, providing a refined sentiment reading that adjusts dynamically.
Market Strength Analysis: When the index is above 50 and also above its moving average, it indicates particularly strong or bullish market conditions, driven by greed. Conversely, when the index is below 50 and under its moving average, it signals bearish or weak market conditions, associated with fear.
Correlation and Pattern Detection: The indicator analyses correlations among the included assets to detect patterns that might signal potential market movements, giving traders a leading edge over simpler sentiment measures.
Adaptive Background Colouring: Utilises a colour gradient that dynamically adjusts based on sentiment values, highlighting extreme fear, neutral, and extreme greed levels directly on the chart.
Flexible Display Options: Offers settings to toggle the moving average plot and adjust its period, giving users the ability to tailor the indicator's sensitivity and display to their specific needs.
In this example below, we can see the Sentiment rise above the Moving Average (MA). Price action goes on to follow this, although there is an instance where it dips below the MA, it quickly rises back above again as a sign of strength.
Another way you can use this index is by simply using the MA, if its trending up, we know the macro sentiment is bullish.
Application
Data-Driven Insights: Offers traders a detailed, data-driven approach to sentiment analysis, incorporating a broad spectrum of market indicators to deliver actionable insights.
Pattern Recognition: Helps identify patterns and correlations that may lead to market reversals or continuations, providing a nuanced view that goes beyond simple sentiment gauges.
Enhanced Decision-Making: Equips traders with a robust tool to validate trading strategies and make informed decisions based on comprehensive sentiment analysis.
The US Sentiment Index by is an essential addition to the toolkit of any trader looking to navigate market complexities with precision and confidence. Its advanced features and data-driven approach offer unparalleled insights into market sentiment, setting it apart from conventional sentiment indicators.

Stock Strength IndexScript Title: Stock Strength Index made by Vishal R Janjire
Description:
The Stock Strength Index combines several advanced technical analysis tools into one comprehensive Pine Script indicator designed to provide a nuanced view of market strength and trends. This script integrates Relative Strength (RS), Commodity Channel Index (CCI), and additional trend confirmation mechanisms to deliver actionable insights for traders.
( Must Read )
Important parameter read before use this indicator
0. Zero line green means stock is in up trend and if it is red means down trending.
1. Zero line is green it means stocks is outperforming its index that is Nifty 50 ( but dont consider its results on nifty itself that is it will not work only on nifty 50)
2. Zero line is red it means stocks is underperforming its index that is Nifty 50
3. bubble is confirmation tool when it show green bubble on zero line it means on short time frame it want go up trending and vise versa
4. Always remember higher time frame is greater than chart time frame like day vs hour
Key Features:
5. Best suitable time when higher time frame is 15 minutes and chart time is 5 minute for intraday trading. for short swing use HTF 1 Day and chart time is 1 hour or 2 hour.
1. Relative Strength (RS) Analysis:
- Calculation: Measures the performance of the base symbol relative to a comparative symbol over a specified period.
- Visualization: Plots the RS value with color-coded lines to indicate bullish (green) or bearish (red) conditions based on crossovers. Users can toggle the RS color based on its value or trend direction.
- Trend Analysis: Displays a simple moving average (SMA) of RS to visualize trend strength and direction. The SMA’s color changes to indicate rising or falling trends.
2. Commodity Channel Index (CCI):
- Current Timeframe CCI: Calculates the CCI for the current timeframe to assess price momentum.
- Higher Timeframe CCI: Computes the CCI for a higher timeframe to provide a broader market perspective.
- Background Color: Highlights the chart background in green or red based on whether both current and higher timeframe CCIs are above or below zero, respectively.
3. Alerts:
- CCI Alerts: Set up alerts for key CCI crossovers, including when both CCIs are above or below zero, or when CCI crosses key levels (100 and -100) on either timeframe.
4. Trend Confirmation:
- Price Confirmation: Uses price and its moving average to identify bullish or bearish divergence, with visual bubbles plotted on the chart to confirm potential trade signals.
5. Customization Options:
- RS Parameters: Adjust settings for RS period, comparative symbol, and whether to display reference labels or the zero line.
- CCI Parameters: Configure CCI lengths for both current and higher timeframes and select the source of the CCI calculation.
Concepts Underlying Calculations:
- Relative Strength (RS): Measures the relative performance of the base symbol compared to another symbol, adjusted over a specified period to capture momentum and trend strength.
- Commodity Channel Index (CCI): Calculates the deviation of the price from its average to identify overbought or oversold conditions and potential reversal points.
- Simple Moving Average (SMA): Smooths the RS values to highlight trends and potential trend reversals.
This indicator is designed for traders seeking a comprehensive tool that combines multiple analytical methods into one cohesive system. It aims to offer a clearer view of market trends, strengths, and potential trade opportunities based on a blend of relative strength and momentum indicators.
---
This description provides a detailed overview of the script's functionality and customization options while ensuring clarity and compliance with the publishing rules.

Oster's Fair Economy (OFE)Overview:
Oster's Fair Economy (OFE) is a powerful tool designed to give traders and investors a comprehensive assessment of the fair value of major stock indices . Unlike conventional indicators that focus solely on technical analysis, OFE emphasizes economic metrics to offer a deeper understanding of the market's intrinsic value. By applying Oster's method (explained below), OFE determines the fundamental fair price of key indices, making it an invaluable tool for top-down analysis and market confirmation. It is particularly useful for swing trading on indices and as a top-down confirmation for individual stock trades.
Important Note:
OFE is designed for use with indices, not individual stocks : Stocks are often driven by their own fundamental factors, such as earnings, revenue, and dividend yields, which may not align with broad economic metrics. While OFE can sometimes provide insights into individual stocks, particularly those highly correlated with broader market trends, it is specifically intended for index analysis.
OFE is optimized for Weekly Candles (W ): OFE is most effective when used with weekly data, as it aligns with the longer-term outlook of economic analyses. While it can be used with smaller timeframes, weekly data is recommended for the most accurate insights.
Innovative Approach to Economic Analysis:
OFE integrates a unique combination of key economic metrics , including:
Gross National Product (GNP)
Consumer Price Index (CPI)
Unemployment Rate (UR)
Interest Rate (e.g., FED)
Nonfarm Payrolls (NFP)
Retail Sales (RS)
Industrial Production (IP)
Balance Of Trade (BOT)
Money Supply M2 (M2)
Consumer Confidence Index (CCI)
These metrics are tailored for 20 different markets : United States (US), Canada (CA), European Union (EU), Germany (DE), United Kingdom (GB), France (FR), Italy (IT), Switzerland (CH), Spain (ES), Australia (AU), New Zealand (NZ), Japan (JP), China (CN), Hong Kong (HK), South Korea (KR), India (IN), Russia (RU), Brazil (BR), Mexico (MX), and Saudi Arabia (SA).
This comprehensive set of data allows traders to gauge the potential for growth, inflation, and overall market conditions . OFE's weighting system reflects the importance of these metrics in determining the fair value of indices according to Oster's methodology .
How OFE Works:
OFE's calculation methodology is designed to provide insights into whether an index is fundamentally overvalued, undervalued, or trading at fair value by comparing its price dynamics with economic data. Here’s a step-by-step breakdown of how OFE works:
Economic Data Collection : OFE retrieves relevant economic data from the selected region, such as GDP, CPI, and interest rates. If specific market data is unavailable, OFE defaults to the US market as a fallback.
Normalization and Weighting : The collected economic metrics are normalized against historical trends to ensure that the data reflects both current levels and long-term averages. For example, GDP growth rates are normalized based on historical data, allowing for a comparison across different economic periods. Similarly, CPI and unemployment rates are adjusted to account for historical context, ensuring that high inflation or unemployment is appropriately weighed relative to past conditions. However, all other macroeconomic key figures are also processed in the same way.
Relating Economic Metrics to Price Dynamics : OFE calculates specific ratios by comparing the selected index’s price with the normalized economic data. These ratios, such as the GNP ratio, are then analyzed within the context of historical performance. The goal is to establish a relationship between the economic indicators and the index’s historical price behavior. For instance, if the GNP ratio is currently higher than historical norms, it could suggest that the index is overvalued relative to the economy’s actual productivity.
Fair Value Calculation : Based on the derived ratios and their historical correlations with index prices, OFE computes a fair value for the index. This calculation integrates multiple economic indicators, each weighted according to its perceived importance in influencing the index. For example, in a high-growth environment, GDP and industrial production might carry more weight, whereas in a recession, unemployment and interest rates could become more influential. The resulting fair value reflects the index's price adjusted for the current economic environment.
Price Comparison : The calculated fair value is then compared to the current market price of the index. If the market price significantly deviates from the fair value, it suggests that the index is either overvalued or undervalued. For example, if the fair value of the S&P 500 is calculated to be 10% lower than its current market price, OFE would indicate that the index might be overvalued, potentially signaling a market correction. The fair price line basically acts as a kind of magnet that keeps attracting the index price. This is because, in the longer term, the broad market is always guided by the economic health of the country in concerned.
Market Dynamics Consideration : By adjusting the "Strictness" level in OFE, users can control how sensitive the fair value calculation is to economic fundamentals. A higher strictness level would highlight discrepancies between the fair value and the market price more aggressively, suggesting a higher likelihood of market mispricing. Conversely, a lower strictness level allows for greater flexibility, acknowledging that markets can sometimes deviate from fundamental values without immediate correction.
Customizable Parameters for Tailored Analysis:
OFE offers extensive customization options to align with your specific investment strategy. Users can:
Select or deselect economic metrics for inclusion.
Adjust the weighting of each metric to reflect its importance in their analysis.
Fine-tune the strictness of the valuation process (as explained above).
Additionally, users can compare different indices with various macroeconomic data sets . For example, you might select the DAX index and apply US economic data to see how the index would perform if driven by US market fundamentals. This feature enables a highly tailored and region-specific analysis, empowering traders to align OFE with their individual perspectives and market outlooks.
Interpretation:
If the calculated fair price is above the current index value, the index is considered fundamentally undervalued, indicating potential for price increases. Conversely, if the fair price is below the current index value, the index is seen as overvalued, suggesting potential risks or a possible correction. The fair price acts as a gravitational force, pulling the index toward its true economic value over time.
This over- or undervaluation can also serve as an overarching economic confirmation for stock trading . For example, it might be advantageous to buy individual stocks when the broader market is fundamentally undervalued, as the general upward potential of the market could support stock price increases. Conversely, selling or avoiding stocks when the broader market is overvalued could help mitigate potential risks, as the market may be primed for a correction.
Conclusion:
Oster's Fair Economy (OFE) bridges the gap between technical simplicity and the depth of macroeconomic analysis . By integrating complex economic metrics with user-friendly customization, OFE empowers traders and investors to assess the fair valuation of indices confidently . This tool is ideal for confirming market trends and gaining a broader understanding of the economic landscape, making it a valuable asset in any investment toolkit.

Portfolio Index Generator [By MUQWISHI]▋ INTRODUCTION:
The “Portfolio Index Generator” simplifies the process of building a custom portfolio management index, allowing investors to input a list of preferred holdings from global securities and customize the initial investment weight of each security. Furthermore, it includes an option for rebalancing by adjusting the weights of assets to maintain a desired level of asset allocation. The tool serves as a comprehensive approach for tracking portfolio performance, conducting research, and analyzing specific aspects of portfolio investment. The output includes an index value, a table of holdings, and chart plotting, providing a deeper understanding of the portfolio's historical movement.
_______________________
▋ OVERVIEW:
The image can be taken as an example of building a custom portfolio index. I created this index and named it “My Portfolio Performance”, which comprises several global companies and crypto assets.
_______________________
▋ OUTPUTS:
The output can be divided into 4 sections:
1. Portfolio Index Title (Name & Value).
2. Portfolio Specifications.
3. Portfolio Holdings.
4. Portfolio Index Chart.
1. Portfolio Index Title, displays the index name at the top, and at the bottom, it shows the index value, along with the chart timeframe, e.g., daily change in points and percentage.
2. Portfolio Specifications, displays the essential information on portfolio performance, including the investment date range, initial capital, returns, assets, and equity.
3. Portfolio Holdings, a list of the holding securities inside a table that contains the ticker, average entry price, last price, return percentage of the portfolio's initial capital, and customized weighted percentage of the portfolio. Additionally, a tooltip appears when the user passes the cursor over a ticker's cell, showing brief information about the company, such as the company's name, exchange market, country, sector, and industry.
4. Index Chart, display a plot of the historical movement of the index in the form of a bar, candle, or line chart.
_______________________
▋ INDICATOR SETTINGS:
Section(1): Style Settings
(1) Naming the index.
(2) Table location on the chart and cell size.
(3) Sorting Holdings Table. By securities’ {Return(%) Portfolio, Weight(%) Portfolio, or Ticker Alphabetical} order.
(4) Choose the type of index: {Equity or Return (%)}, and the plot type for the index: {Candle, Bar, or Line}.
(5) Positive/Negative colors.
(6) Table Colors (Title, Cell, and Text).
(7) To show/hide any indicator’s components.
Section(2): Performance Settings
(1) Calculation window period: from DateTime to DateTime.
(2) Initial Capital and specifying currency.
(3) Option to enable portfolio rebalancing in {Monthly, Quarterly, or Yearly} intervals.
Section(3): Portfolio Holdings
(1) Enable and count security in the investment portfolio.
(2) Initial weight of security. For example, if the initial capital is $100,000 and the weight of XYZ stock is 4%, the initial value of the shares would be $4,000.
(3) Select and add up to 30 symbols that interested in.
Please let me know if you have any questions.
