Gamification IndicatorDo you want your charts to look like a video game? Look no further! Would you rather be an alien racing through a lava tube, a surfer with great white sharks, an airplane flying through the clouds, or some other custom emoji setup of your choice? Traders can choose their own custom player emoji, trend indicator, obstacle emoji, and celestial emoji. This indicator is just for fun and is not intended to be used when making trading decisions. Enjoy!
This indicator also contains a live sun/moon emoji that should accurately reflect day/night and can give information about the current moon phases.
Shoutout to @citlacom for the public Moon Ephemeris and calculations. Building this indicator was a useful & fun introduction to financial astrology in Pinescript.
Ichimoku Cloud

Volume Spread Analysis IchimokuThis version of the popular Ichimoku indicator is modified to let the user choose between his classic mode and the volume-weighted mode.
Every line of the indicator is customizable with this function.
The Kijun and Tenkan lines are choosable from:
1. The normal version, so the average of the high and the low of the selected period
2. The volume mode, so the average price of the selected input ponderated to the volume
The Senkau Span A is the average from the Kijun (fast line) and the Tenkan (slow line) lines and it's choosable from:
1. The normal price version
2. The volume mode
3. The average between points 1 and 2
4. The automatic average between the two fast lines that you've chosen
The Senkau Span B is the slowest line of the indicator, used to determine the long-term trend, and can be chosen from:
1. The normal average price between the high and the low of the selected period
2. The volume average price, using the Volume Weighted Moving Average
The Trama Backline is the popular "LUX Algo" T.R.A.M.A. indicator, which I'm thankful for, and can be fantastically used to display the current trend strength and condition. This line is readable in the following way:
- If the line is moving sideways, the trend may be in a consolidation phase
- If the line is moving upwards or downwards, the trend may be in a trend phase

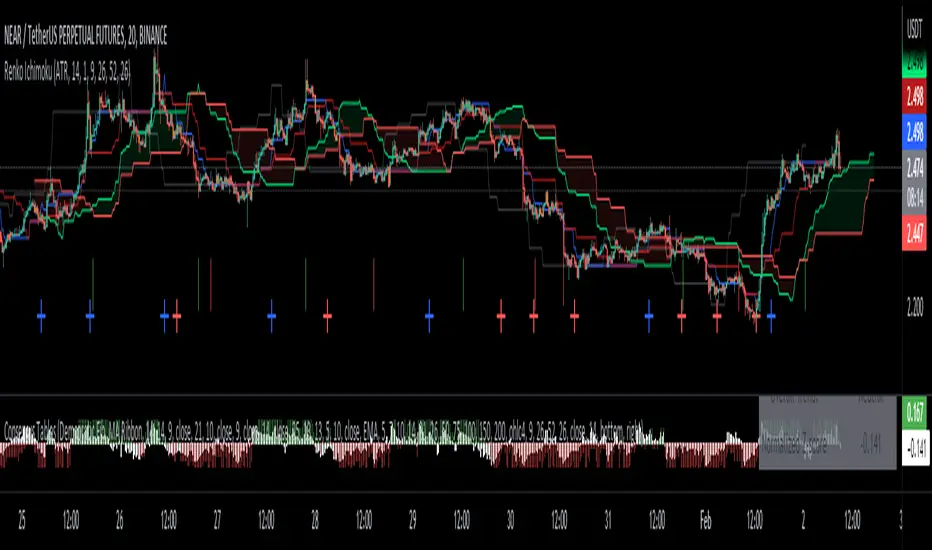
Renko Ichimoku CloudThis script utilizes its source from a non-repainting renko closing price. Renko charts focus solely on price movement and minimize the impacts of time and the extra noise time creates. Employing the renko close helps smooth out the Ichimoku Cloud. Insignificant price movements will not cause a change in the plotted lines of the indicator unless a new threshold is breached or a "brick" is created.
This Ichmoku Cloud includes all standard lines with standard lengths. These include:
Tenken Sen
Kiju Sen
Senkou A/B
Chikou Span
We have also included plotted marks for when there is a Tenken Sen/ Kiju Sen cross and for the Kumo cloud twist.
There are two methods for selecting the box size. Box size is critical for the overall function and efficacy of the plots you will visually see with this indicator. Box size is set automatically using the Average True Range "ATR" or manually using the "Traditional" setting. The simplest way to determine a manual box six is to take the ATR of the given instrument and round it to the nearest decimal place. As an example, if the ATR for the asset is 0.017, you would round that number to 0.02 and utilize this as your traditional box size.
Ichimoku Cloud ExIchimoko Clouds with vertical lines at the Conversion Period (default: 9), Base Period (default: 26) and Lagging Span B period (default: 52) as visual clues to the offsets.

Consensus Tables - Oscillators, Multi-MA , DFMA, and IchimokuThis indicator is a series of underlaid tables that determine a consensus value using a simple positive or negative score for a set signal. This consensus value is also shown as a histogram and reflected on the chart's bar colors. There are a total of four different table options to choose from: a set of trend and volume oscillators, a set of 11 moving averages, a set of Fibonacci moving averages and their own consensus line, and a set of Ichimoku-based conditions. The type of table can be chosen from a drop-down menu at the top of the user settings, with settings for each of the table types grouped up respectively.
Oscillator Table:
The Oscillator table consists of the Average Directional Index (ADX) set as a value instead of +/- and is not used in the scoring to gather consensus. Rather, a value of 25 or above is used to confirm the trend regardless of positive or negative. The Chande Momentum Oscillator (CMO), Detrended Price Oscillator (DPO), Momentum, Rate of Change (ROC), Relative Strength Index (RSI), True Strength Index (TSI), and Volume Oscillator are used in the Oscillator table for a consensus value and given a + or - depending on the condition being met. The conditions and weighting are as follows:
-- CMO > or < 0, given a weight of +/- 2
-- DPO > or < 0, given a weight of +/- 2
-- Momentum > or < 0, given a weight of +/- 2
-- ROC > or < 0, given a weight of +/- 2
-- RSI > or < 50, given a weight of +/- 1
-- TSI Value Line > or < 0, given a weight of +/- 1
-- TSI Signal Line > or < 0, given a weight of +/- 1
-- Volume Osc. > or < 0, given a weight of +/- 2
The consensus value is determined by adding these values together and dividing by 13.
Multi-MA Table:
For the Moving Average Ribbon/Multi-MA table the user is able to determine the source, type, and lengths of 11 moving averages. The type selection consists of EMA, DEMA, TEMA, SMA, RMA, VWMA, WMA, SMMA, and a Hull MA. The preset values for the 11 moving averages are 5, 7, 10, 14, 21, 26, 50, 75, 100, 150, and 200. The consensus conditions and weighting are as follows:
-- If MA(1 through 10) < or > the price source, given a weight of +/- 1
-- If MA(11) < or > the price source, given a weight of +/- 2
The consensus value is determined by adding these values together and dividing by 12.
DFMA Table:
The Democratic Fibonacci Moving Average table is derived from our indicator of the same name. The source for the DFMA can be chosen by the user, but the SMA lengths are predetermined in Fibonacci intervals from 3 to 233. The DFMA line itself is determined by finding the average value of these 10 Fibonacci MA lengths. The consensus conditions and weighting are as follows:
-- If Fib. MA (3-233) < or > the source, given a weight of +/- 1
-- If DFMA value < or > the source, given a weight of +/- 2
The consensus value is determined by adding these values together and dividing by 12.
Ichimoku Table:
The Ichimoku table values a handful of conditions using the Tenkan-sen/Conversion Line, Kijun-sen/Base Line, Senkou-span A and B, and the Chikou-span, each of which are given their standard values of 9, 26, 52, and 26, respectively, but can be changed in the user settings if desired. As opposed to the other tables, there are fewer conditions to be met and given values to. All of the conditions are given the same weighting (+/- 1). The conditions are as follows:
-- Kijun-sen < or > the source
-- Tenkan-sen < or > the source
-- Kijun-sen > or < the Chikou-span
-- Tenkan-sen > or < the Kijou-sen
-- Senkou Span A > or < Senkou Span B
The consensus value is determined by dividing the total value by 5.
Overall consensus and overall trend values are given alongside each of these options. The overall consensus value is determined by taking the average of the 4 respective consensus values. Trend values are determined as such:
-- If consensus value >= 0.75, considered a "Strong Buy"
-- If consensus value is between 0.25 and 0.75, considered a "Buy"
-- If consensus value is between 0.25 and -0.25, considered "Neutral"
-- If consensus value is between -0.25 and -0.75, considered a "Sell"
-- If consensus value is <= -0.75, considered a "Strong Sell"
Table colors are set as either green, red, or gray to reflect positive, negative, and neutral sentiment sentiment. Bar colors reflect the consensus value and the determined table trend:
-- If trend for the chosen table is "Strong Buy", bar color is green
-- If trend for the chosen table is "Buy", bar color is lime
-- If trend for the chosen table is "Neutral", bar color is gray
-- If trend for the chosen table is "Sell", bar color is orange
-- If trend for the chosen table is "Strong Sell", bar color is red

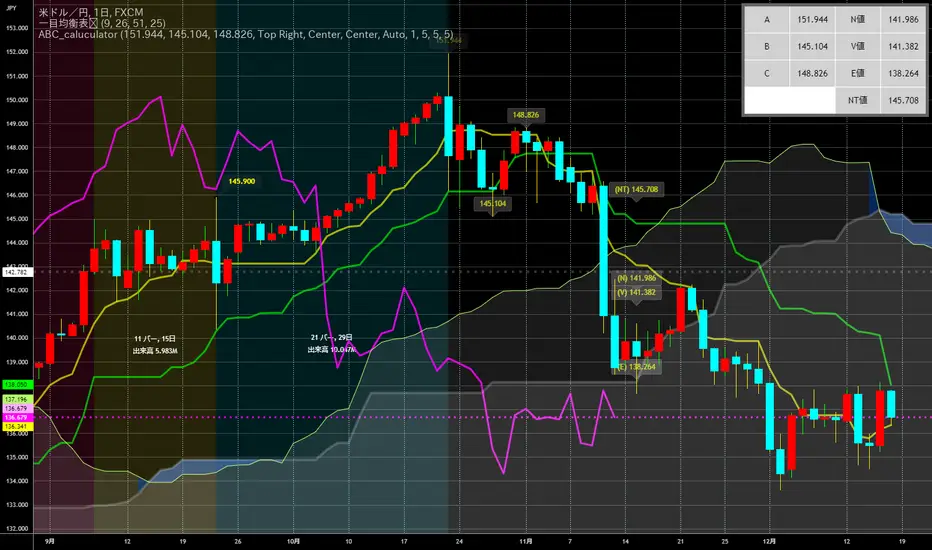
ABC_caluculator for Ichimoku Kinko Hyo(IKH) usersThis tool is using for calculating Target Value(N,V,E prices) by only clicking on a chart.
There is several points which makes it better.
Decrease the number of times of clicking.
Calculator needs a reset button, it's like loop structure. Push the reset and function again.
Plot percentages which it compare closing price and Target Value(N,V,E prices) on a chart.
Plot loss cut points from evaluating risk/returns.
My question is also written down precisely here !!!!!
↓
stackoverflow.com
CVD Ichimoku(s)ENGLISH
What is this indicator?
This is a combination of two indicators: the CVD - Cumulative Volume Delta Candles published by TradingView (version v3 2022.07.11) with two Ichimoku clouds: one for the current time frame and another for a bigger time frame.
The user of the indicator can define that bigger time frame with a multiplier. By default it multiplies x6 the current TF (for example, if you watch at the 1 hour time frame the second kumo belongs to 6 hour TF).
Additionaly, an orange line replicates the senko span A without displacement. It is extra layer of visual information that can be hidded from settings.
How it should be used?
Delta Volume indicators can be hard to read. This format gives the trader an overview of where the agressive buyers/sellers are in relation to past market orders. And relative to price if used in combination with the classic Ichimoku indicator on price. I recommend to use it as a support for your ideas applying Ichimoku's calculations deep knowledge.
CATALÀ*
Què és aquest indicador?
És una combinació de dos indicadors: el CVD - Cumulative Volume Delta Candles publicat per TradingView (versió v3 2022.07.11) amb dos Ichimoku clouds: on pel time frame actual i un altre per un time frame superior.
L'usuari de l'indicador pot definir aquest time frame superior mitjançant un multiplicador. Per defecte multiplica x6 el TF actual (per exemple, si uses l'indicador al time frame d'1 hora, el segon kumo correspondrà al TF de 6 hores).
Adicionalment hi ha una línia taronja que replica el senko span A sense desplaçament. És una capa extra d'informació visual que pot ser amagada des de la configuració.
Com s'ha de fer servir?
Els indicadors de Delta Volume poden ser difícils de llegir. Aquest format dona al tradejador una visió global d'on són els compradors/venedors agressius en relació al mercat d'ordres passat. I relatiu al preu en combinació amb el clàssic indicdor Ichimoku sobre preu. Recomano usar-lo com a suport per les teves idees aplicant un profund coneixement dels càlculs d'Ichimoku.
*Catalan is a language speaked since 8th century in most eastern territories of the current Spain (Catalunya, Illes Balears, País Valencià), south of France and some zones of Italy. Catalan is spoken by some 9,000,000 people in Spain and some 125,000 in France, as well as by some 30,000 in Andorra and some 40,000 in Alghero.

Ichimoku(s)ENGLISH
What is this indicator?
This is a doble Ichimoku cloud: one for the current time frame and another for a bigger time frame.
The user of the indicator can define that bigger time frame with a multiplier. By default it multiplies x6 the current TF (for example, if you watch at the 1 hour time frame the second kumo belongs to 6 hour TF).
Additionaly, an orange line replicates the senko span A without displacement. It is extra layer of visual information that can be hidded from settings.
Other ichimoku lines are hidden by default, but can be activated from "Style" tab at the settings.
How it should be used?
If gives Ichimoku traders perspective from bigger time frames. Can be used to avoid movements against major tendencies without the need to change charts.
CATALÀ*
Què és aquest indicador?
És un doble núvol d'Ichimoku: un pel time frame actual i un altre per un time frame superior.
L'usuari de l'indicador pot definir aquest time frame superior mitjançant un multiplicador. Per defecte multiplica x6 el TF actual (per exemple, si uses l'indicador al time frame d'1 hora, el segon kumo correspondrà al TF de 6 hores).
Adicionalment hi ha una línia taronja que replica el senko span A sense desplaçament. És una capa extra d'informació visual que pot ser amagada des de la configuració.
La resta de línies d'Ichimoku estan ocultes per defecte, però poden activar-se des de la pestanya "Style" de la configuració.
Com s'ha de fer servir?
Dóna als tradejadors d'Ichimoku perspective dels time frames superiors. Pot ser usat per evitar moviments contra tendències majors sense necessitat de canviar de gràfic.
*Catalan is a language speaked since 8th century in most eastern territories of the current Spain (Catalunya, Illes Balears, País Valencià), south of França and some zones of Italy. Catalan is spoken by some 9,000,000 people in Spain and some 125,000 in France, as well as by some 30,000 in Andorra and some 40,000 in Alghero.
Ichimoku RONIN [Lite]This Ichimoku is a Lite Edition of Ichimoku RONIN
Features :
- Ichimoku Default Lines
- Settings for Shift all of Lines
- Two Custom Periods Lines
- 9/26/52 Cycle Counter
- Optimized for Pine Script 5
- No Shifted Senko Span A Line
- New Cloud Alert
- KijunSen & TenkanSen Lines Crossed Alert
Good Trading to All ...

Ichimoku MA Up & DownIchimoku and MA use the default.
It is repainted because it uses a moving average line.
A marker is only true if it was created after the candle closed.
The principle is too simple.
Please enjoy using it.
- Up : Conversion Line > MA #1 and Base Line > MA #2
It is an uptrend. The short-term moving average should be above the conversion line. And the long-term should be above the Base Line.
- Down : Conversion Line < MA #1 and Base Line < MA #2
It's a downtrend. The short-term moving average should be below the conversion line. And the long-term should be below the Base Line.
You can get better results if you use a momentum indicator like RSI.
Thank you.

Ichimoku Cloud+quality lineIchimoku Cloud+quality line
this is ichimoku indicator, only quality line added.
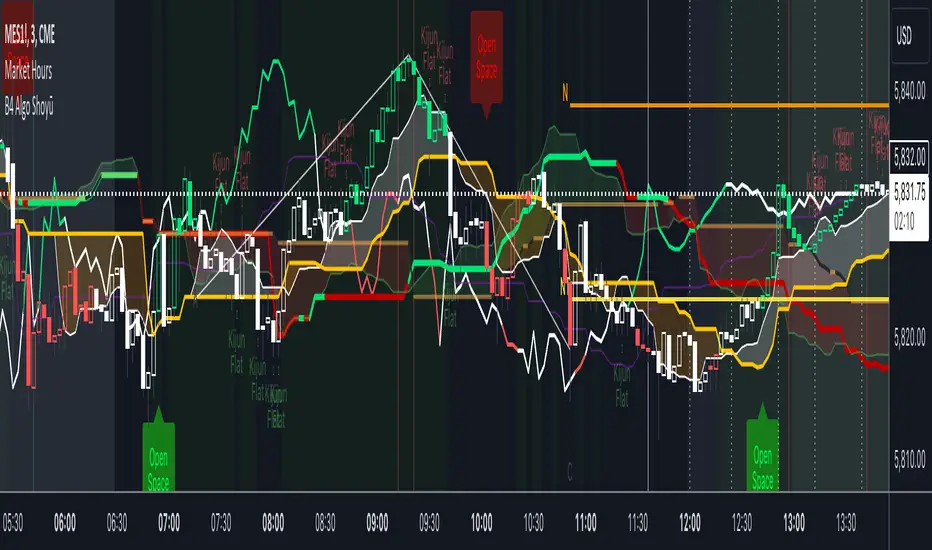
B4Signals Ichimoku Premium Addon ShoyūThis indicator is based on "Ichimoku" with additional and useful features. It is designed to complement B4Signals Ichimoku as an add-on.
FEATURES
The indicator is mainly divided into 5 parts:
* Future Tenkan-sen, Kijun-sen & Kumo Lines: Tenkan-sen next 5 days projection, Kijun-sen next 10 days, Senko Span A next 5 days and Senko Span B next 14 days will be displayed to increase depth of your analysis and help forecast price movements.
* QualityLine + DirectionLine for determining beginning and end of trend as well as a visual to spot Kijun bounces and crosses.
* 9 /26 Tenke-sen/Kijun-sen pullback detection lines, “KISS Lines”, for better entries on pullbacks.
* Flat Kijun-sen signal to determine trend exhaustion and possible reversals.
* Open Space Chikou coloring and confirmation signal for Identifying momentum breakouts and spotting areas of projected consolidation.
* Ichimoku Hosoda Target Price Targets. Simply choose point A,B and C and have 4 Hosoda price targets appear on your chart.
The addition of these features provides traders with a collection of technical metrics capable of outlining directional trend momentum, proposed pullbacks and possible continuations in any financial market. Using multiple plots, this indicator plots a forecast where the Han-ne lines might travel in the future. The Direction line gives you a clear perspective of price in relation to the Kijun. While the Quality Line gauges the health or quality of the Kumo, helping determine entries and exits, while confirming pullbacks and areas of consolidation. The “KISS Lines” help identify Tenken-sen / Kijun-sen 9/26 pullbacks and the Kijun Flat alert signals you when trend exhaustion is identified by a flat Kijun-sen.
Another significant aspect of this indicator is that it identifies the Chikou Span reaching ‘Open Space' by coloring the Chikou Span's line giving you a signal as well. This can help traders identify the market’s dominant trend (bullish or bearish) and determine an appropriate time to enter/exit active positions.
Disclaimer
Copyright by B4Signals.
The information contained in our scripts/indicators/ideas does not constitute financial advice or a solicitation to buy or sell any securities of any type. We will not accept liability for any loss or damage, including without limitation any loss of profit, which may arise directly or indirectly from the use of or reliance on such information.
All investments involve risk, and the past performance of a security, industry, sector, market, financial product, trading strategy, or individual’s trading does not guarantee future results or returns. Investors are fully responsible for any investment decisions they make. Such decisions should be based solely on an evaluation of their financial circumstances, investment objectives, risk tolerance, and liquidity needs.
CoG RSI Momenum Ichimoku CloudThis indicator is inspired by "RSI ICHIMOKU CLOUD".
Script plots price bars based on selected indicator with Ichimoku Cloud around it.
In my version I have added different oscillators for bar calculations.
Specifically you can choose from:
Center of Gravity(CoG)
Momentum
RSI

Ichimoku Cloud Anidjarcan be used in any timeframe
price crossing the cloud, buy or sell
blue line crossing red, attention to buy and sell
lagging line, inside prices, doing nothing, indicates trading, market consolidating.

Ichimoku ATR Oscillator// An oscillator that visualizes Ichimoku trend line distances in terms of ATR.
// Public Domain
// By JollyWizard

Ichimoku (lib-hlm)An example of how to implement Ichimoku in other scripts using my `lib-hlm`.
You can copy and paste this code into any `\\@version=5` indicator to add Ichimoku to it.

Regression Channel Trend DetectionThis is a regression channel that uses ichimoku to determine trend. The sensitivity is customizable. The centerline will change color according to the trend detected by ichimoku, and each line can act as support/resistance. The bands of the channel also change colors according to how far price is getting away from them. If you notice in this example, the lower band is turning orange when the price is getting too far away from it, suggesting that it may have risen too fast and too soon. This is still in testing so feel free to comment with any suggestions or fixes.
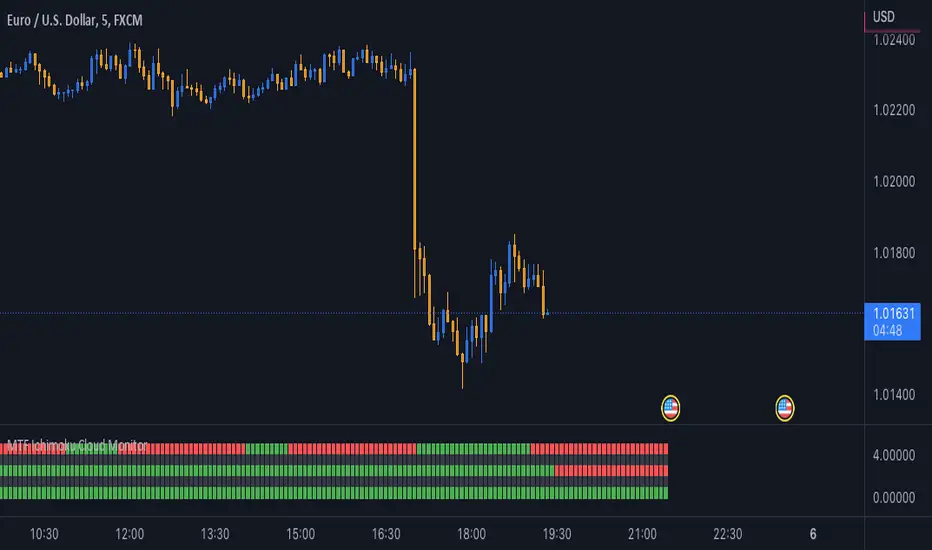
MTF Ichimoku Cloud MonitorIchimoku Kinko Hyo is a technical analysis method that builds on candlestick charting to improve the accuracy of forecast price moves.
his Indicator build for Monitor SenkouSpanA & SenkouSpanB Lines (Kumo Cloud) status and you can watch 3 Time Frames Status on one bar and in one timeframe.
You can select timeframe and set Inputs for lines from Indicator setting.
Good trading to all ...
Chiko-Span Momentum_PineScript_Version5This is Momentum indicator based on "Chiko-span" of Ichimoku Kinko-Hyo.
Differ from normal momentum indicator, this indicator is using "close" and "open" as default parameter which is based on 9 week-candle chart Invented by Ichimoku-Sanjin. And, It is located 26 period before to match chiko-span.
(Parameters can change as you like)
The usage is same as normal momentum indicator so please check momentum indicator usage. However, due to use this indicator, it may support to compare momentum of chiko-span movement and to predict effect 5 lines of ichimoku.
For example, when price break out tenkan-sen, you can measure slope or period of chiko-span momentum and compare previously chiko-span momentum. If momentum is stronger than previously price, we can think that price try to out kijun- sen, touch cloud or break out cloud.
I wish, this indicator helps ichimoku users.
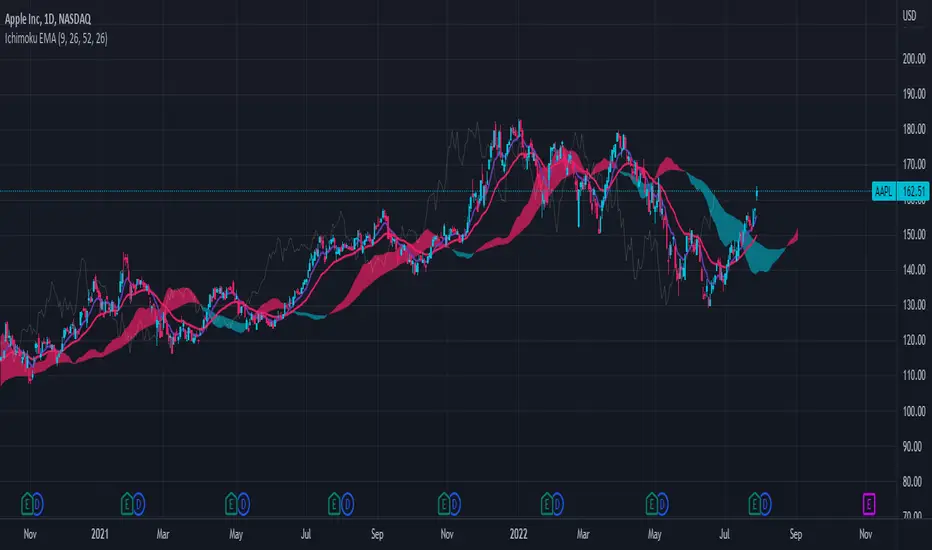
Ichimoku Cloud with EMAThis is a standard Ichimoku Cloud indicator that uses the exponential moving average (EMA) instead of the Tenkan and Kijun Sen.
It provides similar signals as the original but just looks nicer in my opinion.
pickle financialversion 1.0
A multi-use indicator
FEATURES:
1) Robust VWAP with up to 3 deviations that can be adjusted for Session, Week, Month, Quarter, Year, Decade, Century, Earnings , Dividend, & Split intervals
2) 20 customizable Moving Averages that can be changed to EMAs, SMAs , WMAs, SMMAs, and VWMAs; can also be adjusted to Candle Closes, Highs, Lows, Opens, HLC3, HL2 , OHLC4, & HLCC4
-Praise be lady VWAP
