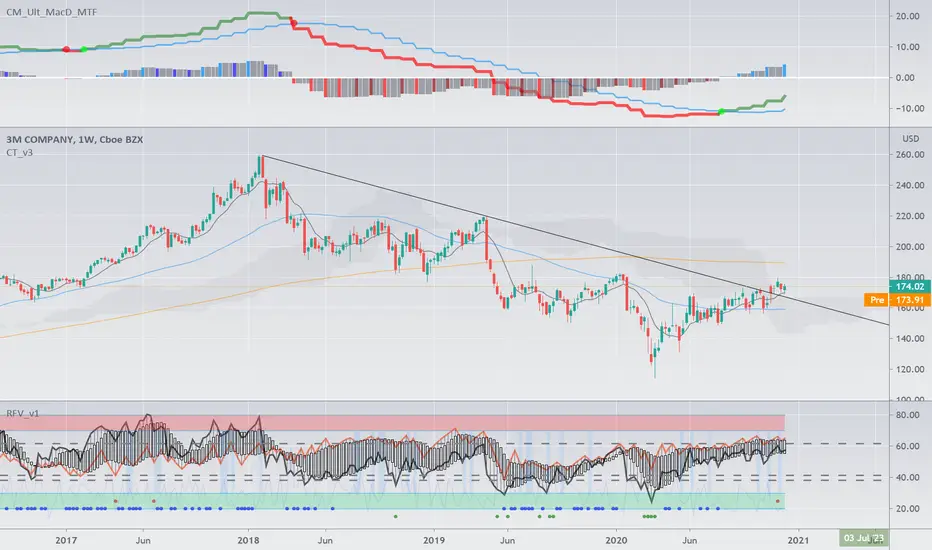
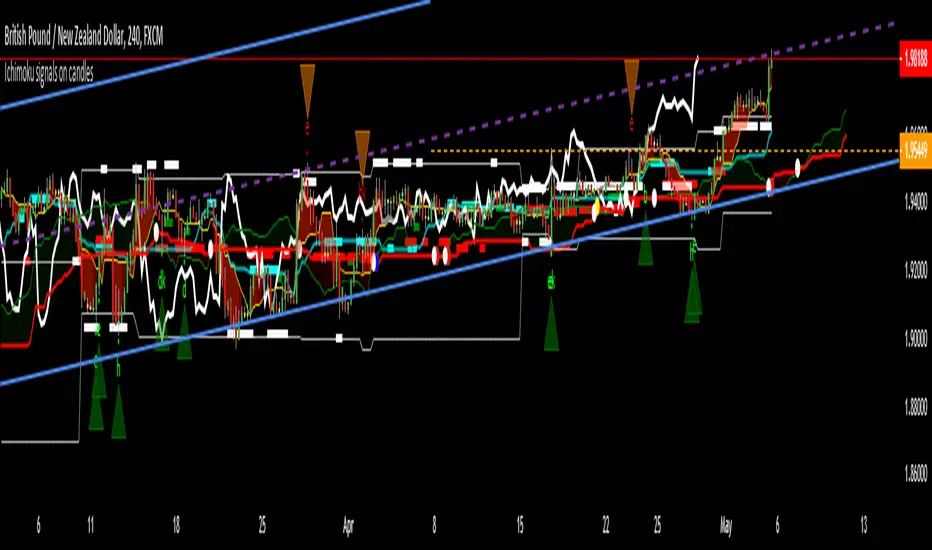
Ichimoku Double Cloud + AutoFibCombined indicator using an ichimoku double cloud derivative.
Ideal use is option swings, using traditional ichimoku rules, targets are adjusted to the current ATR.
Appropriate strikes closest to one of these lines for assisted price targeting.
Ichimoku Cloud
Ali_Trading Tools
This Tools includes the following:
MA:50 with Color Code
MA:100,200
EMA:15
Bollinger Bands
Ichimoku Cloud
Pivot Point High and Low

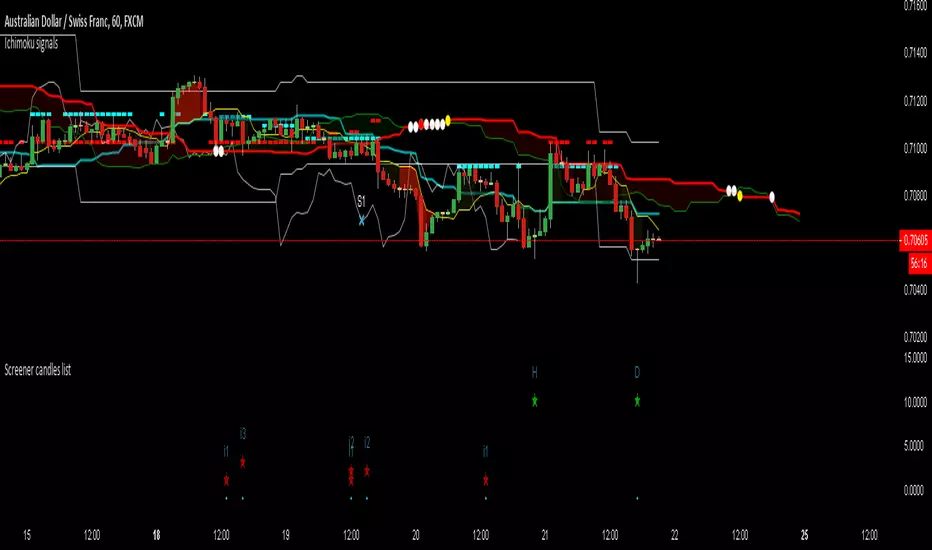
Ichimoku Analyzer☑️Ichimoku Analyzer
-This indicator automatically analyzes the Ichimoku conditions.
- Long and Short signals.
- Allows you to add an MA filter.
-Works in any timeframe or market like Forex, Crypto, Commodities even Stocks.
-Recommended manual trading and bots.
Do you need an Script or an expert adviser for Forex, contact our coding service!
Get this indicator today! contact us.

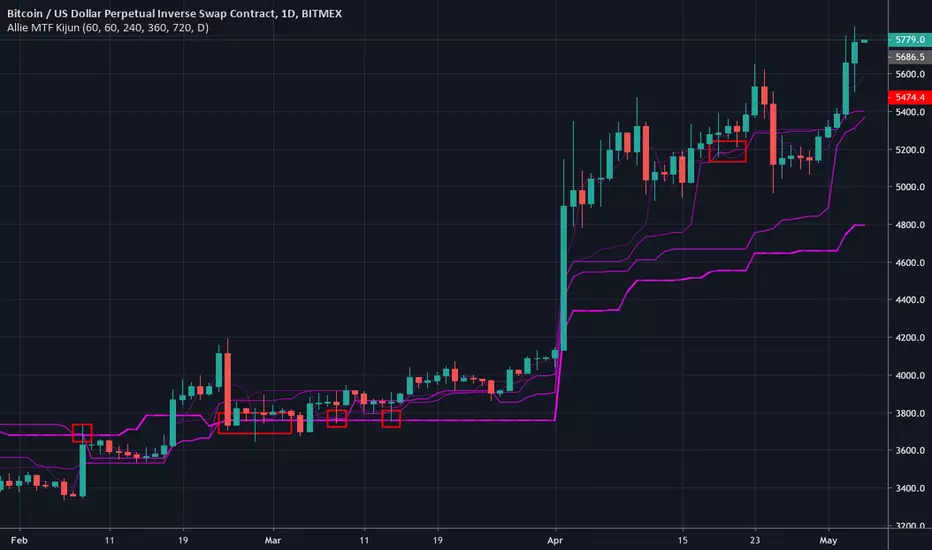
Allie MTF KijunMulti-timeframe kijun. The current timeframe's kijun is represented with dashed line.
Multi time frame Ichimoku TK CrossTK Cross indicators across 5 configurable timeframes (+ current timeframe on the top)
Strong tk crosses are the most opaque.
Weak tk crosses are translucent.
Trends are semi-transparent.
Black means tenkan and kijun are overlapping.

Allie_Ichimoku Cloud-V1Inspired by CM_enhanced_ichimoku_cloud v5.
Adds weak/strong TK-cross detection which is indicated in the background and/or arrows.

Ichimoku JrTenkan Jaune suis le prix
Kijun Orange effet elastique
Chikou ici est maintenant projeter dans le passe
SSA moyenne de tenkan et kijun projeter dans le futur
SSB moyenne des 52 dernieres bougie projeter dans le futur

MokuMasterMokuMaster
MokuMaster is an advanced indicator built on Ichimoku Kinko Hyo.
Perhaps the most powerful function of Ichimoku charts is their depiction of trend conditions at a single glance. This is likely the original purpose of the technique, Ichimoku Kinko Hyo loosely translates to ‘one glance equilibrium chart’. When examining charts we use Ichimoku to determine directional bias. Should we be, 'Resolutely bullish', 'Bullish', 'Neutral', 'Bearish' or 'Resolutely Bearish'.
These categories are derived from the interactions between Price, the Tenkan-sen, the Kijun-sen, the Kumo and the Chikou Span. This can be overwhelming if you are not an accomplished Ichimoku trader.
MokuMaster allows you to view these interactions without the difficulty of interpreting what they mean. The definitions displayed below demonstrate how to use MokuMaster to determine directional bias.
Bright Green - Resolutely Bullish
Green - Bullish
Blue - Neutral
Pink - Bearish
Red - Resolutely Bearish
MokuMaster is designed to assist traders in establishing directional bias and not to replace traditional entry and exit techniques. We recommend using it in conjunction with TrendMaster for best results.
Our Story
Founded in 2018 by IchimokuScholar and C00kie, TrendMaster is a team that produces technical analysis indicators with an emphasis on simplicity and noise reduction. We support a large community with educational content, automated market scanners and mentoring in our private chat rooms. We produce technical analysis indicators geared primarily towards the emerging Cryptocurrency asset class. We provide educational material to assist trader development and host a large online trend following community. All of our products are designed to help traders distinguish relevant information from background noise. Our indicators encourage disciplined trade management to maximise the opportunity captured while minimising losses.
IchimokuScholar
IchimokuScholar – In 2017 I retired from a career in higher education to focus on Trading. I like to trade long term trends, focusing primarily on continuation setups. I am dedicated to sharing my knowledge of trading and take great pleasure in simplifying technical analysis for newer traders.
C00kie
I started trading crypto in 2017 and immediately started coding a bunch of tools to improve my quality of life. Some definitely worked out better than others. Like to trade the higher timeframes and drawing horizontal lines on charts. I am also pretty much obligated to like cookies.

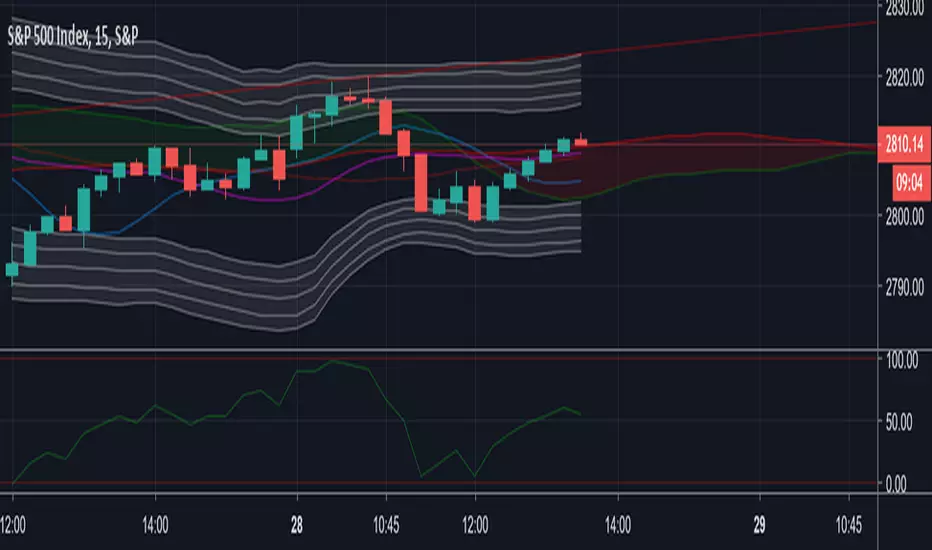
CHOP_LRSI V2.0Incorporated the strategies which are part of the "Flow Tend Indicator Strategy V2" strategy into the CHOP_LRSI study.
Long and Short signals can be displayed below the study. Alerts are supported for every strategy.

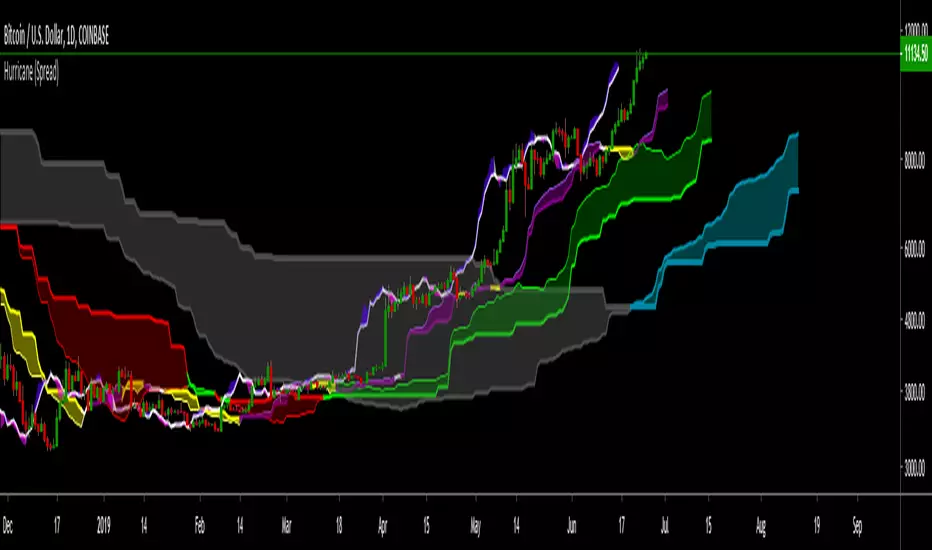
HurricaneThe Hurricane Indicator
This Indicator takes the traditional Ichimoku and expands it's capabilities to a whole new level.
It is a trend based trading indicator that utilises equilibrium calculations from multiple time frames, to reveal areas of support, resistance, strength, weakness, acceleration and momentum throughout the various bull and bear market trends.
By using the three components of the Hurricane together (or individually), it presents the entire picture of micro, mid-term and macro trends, enabling the trader to scalp price movements on a smaller time frame whilst keeping an eye on the larger trend.
For a full write up on what it does and the explained settings follow this link:
docs.google.com
Add this to your favorites, then send me a message through Trading View and I'll grant you temporary access to try it out.
To continue using it after the trial period, send me a message.
BTC: 13UKYNt4AAz2Yh2Suu6AAEWoUEiRVjqC12
LTC: LX4bUBdjiRPsagUbZoAczSGgDC4YqTJL7w
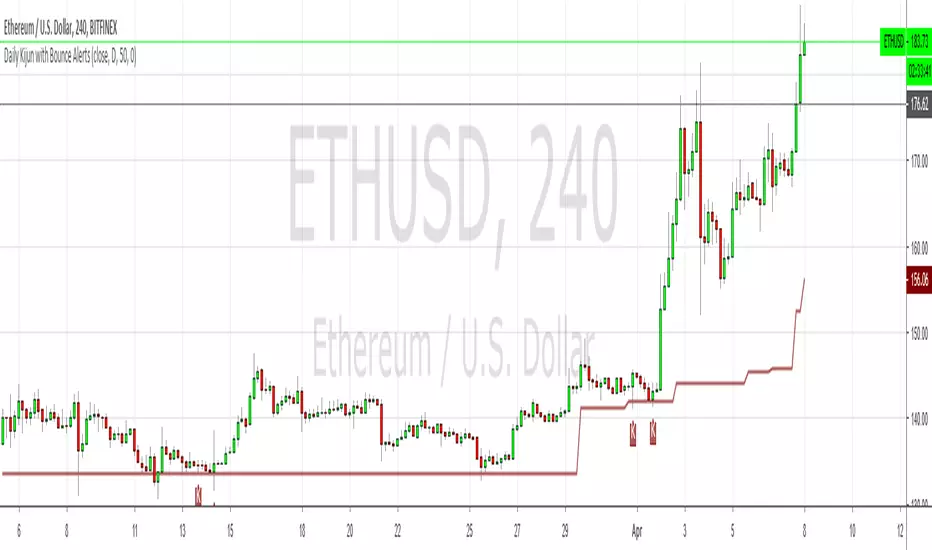
Daily Kijun with Bounce AlertsShows the daily Kijun on all timeframes using a period of 50, which makes it into a dynamic 50% fib of sorts, especially when it's flat. Also shows Kijun bounces labeled with Ks, and allows you to set alerts for bullish, bearish or bi-directional bounces.
It doesn't show any of the other Ichimoku components.
GR3Y IchimokuThe Ichimoku Cloud is a collection of technical indicators that show support and resistance levels, as well as momentum and trend direction. It does this by taking multiple averages and plotting them on the chart.

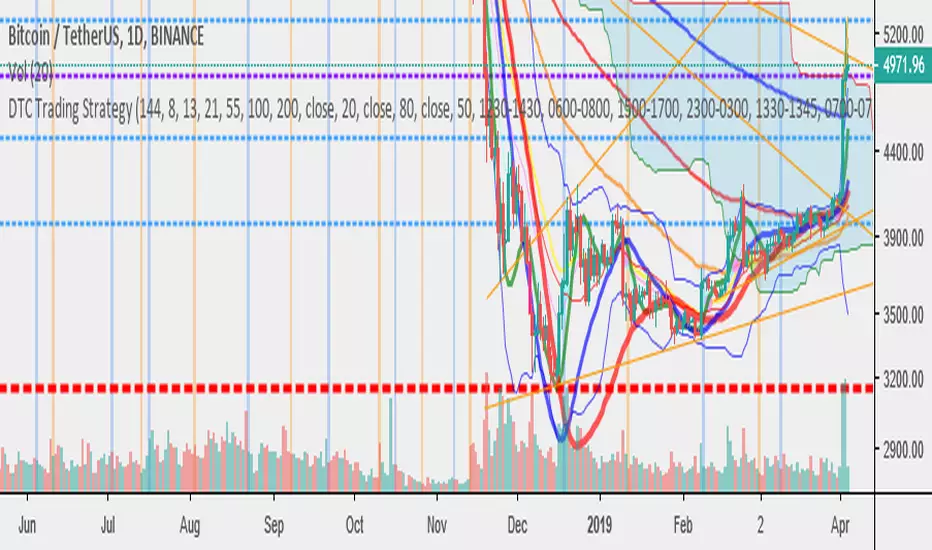
DTC Trading StrategyThe script contains various commonly used indicators, such as:
Bollingerbands
Ichi cloud
HMA
MA
FIB levels
Tran Truong indicatorChỉ báo tìm điểm vào ra thị trường dựa trên phân kỳ hội tụ
bao gồm ichimoku, bollingerband

Helios v1.0 - by @cryptomrdavis -1.0
This is another indicator for you guys. From different indicators its get the signals and combines them into one.
Green marks an uptrend and red an downtrend.
Happy trading
+++ use this tool on your own risk. i'm not responsible for your loses. DYOR +++
____________________________________________________________________________
BTC: 1GVRDK3HHr9CKM5SF2CGpCNXFuavB3L4j9
ETH: 0x7b825fa752b9926D3E8397cDb1d9E5473D074646
XMR: 41zL2SQS7zyZmwXKng2TeUWsMi5vMmkgSdDCjULUTvM6ichwm1E2ZDEYGt56zk9ghoM9bekhjycSwa8amtTcB2JiUet5jtg
NEO: AXja5xPDhczfm2ujHyBfpkQAAnMsXsazmb
TRX: THi1L1v2wHJxmQg6Wk9TgkKLcP6x2oMAwf
ZEC: zcZzFkRx95cp7MtuW8wLhC5zz5RYF9QkT2uPPmhZZHc6ppXepHGgCSeAS1rtD6WFdqsM5p1gZm2gfirnrnviucsdP4aCpqU
XLM: GAXUQJSW55C7MAC4GI26NZUGIKSHFDVFRFKZCXPLMPY4HCADSDT55XK6
WAVES: 3PCMkNpMHxSraTCkwV1ENcBKa9sXbVCGjQX
BCH: qz57n04ud6mn42u00aymqkku8tfh0lk4jv9c28mjvv
tippin.me
____________________________________________________________________________

Volume Weighted High / Low IchimokuSame Idea as standard Ichimoku except using volume-weighted average high / low for the corresponding periods. adjustable displacement / time period inputs.
(YEK) Combo(YEK) Combo is a combination of several indicators (listed below). You can use them together or one by one. Just click settings, and choose which of them to be shown.
Here are the indicators included in this script:
- Ichimoku Cloud
- Bollinger Bands
- Moving Average 1
- Moving Average 2 (In case of detecting golden crosses or death crosses)
- Exponential Moving Average
- T3 Tillson
- MavilimW
Enjoy!

Ichimoku Cloud Daily Offset with Alerts The Skript uses Offsets in both positive and negative direction to give buy and sell alerts.
Use the Script on a daily Timeframe
- No financial advice -
There are 3 Buy and 3 Sell alerts in the Skript.
Buy 1 - B1: Buy e.g. 3%
Buy 2 - B2: Buy e.g. 10%
Buy 3 - B3: Buy e.g. 50%
Sell 1 - S1: Sell e.g. 5%
Sell 2 - S2: Sell e.g. 30%
Sell 3 - S3: Sell e.g. 90%


IchiMA ChannelEstrategia basada en un principio de ichimoku, Green Long , Red Short.
Make it simple.
