Hedge Mini Calculator (Avg Long/Short + Alerts) with dca
Hedge Mini Calculator is a position-management indicator for traders who use long & short hedging.
It plots:
Long average price
Short average price
Optional hedge close level (+% above hedge average)
The indicator also provides alerts when price reaches the long or short average, helping you manage hedge exits and directional bias with precision.
Designed for risk control, not signals.
🔹 How to Use (Simple & Clear)
1. Enter Your Positions
In the indicator settings:
Add the dollar amount and entry price for each long leg
Add the dollar amount and entry price for each short leg
Set your leverage (default x4)
The indicator does not connect to your exchange.
All values are entered manually.
2. Read the Lines
Avg Long line → average entry of all long positions
Avg Short line → average entry of all short positions
Hedge Close line (optional) → price level where you may close shorts and stay long
3. Use Alerts
You can create alerts for:
Price reaching Avg Long
Price reaching Avg Short
Alerts trigger when the candle touches the average price (high–low range).
4. Manage the Hedge
Typical workflow:
Keep both long & short active while price is inside the range
When price moves favorably and reaches your target level:
Close the hedge leg (usually shorts)
Keep the directional position (longs)
5. PnL Awareness
The info table shows:
Estimated Long PnL
Estimated Short PnL
Net PnL (based on margin & leverage)
These values are approximations for decision support.
⚠️ Disclaimer
This indicator is not a trading signal.
It is a position management tool for hedging, scaling, and risk control.
Hedgetrading

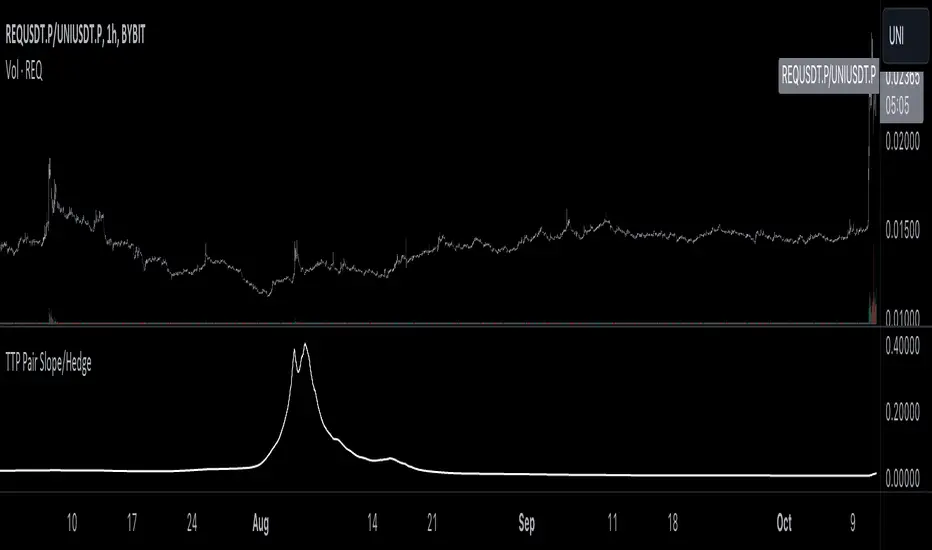
TTP Pair Slope/HedgePair slope/hedge uses linear regression to calculate the hedge ratio (slope) between the two assets within a period.
It allows you to specify a "from" and a "to" candle.
Example:
"A regression from 1000 candles back in time and ignore the last 100 candles. This would result in making a regression of 900 candles in total."
The formula used to perform the regression with the assts X and Y is:
Hedge =
mean( (X-mean(X))^2 )
——————————————————
mean( (X-mean(X)) * (Y-mean(Y)) )
You can later use the hedge in a chart of X - Hedge * Y
(Confirm with 1 / hedge )
If the plot is stationary the period tested should look like stationary.
If you cross an imaginary horizontal line across all the values in the period used it should look like a flat channel with values crossing above and below the line.
The purpose of this indicator is to help finding the linear regression test used for conintegration analysis. Conintegration assets is one of the requirements to consider assets for pair and hedge trading.