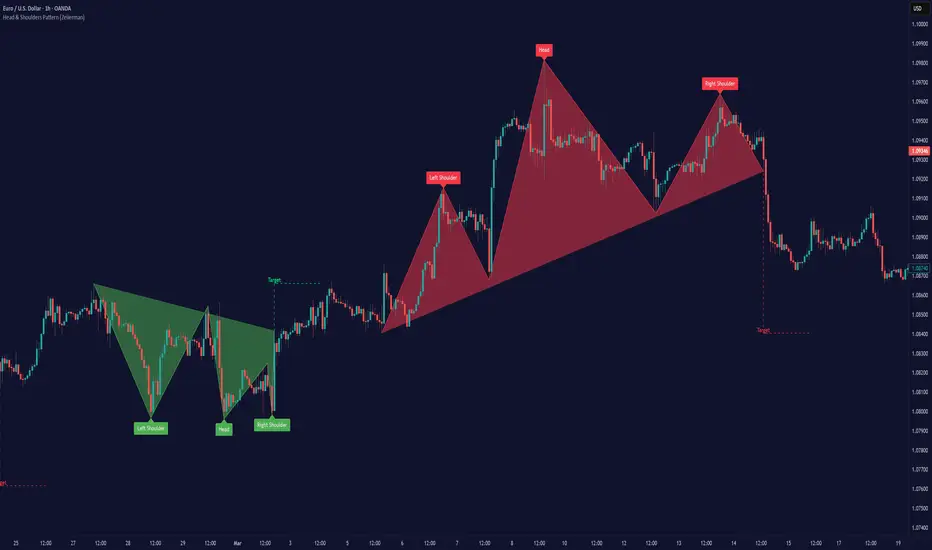
Head & Shoulders Pattern (Zeiierman)█ Overview
The Head & Shoulders Pattern (Zeiierman) is an advanced pattern recognition tool that automatically detects and visualizes one of the most powerful reversal patterns in technical analysis — the classic Head & Shoulders and Inverse Head & Shoulders formations .
This indicator brings structure clarity directly onto the price chart, allowing traders to instantly spot potential major reversal zones without manually drawing or searching for patterns.
It doesn't just draw lines — it intelligently scans price action for symmetry, pivot behavior, and neckline structures — then projects realistic price targets based on the pattern's height.
⚪ In simple terms:
▸ Standard Head & Shoulders → Bearish Reversal Pattern
▸ Inverse Head & Shoulders → Bullish Reversal Pattern
▸ Target Projection → Estimated Move from Neckline Break
▸ Labels → Clear annotation of Left Shoulder, Head, and Right Shoulder
█ How It Works
The indicator combines multiple technical detection layers into a clean visual model:
⚪ Dynamic Pivot Engine
Automatically detects pivot highs and lows based on user-defined Period.
Longer Period = Broader, higher-confidence patterns
Shorter Period = Smaller, more frequent patterns
⚪ Pattern Detection Logic
Scans pivot structures in real-time to identify valid:
Bearish Head & Shoulders (H&S)
Bullish Inverse Head & Shoulders (iH&S)
Conditions include:
▸ Symmetry validation
▸ Head above (or below) Shoulders
▸ Neckline structure
▸ Minimum price conditions met
█ How to Use
⚪ Reversal Trading
Look for Head & Shoulders at the top of an uptrend
Look for Inverse Head & Shoulders at the bottom of a downtrend
⚪ What makes our tool truly unique is that it goes beyond the traditional textbook definition.
Our custom Head & Shoulders algorithm is built with flexibility and adaptability in mind. It dynamically responds to real-time price action, allowing it to detect valid patterns not only at major trend reversals — but also within trending environments.
That means you can spot Head & Shoulders formations at:
Consolidation zones
Trend continuation areas
Corrective phases within established trends
It doesn’t have to be the absolute top or bottom of a move — and that’s the real power of this tool. It adapts. It evolves. It finds structure where most indicators stay blind.
█ Common Real-World Stop Loss Strategies with Head & Shoulders Patterns
Not all Head & Shoulders patterns are created equal — and neither are the stop loss strategies used to trade them.
Depending on your trading style, risk tolerance, and market context — here are the 3 most common ways traders manage stop placement when trading Head & Shoulders (H&S) or Inverse Head & Shoulders (iH&S) patterns:
⚪ Conservative Stop Placement
Maximum Safety — Minimum Chance of Being Stopped Prematurely
Stop Placement:
Above the Head (Bearish H&S)
Below the Head (Bullish iH&S)
Pros: Safest approach. Provides maximum protection against false breakouts and noise.
Cons: Often results in very large stop losses, especially on bigger patterns or higher timeframes. Risk-to-Reward (RR) can be poor unless the target is far.
⚪ Aggressive Stop Placement
Tighter Risk — Faster Invalidations
Stop Placement:
Above the Right Shoulder (Bearish H&S)
Below the Right Shoulder (Bullish iH&S)
Pros: Smaller stop losses. Improved RR. Ideal for traders who want tighter control over risk.
Cons: Higher chance of getting stopped on retests or minor volatility around the neckline zone.
⚪ Neckline Reclaim Invalidation
Dynamic & Price-Action Based Exit
Stop Placement:
Exit the trade if price closes back above (bearish) or below (bullish) the neckline after breaking it.
Pros: Dynamic approach based on market behavior rather than static levels. Allows more flexibility.
Cons: Requires active trade management. Not suitable for fully automated or set-and-forget trading styles.
█ Why It's Useful
This is not a basic pattern drawing tool — it's a complete detection system built for traders who want to:
Automatically detect powerful reversal patterns
Avoid the subjectivity of manually drawing H&S structures
Trade with clear target projections
Identify high-probability reversal zones
Visually map structure shifts in real-time
█ Settings
Pivot Detection
Period → Number of bars used to scan for pivots (Higher = Bigger patterns)
Pattern Detection
Enable Bullish Head & Shoulders
Enable Bearish Head & Shoulders
Visualization
Customize Colors (Lines, Fills, Labels)
Enable/Disable Labels
Pattern Style: Closed / Open
Custom Label Colors
Target Projection
Enable/Disable Target Projection
Customize Target Colors
-----------------
Disclaimer
The content provided in my scripts, indicators, ideas, algorithms, and systems is for educational and informational purposes only. It does not constitute financial advice, investment recommendations, or a solicitation to buy or sell any financial instruments. I will not accept liability for any loss or damage, including without limitation any loss of profit, which may arise directly or indirectly from the use of or reliance on such information.
All investments involve risk, and the past performance of a security, industry, sector, market, financial product, trading strategy, backtest, or individual's trading does not guarantee future results or returns. Investors are fully responsible for any investment decisions they make. Such decisions should be based solely on an evaluation of their financial circumstances, investment objectives, risk tolerance, and liquidity needs.
Headshoulders
Pro Trading Art - Head And ShouldersHow the Script Works:
1. The script identifies potential Head and Shoulders patterns by searching for specific pivot highs and pivot lows in the price data.
2. It checks for the presence of a left shoulder, head, and right shoulder based on the conditions defined in the script.
3. If a valid Head and Shoulders pattern is found, the script plots lines and labels on the chart to visualize the pattern.
4. The script also identifies Inverted Head and Shoulders patterns using similar logic but with different conditions.
5. It plots lines and labels for the Inverted Head and Shoulders pattern.
6. The script generates short and long conditions based on the patterns. Short conditions trigger when the close price crosses below the neck level of a Head and Shoulders pattern, while long conditions trigger when the close price crosses above the neck level of an Inverted Head and Shoulders pattern.
7. It plots sell and buy signal shapes on the chart when the short and long conditions are met, respectively.
8. The script can also trigger alerts to notify the user when a valid Head and Shoulders or Inverted Head and Shoulders pattern is detected.
9. The script provides visual cues on the chart to help users identify potential trading opportunities.
10. The logic and parameters of the script can be modified by the user to customize the behavior and adapt it to different trading strategies.
How Users Can Make Profit Using This Script:
1. Identify potential short-selling opportunities: When a valid Head and Shoulders pattern is detected and a short condition is met, it indicates a potential trend reversal. Traders can consider opening short positions to profit from a downward price movement.
2. Identify potential long-buying opportunities: When a valid Inverted Head and Shoulders pattern is detected and a long condition is met, it suggests a potential trend reversal. Traders can consider opening long positions to profit from an upward price movement.
3. Combine with additional analysis: Users can utilize this script as a tool in their overall trading strategy. They can combine the signals generated by the script with other technical indicators, fundamental analysis, or market sentiment to make more informed trading decisions.
4. Define appropriate entry and exit points: Traders can use the lines and labels plotted by the script to determine entry and exit points for their trades. For example, they may choose to enter a short position after the price crosses below the neck level and exit when the price reaches a predetermined target or when the pattern is invalidated.
5. Set risk management measures: It is important for users to implement proper risk management strategies when trading based on the script's signals. They should define stop-loss orders to limit potential losses if the trade goes against them and consider setting profit targets to secure profits when the trade moves in their favor.

Pivot Highs&lows: Short/Medium/Long-term + Spikeyness FilterShows Pivot Highs & Lows defined or 'Graded' on a fractal basis: Short-term, medium-term and long-term. Also applies 'Spikeyness' condition by default to filter-out weak/rounded pivots
ES1! 4hr chart (CME) shown above, with lookback = 15; clearly identifying the major highs & lows on the basis of how they are fractally 'nested' within lesser Pivots.
-- in the above chart Short term pivot highs (STH) are simply represented by green 'ʌ', and short-term pivot lows (STL) are simply represented by orange 'v'.
//Basics: (as applying to pivot highs, the following is reversed for pivot lows)
-Short term highs (STH) are simple pivot highs, albeit refined from standard with the 'spikeyness' filter.
-Medium-term highs (MTH) are defined as having a lower STH on either side of them.
-Long-term highs (LTH) are defined as having a lower MTH on either side of them.
//Purpose:
-Education: Quick and easy visualization of the strength or importance of a pivot high or low; a way of grading them based on their larger context.
-Backtesting: use in combination with other trading methods when backtesting to see the relative significance and price sensitivity of LTHs/LTLs compared to lower grade highs and lows.
//Settings:
-Choose Pivot lookback/lookforward bars: One setting, the basis from which all further pivot calculations are done.
-Toggle on/off 'Spikeyness' condition to filter-out weak/rounded/unimpressive pivot highs or lows (default is ON).
-Toggle on/off each of STH, MTH, LTH, STL, MTL, LTL; and choose label text-styles/colors/sizes independently.
-Set text Vertically, horizonally, or simply use 'ʌ' or 'v' symbols if you want to declutter your chart.
//Usage notes:
-Pivots take time to print (lookback bars must have elapsed before confirmation). Fractally nested pivots as here (i.e. a LTH), take even longer to print/confirm, so please be patient.
-Works across timeframes & Assets. Different timeframes may require slightly tweaked lookback/forward settings for optimal use; default is 15 bars.
Example usage with just symbolic labels short-term, med-term, long-term with 1x, 2x and 3x ʌ/v respectively:

Chart pattern - Head and ShouldersThis script identifies the Head and Shoulders chart pattern as well as the reversed Head and Shoulders chart pattern.
It has many settings. For example, you can choose by what points you want to identify patterns - along the edges of wicks (tails, shadows), or along the edges of candle bodies .
In addition, there are several settings with which you can determine the parameters of the detected patterns - the length and ratio of the lines included in it.
The "Sensitivity" parameter will allow you to control the frequency of detected patterns , depending on whether you want the patterns to be detected more often, or if they cover a larger number of candles and thus be more reliable.
You can also customize your styles.
All key settings are accompanied by tooltips.
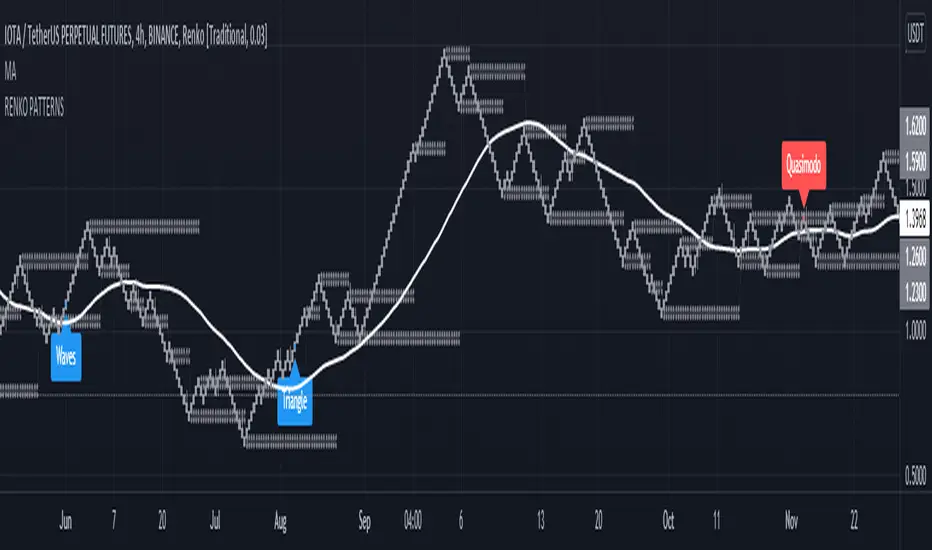
Head and Shoulders - Quasimodo etc Pattern Recognition RENKODisclaimer: Only use this pattern recognition on a RENKO chart. Renko charts plot different than traditional candles and therefore do not represent all price moves. There is a possibility of repainting while using ATR based renko charts so past results are not a 100% accurate representation of future results. Use this indicator as a part of your strategy and not as your only means of obtaining gains in the market.
Hello traders, it has been said time and time again that algorithmic software is unable to identify complex market structure like head and shoulders, quasimodo, triangle patterns and other methods humans use to base their trading decisions on. With this indicator I intend to completely crush that assumption and prove that it actualy is possible. Ofcourse an indicator is less likely to find all variation on a chart pattern and a human is probably still your best bet in finding these patterns early.
That is wy this indicator does not only use textbook patterns and has 7 variation on head and shoulders build into it. I will keep updating this indicator if I see it missed some crucial patterns. Right now it has a total of 38 patterns build into it with them being grouped under specific names. Feel free to turn off any pattern you do not like to see.
Renko patterns solve the problem of time and chaos in the markets which have been the biggest hurdle in pattern recognition software as the amount of variations to account for is just too great a number. With this script using renko it will soon be able to identify any pattern in the market and I plan to add Wyckoff to it in the future, right now I have a beta version of Wyckoff build into it but planning to add better version of it in the future. The amount of variations on Wyckoff is quite extreme so it will take a very long time to get an optimised Wyckoff identification system.
If you do not want to miss patterns I recommend to use a multi chart aproach so that you can find patterns in multiple renko brick sizes at the same time to find more entrys.
Feel free to comment any pattern you want me to add and let's make the most dedicated pattern recognition software on this platform.
Regards
HonestCowboy