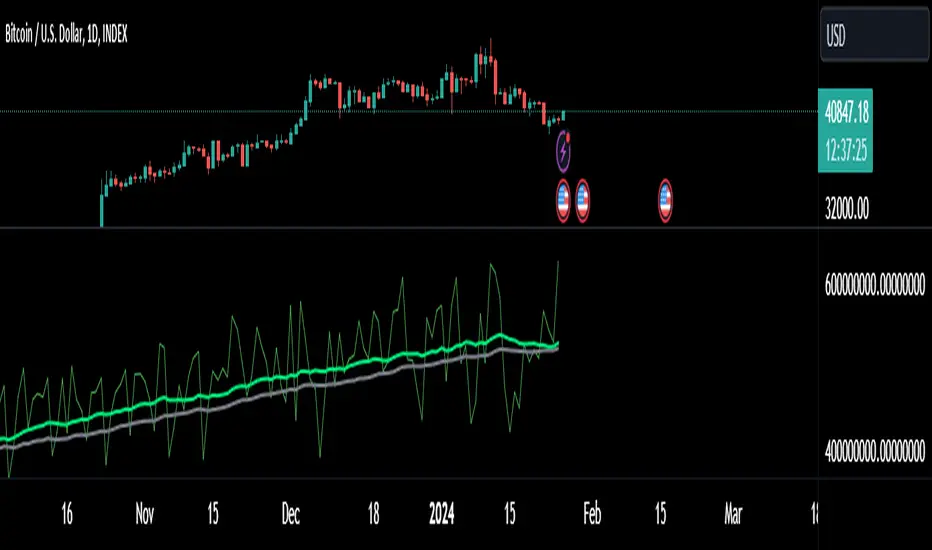
HIFI BTC Daily Hashrate Momentum OscillatorThe "HIFI BTC Daily Hashrate Momentum Oscillator" indicator is an oscillator that analyzes the "health" and confidence of miners in the Bitcoin network. It measures the momentum of hashrate changes using its deviation from the 30-day and 60-day moving averages. A rising hashrate is often a leading or confirming bullish trend indicator for the price of BTC.
Main Idea
Hashrate is the total computing power involved in mining. Its growth indicates increased investment in network security and miners' confidence in future profitability.
Blue Oscillator (fast): Shows the short-term dynamics of hashrate growth.
Green Oscillator (slow): Indicates the long-term trend of hash rate changes.
Chart background: The green background signals the acceleration of the hash rate growth (short-term momentum is higher than long-term), which is a positive sign.
How to Read Signals
A Buy signal appears when two fundamental conditions coincide:
Growth acceleration: The short-term hashrate momentum becomes stronger than the long-term one (the blue line crosses the green one from bottom to top). This indicates that miners are actively building capacity.
Exit from stagnation: This acceleration occurs after a period of weak hashrate growth or decline (the green line is below the red dashed line).
This combination indicates the potential start of a new cycle of growth and confidence in the network, which historically has often preceded the rise in the price of Bitcoin itself.
Disclamer: This indicator is an analysis tool and should not be considered as a direct financial recommendation. Always do your own analysis before making trades.
Hashribbons

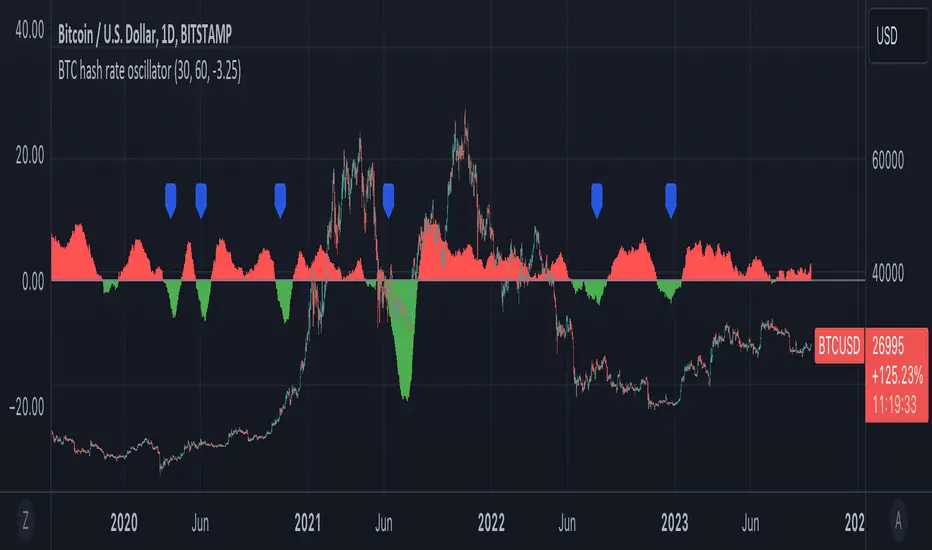
BTC hash rate oscillatorOVERVIEW:
This script looks to identify entry point opportunities when moving averages over Bitcoin's hash rate are indicative of Miner capitulation. The script implements an oscillator based on Charles Capriole's "Hash Ribbons & Bitcoin Bottoms" concept. It analyses the short-term and long-term moving averages of Bitcoin's hash rate and then identifies potential entry opportunities from this.
KEY FEATURES:
Signal Generation: The script identifies entry points when the short-term moving average crosses under the long-term moving average and the rate of change falls below a specified threshold. These conditions suggest potential trading opportunities.
Historical Signals: Optionally the script displays historical signals, indicating past instances where hash rate conditions suggested favourable entry points. Users can also assess the script's historical performance.
USAGE:
The generated opportunities can be used as potential entry points for BTC. The script provides visual cues on the chart (blue labels above the miner capitulation zones) for identification of signals. Customisable moving average lengths and threshold values are supported, which allow adaptation to various strategies.
CONSIDERATIONS:
Validation: It's recommended that careful backtesting over historical data be done before acting on any identified opportunities.
User Discretion: Trading decisions should not rely solely on this script. Users should exercise their judgment and consider market conditions.
Note: This script identifies opportunities based on historical data and should be used with caution, as past performance is not indicative of future results.
Trend Tracer IndexThis is the first iteration of an effort to make multiple well-known analytical tools collaborate to help give an objective consensus to the current market conditions.
This indicator ONLY works on a 1 Day Bitcoin Chart!
It contains the following indicators:
Puell Multiple (ours: )
Hash ribbons (by capriole_charles: )
Weekly moving average
Logaritmic growth curve (by quantadelic: )
Stock to flow model (ours: )
Each indicator can be viewed one at a time as either an overlay or oscillator version of itself. Make sure to read the tooltip (the little "i") on how to switch between them since you need to manually move it between the oscillator pane and the chart pane.
A global index was added which will take the average of all these indicators to show the final consensus.
You can assign weights to each indicator, this will affect the Global index. They can be viewed as a 0 to 1 or a 0 to 100 scale, it should work the same.
For example if you don't want the stock to flow index as part of your equation leave that at 0, maybe you want the weekly moving average at half it's weight you can put it at 0.5. This way the global index average will primarily be decided by the other 3 indicators, and slightly be affected by the weekly moving average.
There is a table that contains all the index values of each indicator for a quick overview.
Finally, alerts have been added for each indicator and the global index.
I will maintain this indicator with updates and perhaps even add more analytical tools based on any suggestions.

BTC Hashrate ribbonsBTC Hash Rate ribbons / Hash Rate cross
This strategy goes long when BTCs Hash Rate 30 day moving average crosses above the 60 day moving average, signifying that miner capitulation is over and recovery has started.
When the opposite signal is given, which signifies the beginning of miner capitulation, the strategy goes short (or flat, depending on configuration). This is generally considered the most popular Hash Rate related strategy.
The strategy is based on this medium article: medium.com
Thanks to the recent integration of IntoTheBlock data into Tradingview, we can now effortlessly show Hash Rate data on our chart,
keep in mind however, that IntoTheBlock doesn't provide Hash Rate data on timeframes below daily, so this strategy is based used on the daily, weekly or even monthly time frames.
Hash Rate definition:
The Bitcoin hash rate is the number of times per second that computers on the Bitcoin network are hashing data to verify transactions and perform the encryption that secures the network. The hash rate is an indicator of how healthy the Bitcoin network is at any given time, and is driven primarily by difficulty mining and the number of miners. Generally, a high hash rate is considered a good thing.
More precisely, the Bitcoin hash rate is the number of times per second that computers on the Bitcoin network are hashing data to verify transactions and perform the encryption that secures the network.

BTC Hashrate with smoothingBTC Hashrate with smoothing - thanks to the recent integration of IntoTheBlock data into Tradingview, we can now effortlessly show Hashrate data on our chart.
One popular use for Hashrate is to buy when the 30 day moving average crosses above the 60 day moving average, signifying that miner capitulation is over and recovery has started.
Definition
The Bitcoin hash rate is the number of times per second that computers on the Bitcoin network are hashing data to verify transactions and perform the encryption that secures the network. The hash rate is an indicator of how healthy the Bitcoin network is at any given time, and is driven primarily by difficulty mining and the number of miners. Generally, a high hash rate is considered a good thing.
More precisely, the Bitcoin hash rate is the number of times per second that computers on the Bitcoin network are hashing data to verify transactions and perform the encryption that secures the network.

Hash Ribbons Backtest - Bitcoin Beats YT
Hello Hello Hello and welcome back to Bitcoin Beats!
This is a script written by capriole_charles
Go check out the original!
I have added leverage and stoploss % but also made it a strategy so we can look back at past trades to see patterns and profit.
Personally I feel this is not enough data to trade off as BTC is such a young asset. However I have seen other models similar to this for other assets that hold strong.
Trade safe!
Good bye from bitcoin beats!
Not Meant For The 1H! My Bad! higher timeframes are better!
The "Spring" is the confirmed Miner capitulation period:
The 1st "gray" circle is the start of Capitulation (1 month Hash Rate crosses UNDER 2 month Hash Rate)
Last "green" circle is the end of Capitulation (1 month Hash Rate crosses OVER 2 month Hash Rate)
The "greener" the spring gets (up until blue) represents Hash Rate recovery (it is increasing)
The "blue" circle is the first instance of positive momentum following recovery of Hash Rate (1m HR > 2m HR). This is historically a rewarding place to buy with limited downside.