Advanced Fundamental & Technical DashboardAre you tired of constantly switching tabs to check a company's fundamental data?
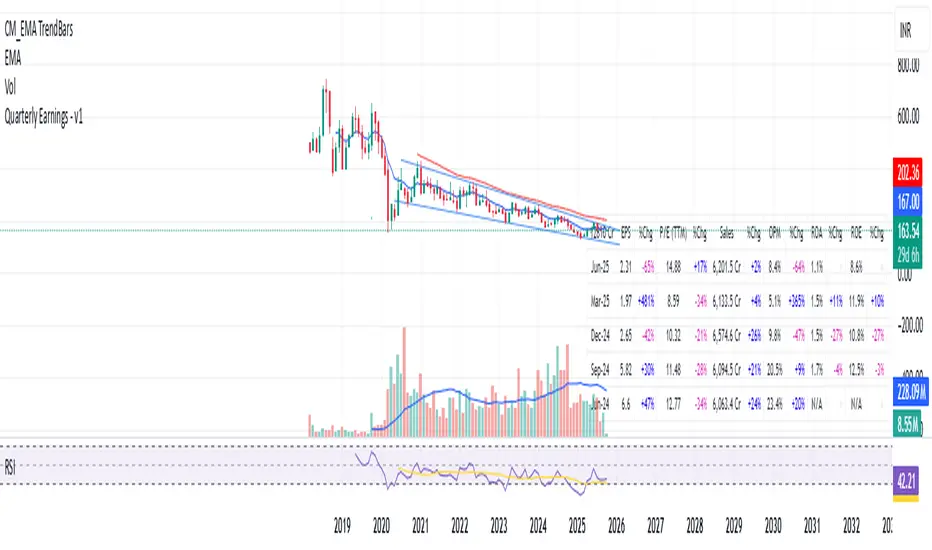
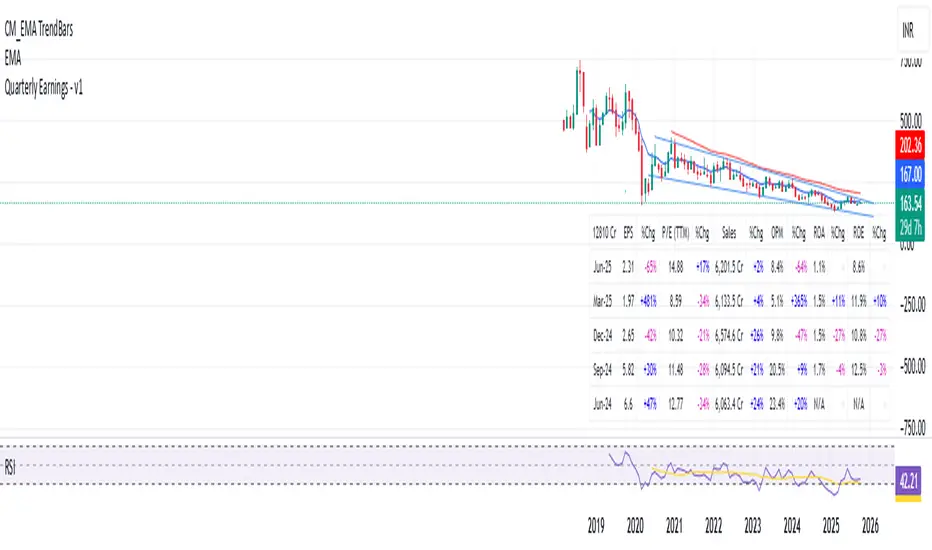
The Advanced Fundamental Dashboard is a clean, fully customizable overlay that displays the most critical financial metrics and ratios directly on your chart. Designed for investors and swing traders, this script provides a quick, color-coded snapshot of a company's financial health and its current position relative to historical price extremes.
📊 Key Metrics Included:
Market Capitalization
Valuation Ratios: P/E Ratio (Price-to-Earnings) & P/S Ratio (Price-to-Sales)
Revenue 1Y Growth: Automatically calculates the 1-year trailing revenue growth.
Core Financials: EBITDA, Free Cash Flow, Total Debt, and Total Equity.
Dividend Yield: Smartly handles missing data (displays 0.00% instead of annoying "N/A" errors for non-dividend paying stocks).
Distance to ATH & ATL: Shows exactly how far the current price is from its All-Time High and All-Time Low in percentage.
✨ Smart Features & Customization:
Dynamic Coloring: Positive values and growth are automatically highlighted in green, while negative values and drawdowns are highlighted in red.
Clean UI: Gracefully handles missing data from the broker feed (e.g., showing "-" instead of script-breaking errors).
Fully Customizable: Don't like the position or the colors? Use the script settings (gear icon) to change the table's position, text size, background color, and text colors to perfectly match your chart theme (Light or Dark mode).
💡 Pro-Tip for ATH / ATL:
To get the most accurate "Distance to ATH/ATL" readings, make sure to zoom out to a Weekly (1W) or Monthly (1M) timeframe once, so TradingView can load the maximum amount of historical price data into the script's memory.
Pine Script® Indikator